Archive for Featured Photo

Here’s Why the Ozzie Albies Deal Was Terrible

Dan Szymborski has already laid out why Ozzie Albies’ recent extension with the Atlanta Braves is surprising, and a bargain for the team. He detailed the hundreds of millions of dollars Albies is potentially giving up by signing this contract. This post deals less with Albies’ future and more with his past. We can speculate on what Albies might do in his career and what he might be worth, but we don’t need to speculate about what he’s already done and what other players in similar situations have received in contract extensions.

Since 2014, nine players have signed contract extensions after accruing at least one year of service time and less than two. These were all players needing five full seasons to reach free agency, and each signed away at least one year of free agency based on a search of MLB Trade Rumors. Here’s the career WAR of each of those players when they signed that contract.

Albies compares favorably to the two best players on this list, Christian Yelich and Andrelton Simmons.

Now, here’s how each of these players did on their guarantees.

Yelich and Simmons got over $50 million each, but their guarantees were about 50% higher than the one Albies just got.

Generally, teams pay extra for free agent years. Here’s how many free agent seasons the above guarantees bought out. Read the rest of this entry »


Their Powers Combined: Finding the Best of Trout and Harper

By now — and barring a mid-career role reversal — the arguments over the relative greatness of Mike Trout and Bryce Harper have been settled in favor of the Millville Meteor. Trout has perennially played at an MVP-caliber level since 2012, winning the award twice while finishing second four times and fourth once, the year that he missed more than a quarter of the season due to a thumb injury, and — as of this week — has climbed to sixth in the JAWS rankings among center fielders. Harper owns one MVP award and might have won a second if not for a late-season knee injury in 2017, but in terms of consistency and overall levels of accomplishment, he’s second banana. Trout has chalked up five seasons worth at least 9.3 WAR, which matches Harper’s best, but the latter’s second- and third-best seasons merely add up to 9.2 WAR. As Jeff Sullivan put it in his penultimate post, “Mike Trout Has Been as Good as Manny Machado and Bryce Harper Combined.”

Yet Trout and Harper remain inextricably linked in the minds of many (including this scribe) in part because on the day that Harper debuted in the majors (April 29, 2012), Trout returned from Triple-A for good, and both players took their respective leagues by storm en route to Rookie of the Year awards. Though separated by about 14 months in age, they’re part of a baseball cohort in a way that Trout and Paul Goldschmidt or Giancarlo Stanton (whose totals of plate appearances are all in the same vicinity), or Harper and Machado (whose free agencies coincided) are not. The relatively stoic Trout and the more demonstrative Harper pair well as contrasts, too. Trout is so routinely great without calling attention to himself that he sometimes recedes into the background, to the point of being forgotten, while Harper’s combination of hot streaks and exuberance is more eye-catching — in grabbing our attention, he also reminds us that hey, that other guy is playing even better.

The dynamic duo are currently scalding the ball, in case you haven’t noticed. Harper, who signed a record-setting 13-year, $330 million contract, is off to a flying start with the Phillies (.314/.500/.743, four home runs, and a 198 wRC+ through Wednesday).

Trout, who signed a record-setting $12-year, $430 million extension less than three weeks after Harper inked his deal, is flying even higher (.406/.592/.938, five home runs, and a 288 wRC+).

The coincidence of their current hot streaks got me wondering whether we’re seeing their collective apex, the peak pair. The answer, within the way I chose to address the matter, is “pretty damn close.” For this, I called upon our player graphs tool — putting the graphs in FanGraphs, after all — to calculate each player’s rolling 10-game wRC+ since the aforementioned point of arrival in 2012. This ignores defense, for which we can’t get any kind of reliable read across 10 games anyway, and makes the familiar squiggly pictures, like so…
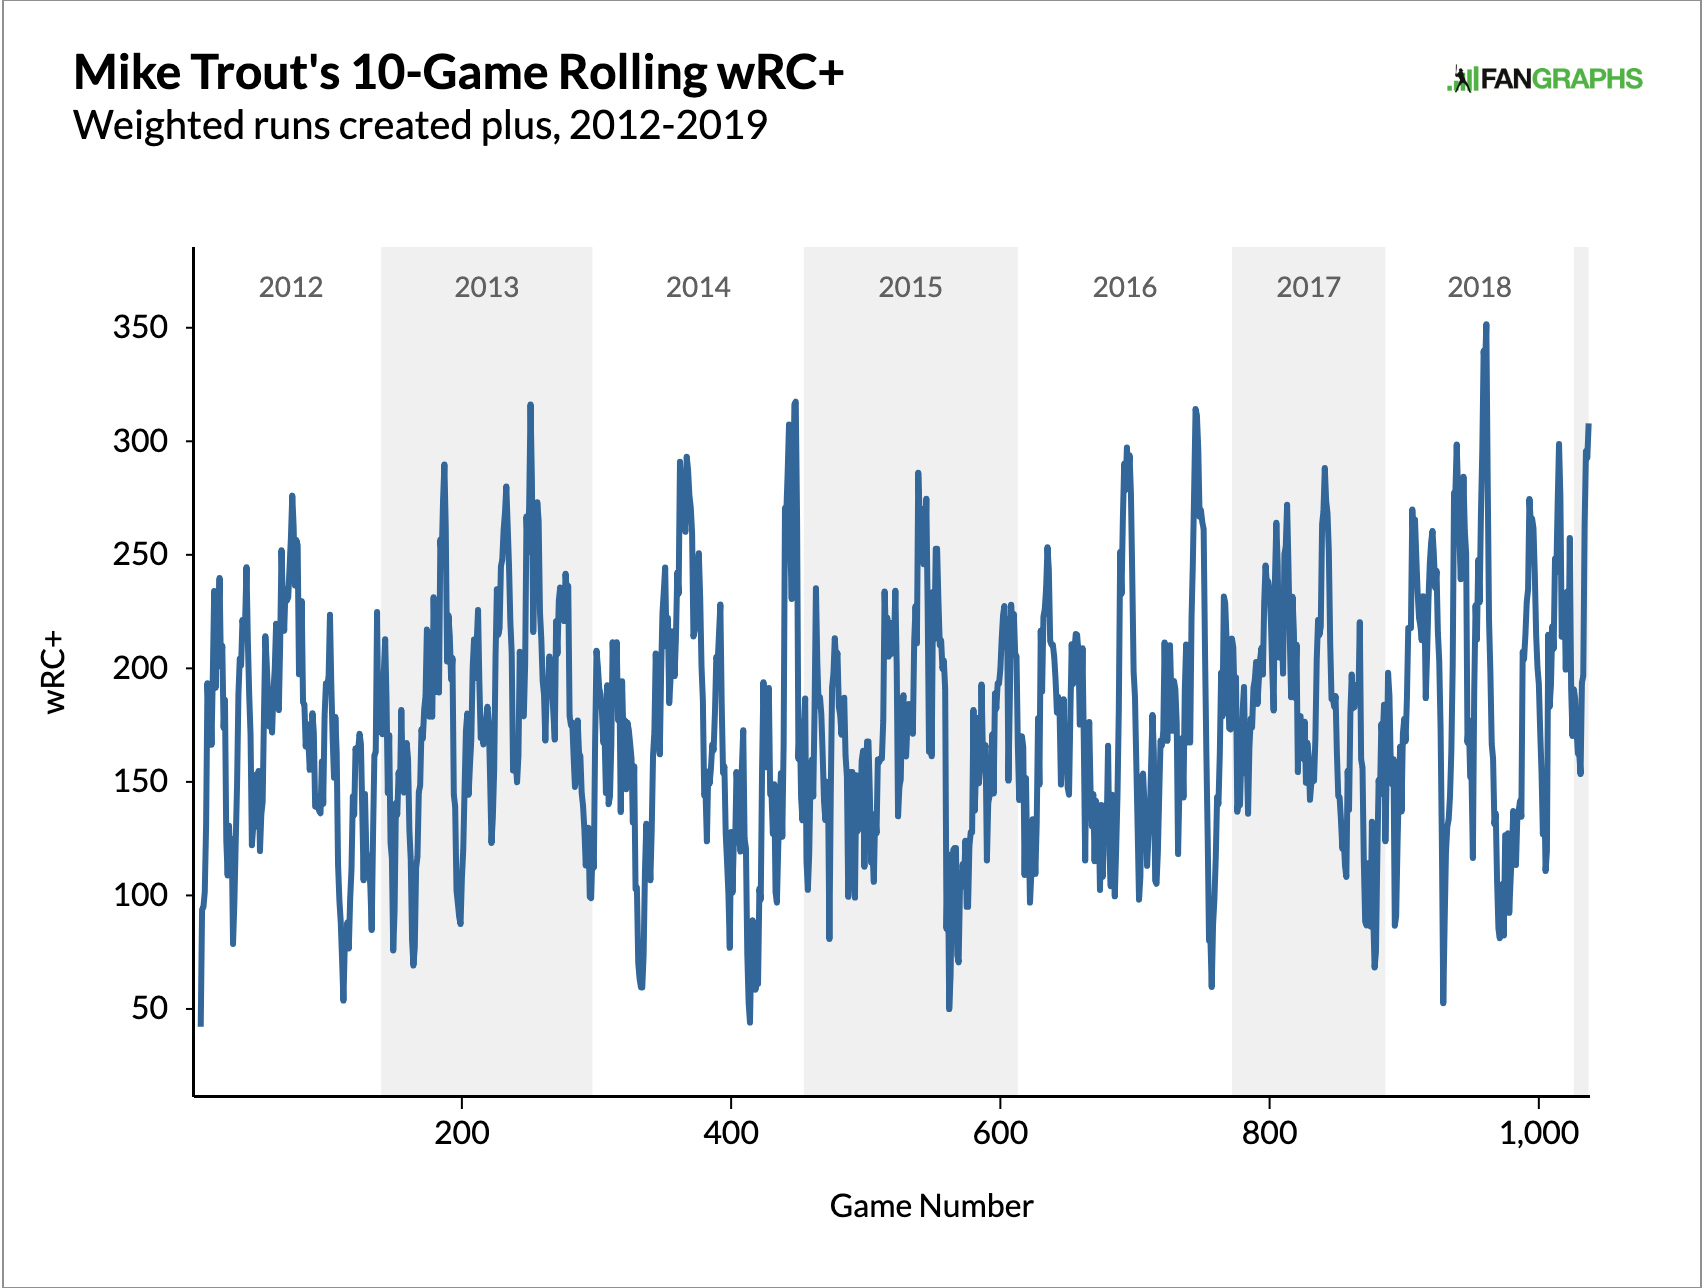
…And so…

Using that page’s “Export Data” function, I calculated the pair’s combined wRC+ for every date on which they both played and had the requisite 10 games in the sample (we’re not yet to 15 games for either player in 2019, hence this choice). That means that if one player was on the disabled list, or even had an off day, there’s no data point for that day. On the other hand, each player’s 10-game range might have different dates attached due to such absences.

Here’s the top 20 of the pair’s most productive stretches, with overlapping 10-game spans included:

Highest Combined 10-Game wRC+ for Trout and Harper
Rk Season End Trout PA Trout wRC+ Harper PA Harper wRC+ Combined wRC+
1 2017 4/26/17 44 209.0 43 369.9 288.5
2 2015 5/16/15 43 154.4 44 403.2 280.2
3 2015 5/17/15 43 154.4 45 376.9 268.1
4 2017 4/27/17 43 197.3 44 326.5 262.7
5 2015 7/20/15 44 274.7 40 149.5 261.4
6 2015 9/23/15 44 223.4 42 297.6 259.7
7 2019 4/9/19 40 313.8 45 208.0 257.8
8 2017 4/25/17 43 204.3 42 311.9 257.5
9 2015 6/20/15 41 234.2 42 279.6 257.2
10 2017 4/28/17 44 229.0 45 283.4 256.5
11 2017 4/21/17 42 194.9 47 309.4 255.4
12 2015 6/16/15 41 220.0 43 285.3 253.5
13 2015 9/22/15 43 213.1 42 289.6 250.9
14 2015 9/19/15 43 193.4 41 304.7 247.7
15 2015 5/15/15 42 112.4 44 366.8 242.6
16 2015 7/10/15 45 286.2 43 193.3 240.8
17 2016 9/3/16 46 314.3 42 158.8 240.1
18 2013 8/7/13 45 316.2 42 158.1 239.9
19 2017 4/22/17 42 202.8 46 273.6 239.8
20 2017 4/24/17 43 195.1 42 285.3 239.7

As it turns out, April 9 — the point at which Harper reached 10 games this year (Trout had done so two days earlier), and the last point for which we have data, because Trout hasn’t played since then due to a groin strain that we’re all praying is minor — is the end of the seventh-best such stretch. Trout’s videogame-like numbers you saw above; Harper was hitting .333/.511/.788 for a 210 wRC+ before taking an 0-for-3 and an early exit from Wednesday night’s 15-1 drubbing by the Nationals. The heavyweight championship belongs to a stretch in late April 2017 during which Harper hit .588/.674/1.206 with five homers, with Trout at .375/.432/.725 and three homers.

One aspect of this that’s particularly striking is that we have to dig down to the 19th spot to find a combined performance that lands in an even-numbered year. Harper hit for a career-low 111 wRC+ in that 2016 season, four points lower than in 2014 and nine points lower than in 2012. For some weird reason, he’s simply been better in odd-numbered years, like two-time Cy Young winner Bret Saberhagen.

Condensing the above table to remove the overlapping streaks (i.e., tossing out the third-ranked streak, because most of it is already represented within the second-ranked streak) yields this top 10:

Highest Combined 10-Game wRC+ for Trout and Harper, No Overlap
Rk Season End Trout PA Trout wRC+ Harper PA Harper wRC+ Combined wRC+
1 2017 4/26/17 44 209.0 43 369.9 288.5
2 2015 5/16/15 43 154.4 44 403.2 280.2
3 2015 7/20/15 44 274.7 40 149.5 261.4
4 2015 9/23/15 44 223.4 42 297.6 259.7
5 2019 4/9/19 40 313.8 45 208.0 257.8
6 2015 6/20/15 41 234.2 42 279.6 257.2
7 2016 9/3/16 46 314.3 42 158.8 240.1
8 2013 8/7/13 45 316.2 42 158.1 239.9
9 2012 10/1/12 46 224.9 43 250.3 237.2
10 2016 7/3/16 47 297.3 48 146.7 221.2

From a contemporary standpoint, that’s more satisfying, as this season’s opening salvo climbs to fifth (not third, as I originally had it when this published — score that E6). Streaks from every season except 2014 and ’18 are represented, with the 2015 season, Harper’s MVP year, dominating the charts, as separate streaks from May, June, July, and September all rank among the top six. Harper pulls his weight here, owning the higher wRC+ of the pair (highlighted with the bold-faced numbers) in five of the streaks .

As for the coldest spells, I’ll skip to the mirror image of the second table, identifying only the extremes of each discrete streak:

Lowest Combined 10-Game wRC+ for Trout and Harper, No Overlap
Rk Season Date Trout PA Trout wRC+ Harper PA Harper wRC+ Combined wRC+
1 2016 9/17/16 41 59.7 42 32.8 46.1
2 2016 7/29/16 43 106.5 40 16.6 63.1
3 2012 8/15/12 45 136.2 45 15.2 75.7
4 2018 5/19/18 39 118.8 44 37.9 75.9
5 2013 9/28/13 45 99.3 40 54.5 78.2
6 2012 9/25/12 43 113.4 41 52.7 83.7
7 2014 8/2/14 47 101.3 42 66.7 85.0
8 2016 5/30/16 46 115.3 37 50.8 86.6
9 2014 8/17/14 47 44.0 44 135.4 88.2
10 2015 8/18/15 43 70.5 46 108.2 90.0

Above we’ve got almost entirely even-year streaks, with one exception apiece from 2013 and ’15. Every season but 2017 and this one is represented, with 2016 the most common one. During the very worst stretch, in September 2016 — a rare instance of both players falling well below 100 — Harper hit .094/.310/.188, with a home run representing one of his three hits, and Trout hit .229/.317/.229 without a homer. For eight of the 10 stretches, it’s Harper dragging the pair down, with a wRC+ below 70; that conforms to the general impression that he’s the more slump-prone player of the two.

One could certainly look at the matter in other ways, using larger sample sizes — going by 15-game stretches with the same methodology, for example, or simply by our monthly splits, or even full seasons. On that last front, 2015 gets the nod on the basis of combined wRC+ (184) or WAR (18.6) if we’re bringing defense into this. By the monthly splits, the pair’s combined wRC+ of 243 for March and April (which we customarily lump together, as we do for September and October) would rank first, but with an asterisk, as it’s the only month besides April 2012 for which the pair has combined for fewer than 100 PA. Discarding what would be the second-ranked month (June 2014) on the grounds that Harper had just four PA, the best combined month for the pair is July 2015, when Trout (260) and Harper (172) combined for a 214 wRC+ in 193 PA. Incidentally, by this method the pair has combined for a 120 wRC+ or better in every month for which we have a meaningful sample from both save for July 2016, when Trout (144) and Harper (65) combined for a 104 mark.

Still, I do like the immediacy of the 10-game sample and the fact that it places what we’ve witnessed so far this season near the top of the heap. If Trout doesn’t miss too much time, there’s a chance we can see that number climb. All of which serves to remind us that while major league baseball has problems on and off the field that shouldn’t be ignored, the level of talent today is astounding, and anytime Trout and Harper are both firing on all cylinders is a great time to be watching.


Ozzie Albies Just Signed a Stinker

The Atlanta Braves locked up another one of their key foundational pieces on Thursday, signing Ozzie Albies to a seven-year contract extension worth $35 million. Also included, since the Atlanta Braves felt like they didn’t get quite enough value in this deal somehow, are two team options at $7 million a year with a $4 million buyout, taking the total possible contract term up to nine years and $45 million.

The Evan Longoria long-term contract was probably the gold standard in team value when it came to these sorts of deals, but this one eclipses it. For those who don’t remember, Longoria signed an extension early in his rookie season for six years and $17.6 million, with three team option years. While the guaranteed dollars are a little lower, the team options were more generous at $7.5 million, $11 million, and $11.5 million. Here, the Braves buy out as many as four of Albies’ free agent years for less money than he’d likely be paid in a single year of free agency. In addition, Longoria had yet to succeed in the majors while Albies already had a full star-level season under his belt.

Quite frankly, this is a bit shocking. There’s risk aversion for a player, and then there’s risk aversion. Obviously, Albies wouldn’t get a contract equivalent to what he would get in free agency under any circumstances with a year of service time, but when I think of a risk-benefit tradeoff that isn’t horrific for a player, I think Blake Snell’s contract is a better representation of a team-friendly deal that doesn’t cross the line into, let’s be honest, exploitation. For those who didn’t read my piece on the Snell signing because you wanted to make me sad, ZiPS estimated that year-to-year, Snell was giving up $23 million on average to have a guaranteed $50 million in his pocket.

ZiPS Projections – Ozzie Albies
Year BA OBP SLG AB R H 2B 3B HR RBI SB OPS+ WAR Expected ($M)
2019 .271 .319 .454 634 101 172 36 7 22 78 17 104 4.3 0.6
2020 .280 .329 .481 611 102 171 38 8 23 81 17 114 4.9 0.6
2021 .280 .331 .496 615 105 172 39 8 26 85 17 118 5.3 6.5
2022 .279 .332 .504 613 106 171 39 9 27 86 16 120 5.5 11.9
2023 .280 .334 .510 608 107 170 38 9 28 88 14 122 5.6 20.5
2024 .277 .333 .502 603 106 167 37 9 27 86 14 120 5.4 52.0
2025 .274 .331 .495 584 102 160 35 8 26 82 13 118 5.0 50.4
2026 .272 .330 .488 566 97 154 34 8 24 77 12 116 4.6 48.9
2027 .271 .327 .485 546 92 148 32 8 23 74 11 114 4.3 47.6
2028 .268 .324 .470 523 86 140 29 7 21 68 10 110 3.7 43.5

So, umm…yeah.

ZiPS is a fan of Ozzie Albies’ future, a weird quirk of the system in that it finds young, phenomenally talented infielders with a star season in the books to be totally awesome. All told, among the game’s hitters, ZiPS projects Albies with the fourth-most WAR remaining in his career, behind only Mike Trout, Juan Soto, and Francisco Lindor. If you’re wondering where Ronald Acuña is, he’s all the way down at…fifth.

ZiPS expects that, going year-by-year, Albies could be expected to make $282 million through the theoretical ninth and final season of his contract extension. In other words, ZiPS is estimating that Albies, in return for this contract, is giving up more than $200 million on average. But let’s say that ZiPS is being way too kind on Albies and is overrating him by two WAR a year. That knocks a shocking 18 WAR off his projections for the next nine years, in which case, ZiPS projects him to make a mere $153 million going year-to-year. So even in the case that ZiPS is horribly overrating Albies, he’s still likely to be underpaid by at least $100 million for his contributions to the Braves. And remember, this is relative to what he would expect to get under the current collective bargaining agreement, not some fanciful world in which he could otherwise just become a free agent right now.

(One side note since somebody will notice, reducing his projected WAR by 18 doesn’t have the exact same linear value as WAR in his real projection does because the better a player is, the lower a percentage of their expected free agent value they get in arbitration).

If I made a deal like this when I was a kid, and had offered my friend Alan a candy bar for his Super Nintendo (he had one a few months before I did, the jerk), you can bet my mom would have marched right down to Alan’s house and made me undo that particular transaction.

Ozzie Albies is, of course, an adult and I highly value the right of two consenting adults entering into freely negotiated contracts with each other. But I can sure as sugar express that I think he got an absolutely rotten deal here!

For the Atlanta Braves, the value of this trade is obvious. They get a star player for the entire length of his twenties for next to nothing, at least in baseball terms. Already having signed Ronald Acuña to a team-friendly deal — but at least, not as team-friendly a deal — the team has no excuse now to not open their pocketbooks for big free agents in coming seasons, something they really should have done beyond Josh Donaldson this winter.

This is not a contract that players should forget at the bargaining table. With higher minimum salaries for young players and earlier arbitration, players would have more leverage in negotiations and we’d likely see fairer terms for players in their prime as a result. If nothing else, it’s a sign that to keep salaries growing in baseball, players will need to fight for the Ozzie Albieses of the league, and advocate for a system that doesn’t require salary growth to be tied to teams signing 34-year-olds to crazy contracts like it’s 1986.


Vladimir Guerrero’s Other Heir

Javier Baez is not Vladimir Guerrero. Baez struggled before his breakout last season at 25; by that age, Guerrero had already established himself as one of the game’s great players. Even including Baez’s leap forward last year, Guerrero struck out about a third as often as Baez has and walked nearly twice as much. He had double the WAR though his age-25 season and 55 more homers. This isn’t meant to denigrate Baez. Vladimir Guerrero was a young star on the way to the Hall of Fame while Baez is an exciting young player with one really good season and some unique, dazzling skills. What brings the two players together is a swing Baez made on Monday against Jameson Taillon and the Pirates.

Javier Baez swung at a bad pitch, a pitch so bad the ball bounced in front of the plate, but he made contact, and the ball made its way to the outfield. Baez reached base with a single. Here’s another view a little bit closer:

Read the rest of this entry »


Just What the Hell Was Marcell Ozuna Doing?

Look, we all make mistakes. After all, we’re human. Sometimes our judgment of a situation is flawed from the outset, prone to fallacious reasoning. Often we overestimate the probabilities of events, or the limits of our capabilities. Occasionally, we look foolish doing so, but rarely in so grand a fashion as Marcell Ozuna did on Tuesday night.

With the Cardinals hosting the Dodger in St. Louis, Kiké Hernandez launched a fly ball to left field off pitcher Mike Mayers. It left the bat with an exit velocity of 99.3 mph and had a good arc to it. Ozuna … well, he tried to be a hero:

You can’t hear Ozuna’s voice, but if you could, it would probably be some variant of the classic, “I got it! I got it! I got it! I … ain’t got it.” Ozuna scaled the wall, only to realize that the ball would fall about 10 feet short, and his effort to correct course was ungraceful, to say the least. Between his cleats digging into the padded fence, his bellyflop, and the near-miss of a flying projectile in the general vicinity of his noggin, he’s damn lucky he didn’t get injured.

Statcast guru Daren Willman harnessed all of MLB Advanced Media’s computing power to determine Ozuna’s route efficiency…

…wait, no, that’s not it…

…before memorializing the play in an easy-to-find location.

This isn’t even the first time Ozuna has screwed up in such grand fashion. He did something similar last June 21 on a drive by the Brewers’ Jesus Aguilar.

Like Hernandez’s fly ball, that one turned into a double as well. The real issue is that Ozuna has actually scaled the wall to rob a home run before — from Hernandez no less. From July 16, 2017, when Ozuna was still a Marlin:

Given that, it’s easier to understand what happened on Tuesday night, and to be fair, the defensive metrics don’t suggest Ozuna is particularly incompetent afield, at least since leaving center field after the 2016 season, when he was 5.6 runs below average according to UZR, and 12 below according to DRS. For 2017-18, he was 7.1 runs above average in left field per UZR, and 19 above average via DRS. He even brought home a Gold Glove in 2017!

Yet time and entropy remain undefeated, which is why very few of us — besides Mike Trout, at least — are capable of the same feats we made look effortless just a couple of years ago. It’s good to laugh gracefully at such mistakes:

Some of us can’t resist laughing at, instead of with:

Really, though, we’re all just Kenley Jansen for this one:

We can’t help laughing, but we don’t want to make too big a show of it. After all, there’s a chance that we might be next.


Mariners’ Hot-Hitting Start Defies Rebuild

While the Dodgers’ bolt from the gate isn’t too surprising given their back-to-back NL pennants and preseason playoff odds around 90% (though yes, I reaaaally nailed the timing of my investigation into their hitting), the Mariners’ hot start is the kind of early-season anomaly that reminds us how reality often fails to conform to our preconceptions. Expected to be a bystander during a rebuilding year, Seattle opened the season by sweeping a two-game series in Japan against last year’s upstarts, the A’s, and has continued to roll. They own the majors’ best record (11-2) and run differential (+40) so far.

The Mariners did spend most of last year in contention, ultimately notching 89 wins — their highest total since 2003 — but finishing eight games behind the A’s for the second AL Wild Card spot. In missing out on the October festivities, they ran their postseason drought to 17 years, the longest in North American professional sports. Given a club record payroll ($157.9 million as of Opening Day 2018) and the game’s worst farm system, general manager Jerry Dipoto opted to plunge the team into rebuilding mode, bidding adieu to free agent Nelson Cruz and trading away Robinson Cano, Alex Colome, Edwin Diaz, James Paxton, Jean Segura, and Mike Zunino, among others — nearly all of the popular kids, basically. With Kyle Seager suffering a torn tendon in his left hand, the only players common to Seattle’s 2018 and ’19 Opening Day lineups were Dee Gordon, Mitch Haniger, and Ichiro Suzuki, the last of whom used the Japan series as a farewell tour. Read the rest of this entry »


Daily Prospect Notes: 4/8/2019

These are notes on prospects from lead prospect analyst Eric Longenhagen. Read previous installments here.

Luis Robert, CF, Chicago White Sox
Level: Hi-A   Age: 21   Org Rank: 4   FV: 55
Line: 2-for-4, HR, 2 HBP

Notes
Off to hot start, Robert has multi-hit efforts in each of his first four games and has already stolen three bases and homered three times. After watching LouBob a lot last year (first while he rehabbed multiple injuries, then in the Fall League), I grew concerned about how his bat path might limit the quality of his contact (he sometimes struggled to pull pitches he should have) or his rate of contact, which we don’t have a large-enough sample to properly assess because of his injuries. So far, the pull-side stuff hasn’t been founded, as all but two of Robert’s balls in play so far this year have been to the right side of the field, and those were both pop-ups to the second baseman. He’s one of the more physically-gifted players in pro baseball.

Darwinzon Hernandez, LHP, Boston Red Sox
Level: Double-A   Age: 22   Org Rank: 2   FV: 45
Line: 5 IP, 2 H, 4 BB, 0 R, 10 K

Notes
We do not think Hernandez is a long-term starter and instead think he’ll be an elite bullpen arm. His fastball often sits in the upper-90s when he’s starting so it should at least stay there if he’s moved to relief and, though his feel for it comes and goes, his curveball can be untouchable at times. Maybe the strong early-season performances of Matt Barnes, Brandon Workman, and Ryan Brasier has stifled some of the disquiet about the Red Sox bullpen, but in the event that they need an impact arm, I think it’s more likely to be Hernandez than a piece outside the org. Some of this is due to the quality of the farm system, but Hernandez might also just be better than a lot of the options that will eventually be on the trade market. Read the rest of this entry »


Jacob deGrom is Picking Up Where He Left Off

Jacob deGrom’s 2018 will go down in history as one of the best pitching seasons of all time. There’s almost no way it couldn’t — pitchers don’t put up sub-two ERAs very often, and they record sub-2 FIPs even less frequently. By those stats alone, deGrom had the seventh-best ERA and eighth-best FIP since integration. Adjust for the run-scoring environment, and he falls all the way to ninth. Simply put, deGrom was sublime in 2018.

After a season of such historic magnitude, we’d be crazy to not expect regression. Everything broke so well for deGrom in 2018 that he could pitch every bit as well in 2019 and end up with meaningfully worse results. Indeed, ZiPS and Steamer both projected deGrom’s ERA to increase by essentially a run this season. Despite that, both projected him to put up the second-best ERA and FIP among starters, behind only Chris Sale. When you’re as far ahead of the pack as deGrom, you can significantly regress and still be one of the best.

It isn’t just projection systems that peg deGrom to come back to earth — the broad sweep of history suggests it as well. No matter how you slice it, pitchers who record a season like deGrom’s decline the next year. Want to focus on ERA? There have been 26 times since 1947 when a pitcher qualified for the ERA title and had an ERA below two. Excluding 2018 deGrom and 1966 Sandy Koufax (he retired after 1966 and so didn’t have a next season), these pitchers averaged a 1.77 ERA. The next year, they recorded a 2.78 ERA. Read the rest of this entry »


Corbin Burnes Spins to Win

The first week of baseball is a wondrous time to be a baseball fan. It’s also a weird time to be a baseball writer. On one hand, baseball is happening, and that’s a relief after the long dark night of the offseason. On the other hand, not that much baseball has happened, and most of the seemingly noteworthy stories are small-sample noise. Give me an early-season take (Tim Beckham is great! Sandy Alcantara is a top-10 pitcher!), and I’ll likely dismiss it as a fluke. One performance this week, however, made me sit up and take notice. Corbin Burnes struck out 12 batters on Sunday, and the way he did it should have Brewers fans, and baseball fans in general, salivating.

At first glance, Burnes’ start against the Cardinals is a textbook case of not reading too much into a single start. He struck out 12 batters and walked only one, which is obviously incredible. On the other hand, he gave up three home runs and only lasted five innings, producing a what’s-going-on split of a 6.53 FIP and 0.00 xFIP. If I were a betting man, though, I’d wager that the strikeouts are more predictive than the home runs. Why? Corbin Burnes’ fastball was absolutely ludicrous, and in a way that you can’t fake.

Most of the things that happen in a baseball game are contextual. Did a pitcher strike a lot of hitters out? Well, consider who was batting. If it’s a bunch of high schoolers or the 2019 Giants outfield, that’s an extenuating circumstance. Did he give up a lot of home runs? A ton of factors go into that. One thing that isn’t contextual is a pitch’s spin rate. The batter doesn’t influence it. Pitch selection doesn’t influence it. It doesn’t take long to stabilize. It’s basically as clean as it gets in baseball statistics — you throw the ball, and you get your results.

When Burnes threw the ball on Sunday, the results were off the charts. Burnes fired 61 four-seam fastballs on Sunday. His velocity was down a tick or so from last year, when he worked out of the bullpen — nothing unusual about that. His spin, on the other hand, was wholly new. Burnes averaged 2912 rpm, and it’s hard to explain how crazy that is. It was nearly 150 rpm higher than last year’s league leader in average spin rate, Luke Bard. The fastball that Burnes spun most slowly, at 2660 rpm, would have been good for the second-highest fastball spin rate in baseball last year.

Burnes has always been a high-spin pitcher (11th in baseball among pitchers who threw at least 100 fastballs in 2018), but this is an entirely different level. Spin rates vary from start to start, but not like this. In fact, Burnes made thirty appearances last year, and the gap between the highest spin rate he recorded and the lowest was 270 rpm. Sunday’s start was 200 rpm faster than last year’s highest rate. Graphically, that looks pretty absurd, like so:

Read the rest of this entry »


Major League Payrolls Set to Drop Again in 2019

Earlier this offseason, I wrote that even if everything broke right for the free agents who remained on the market, we’d see a roughly one percent increase in Opening Day payrolls compared to last year. At the time, I cautioned that things were not likely to break right for the remaining free agents, and that a similar exercise the year prior ended with a one percent drop on Opening Day. Even worse for the players, that one percent drop last season turned into a 2.5% drop by season’s end. Opening Day payrolls are down again in 2019 by roughly the same amount as last year. If last season’s scenario were to repeat itself, the players will be looking at a half-billion dollar swing in revenues to owners in 2019 alone even if we assume that the split between players and owners was 50/50 two seasons ago.

As we begin the 2019 season, here’s a look at every team’s Opening Day payroll, per Cot’s Contracts, which includes a team’s 25-man roster plus whatever other obligations they’ve accrued to players who are on the injured list or no longer with the club.

The Red Sox, coming off their World Series win and the highest major league payroll in 2018, look poised to repeat at least one of those designations this season with a decent shot at both. The Yankees appear just above $200 million this season after a major decline last season, though the team first crossed the $200 million barrier back in 2005, so it is hardly heady territory for them. The Cubs have seen their payroll rise as they try to augment their World Series-winning core with free agents, though they sat this winter out. The Nationals kept up spending after Bryce Harper’s departure, and Los Angeles looks to be trying to stay under the competitive balance tax for the second straight season after averaging a figure more than $50 million higher the previous three seasons. At the lower end of the spectrum, we see the usual suspects of smaller-market teams and traditionally weak-spenders. Read the rest of this entry »