Archive for Featured

Philadelphia Phillies Top 34 Prospects

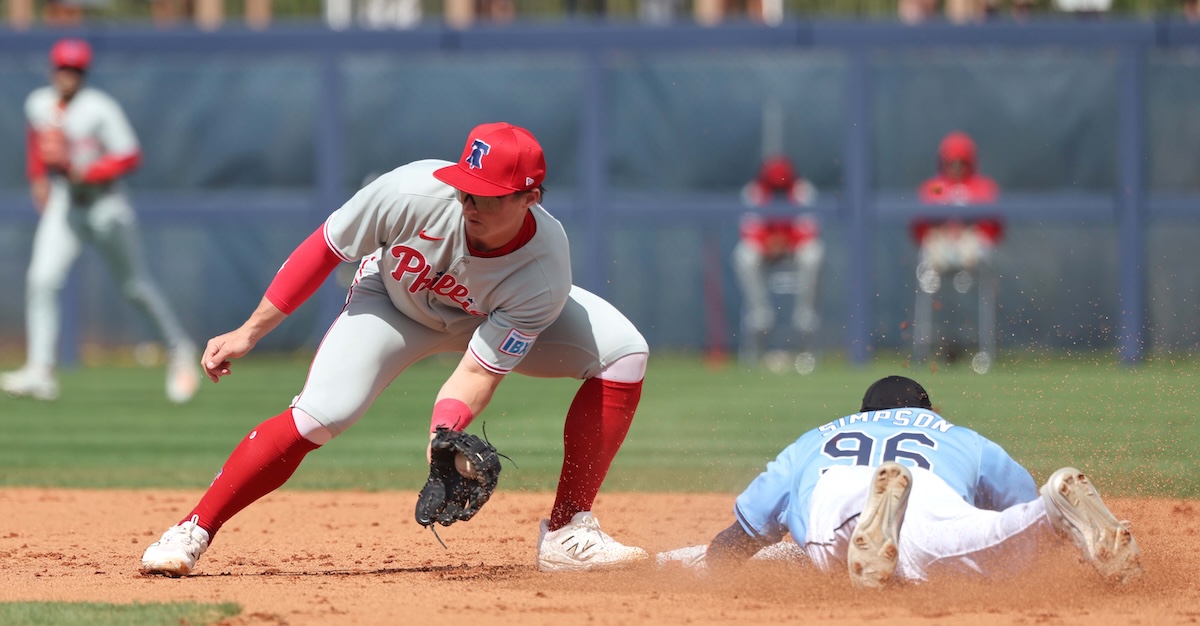
Aidan Miller Photo: Kim Klement Neitzel-Imagn Images

Below is an analysis of the prospects in the farm system of the Philadelphia Phillies. Scouting reports were compiled with information provided by industry sources as well as my own observations. This is the sixth year we’re delineating between two anticipated relief roles, the abbreviations for which you’ll see in the “position” column below: MIRP for multi-inning relief pitchers, and SIRP for single-inning relief pitchers. The ETAs listed generally correspond to the year a player has to be added to the 40-man roster to avoid being made eligible for the Rule 5 draft. Manual adjustments are made where they seem appropriate, but we use that as a rule of thumb.

A quick overview of what FV (Future Value) means can be found here. A much deeper overview can be found here.

All of the ranked prospects below also appear on The Board, a resource the site offers featuring sortable scouting information for every organization. It has more details (and updated TrackMan data from various sources) than this article and integrates every team’s list so readers can compare prospects across farm systems. It can be found here. Read the rest of this entry »


The Mets Are Having a Swell Offseason

John E. Sokolowski, Nick Turchiaro, Wendell Cruz-Imagn Images

You already know how it works: January is for signings, trades, and articles that grade those signings and trades. Everything gets a letter, every transaction has a winner and loser, and positive thinkers like me hand out thumbs up left and right. I’ve rarely seen a signing I didn’t like. I think that most trades help out both sides. What about the aggregate effect of all the signings and trades, though? Which teams play the offseason game the best or the worst? Looking at the Mets this winter got me thinking.

How should we evaluate a front office, particularly in the offseason when we don’t have games to look at? I’ve never been able to arrive at a single framework. That’s only logical. If there were one simple tool we could use to evaluate the sport, baseball wouldn’t be as interesting to us as it is. The metrics we use to evaluate teams, and even players, are mere abstractions. The goal of baseball – winning games, or winning the World Series in a broad sense – can be achieved in a ton of different ways. We measure a select few of those in most of our attempts at estimating value, or at figuring out who “won” or “lost” a given transaction. So today, I thought I’d try something a little bit different.

Instead of a single number, I’m going to evaluate the decisions that David Stearns and the Mets made this winter on three axes. The first is what I’m calling Coherence of Strategy. If you make a win-now trade but then head into the season with a gaping hole in your roster, that’s not coherent. If you trade a star for teenage prospects and then extend a 33-year-old, that’s not coherent. Real-world examples are never that simple, but you get the idea. Some spread in decisions is inevitable, but good teams don’t work against themselves more than they have to.

Next, Liquidity and Optionality. One thing we know for sure about baseball is that the future rarely looks the way we expect it to in the present. Preserving an ability to change directions based on new information is important. Why do teams treat players with no options remaining so callously? It’s because that lack of optionality really stings. Why do teams prefer high-dollar, short-term contracts over lengthy pacts in general? It’s because you don’t know how good that guy is going to be in year six, and you certainly don’t know how good your team will be or whether you’ll have another player for the same position. All else equal, decisions that reduce future optionality are bad because they limit a team’s ability to make the right move in the future.

Finally, maximizing the Championship Probability Distribution. We like to talk about teams as chasing wins, but that’s not exactly what’s going on. Teams are chasing the likelihood of winning a World Series, or some close proxy of that. That’s often correlated to wins, but it’s not exactly the same. Building a team that outperforms opponents on the strength of its 15th-26th best players being far superior to their counterparts might help in the dog days of August, when everyone’s playing their depth pieces and cobbling together a rotation, but that won’t fly in October. Likewise, high-variance players with decent backup options don’t show up as overly valuable in a point estimate of WAR, but they absolutely matter. Teams are both trying to get to the playoffs as often as possible and perform as well as they can after arriving there. That’s not an easy thing to quantify, but we can at least give it a shot.

Let’s begin with a look at the transactions that reshaped the lineup. The biggest of these has to be the infield turnover, with Pete Alonso out and Bo Bichette, Jorge Polanco, and Marcus Semien in. Since we’re including Semien, we’ll have to include the departure of outfielder Brandon Nimmo as well. These decisions are clearly coherent; Alonso’s leaving meant space in the infield and an offensive deficit, and the Mets signed multiple free agents to account for that. I’ll analyze the Coherence of Strategy axis at the end of this write-up, but for each individual deal, I’ll focus on the other two axes of analysis.
Read the rest of this entry »


Peering Into the Crystal Ball: The Next Five Years of BBWAA Hall of Fame Elections

Jeff Curry and Mark J. Rebilas-Imagn Images

The following article is part of Jay Jaffe’s ongoing look at the candidates on the BBWAA 2026 Hall of Fame ballot. For a detailed introduction to this year’s ballot, and other candidates in the series, use the tool above; an introduction to JAWS can be found here. For a tentative schedule, see here. All WAR figures refer to the Baseball Reference version unless otherwise indicated.

Last week, BBWAA voters elected Carlos Beltrán and Andruw Jones to the Hall of Fame — and in doing so, they once again foiled my chances at a perfect five-year projection of upcoming elections. Not that I had any real expectation of running the table given my spotty track record regarding this endeavor, but while a year ago I correctly projected that Beltrán, who received 70.3% on the 2025 ballot, would make it this year, I was somewhat surprised that Jones, who received 66.2% last time — leaving him with what has typically been roughly coin-toss odds of reaching 75% the next year — made it as well.

If I’ve learned anything from 14 years of doing these five-year outlooks, dating back to the wrap-up of my 2014 election coverage at SI.com, it’s humility, because there are far more ways to be wrong in this endeavor than to be right; when a candidate gets elected more quickly than I expect, or lags relative to my expectations, it creates a ripple effect. The presence of a high-share holdover means less space for and less attention paid to the mid-ballot holdovers, so clearing one from the ballot can have ramifications that won’t be felt for a few years; likewise, a more rapid election than predicted can accelerate other candidates’ timelines. What’s more, the Hall can change the rules for election without warning, and candidates can do unforeseen things that compromise their chances.

The first time I tried this was so long ago that candidates still had 15 years of eligibility instead of 10, so I could afford to project Tim Raines for election in 2018, his 11th year of eligibility. The Hall’s unilateral decision to truncate candidacies to 10 years would come just months later, though thankfully voters accelerated their acceptance of Raines, who was elected in 2017. Both the eligibility shortening and Hall vice chairman Joe Morgan’s open letter pleading with voters not to elect candidates linked to performance-enhancing drugs changed the landscape in ways I couldn’t foresee. Meanwhile, Ichiro Suzuki made a two-game comeback that bumped his eligibility back a year, Curt Schilling found increasingly elaborate ways to offend voters, Omar Vizquel became the subject of multiple allegations of domestic violence against his wife and sexual harassment of an autistic batboy, and Beltrán lost a shot at first-year election because of his involvement in the Astros’ illegal sign-stealing scheme. My Magic 8 Ball didn’t see any of that coming. Read the rest of this entry »


The Most Baseball a Baseball Town Can Be

Photo by Amanda Vogt

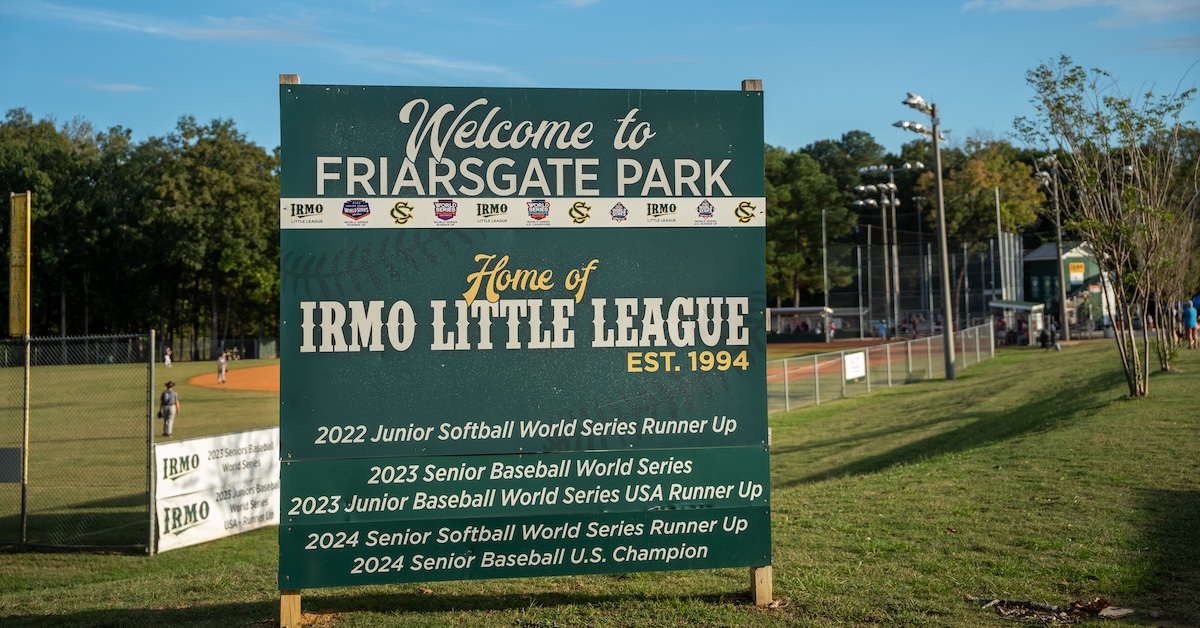
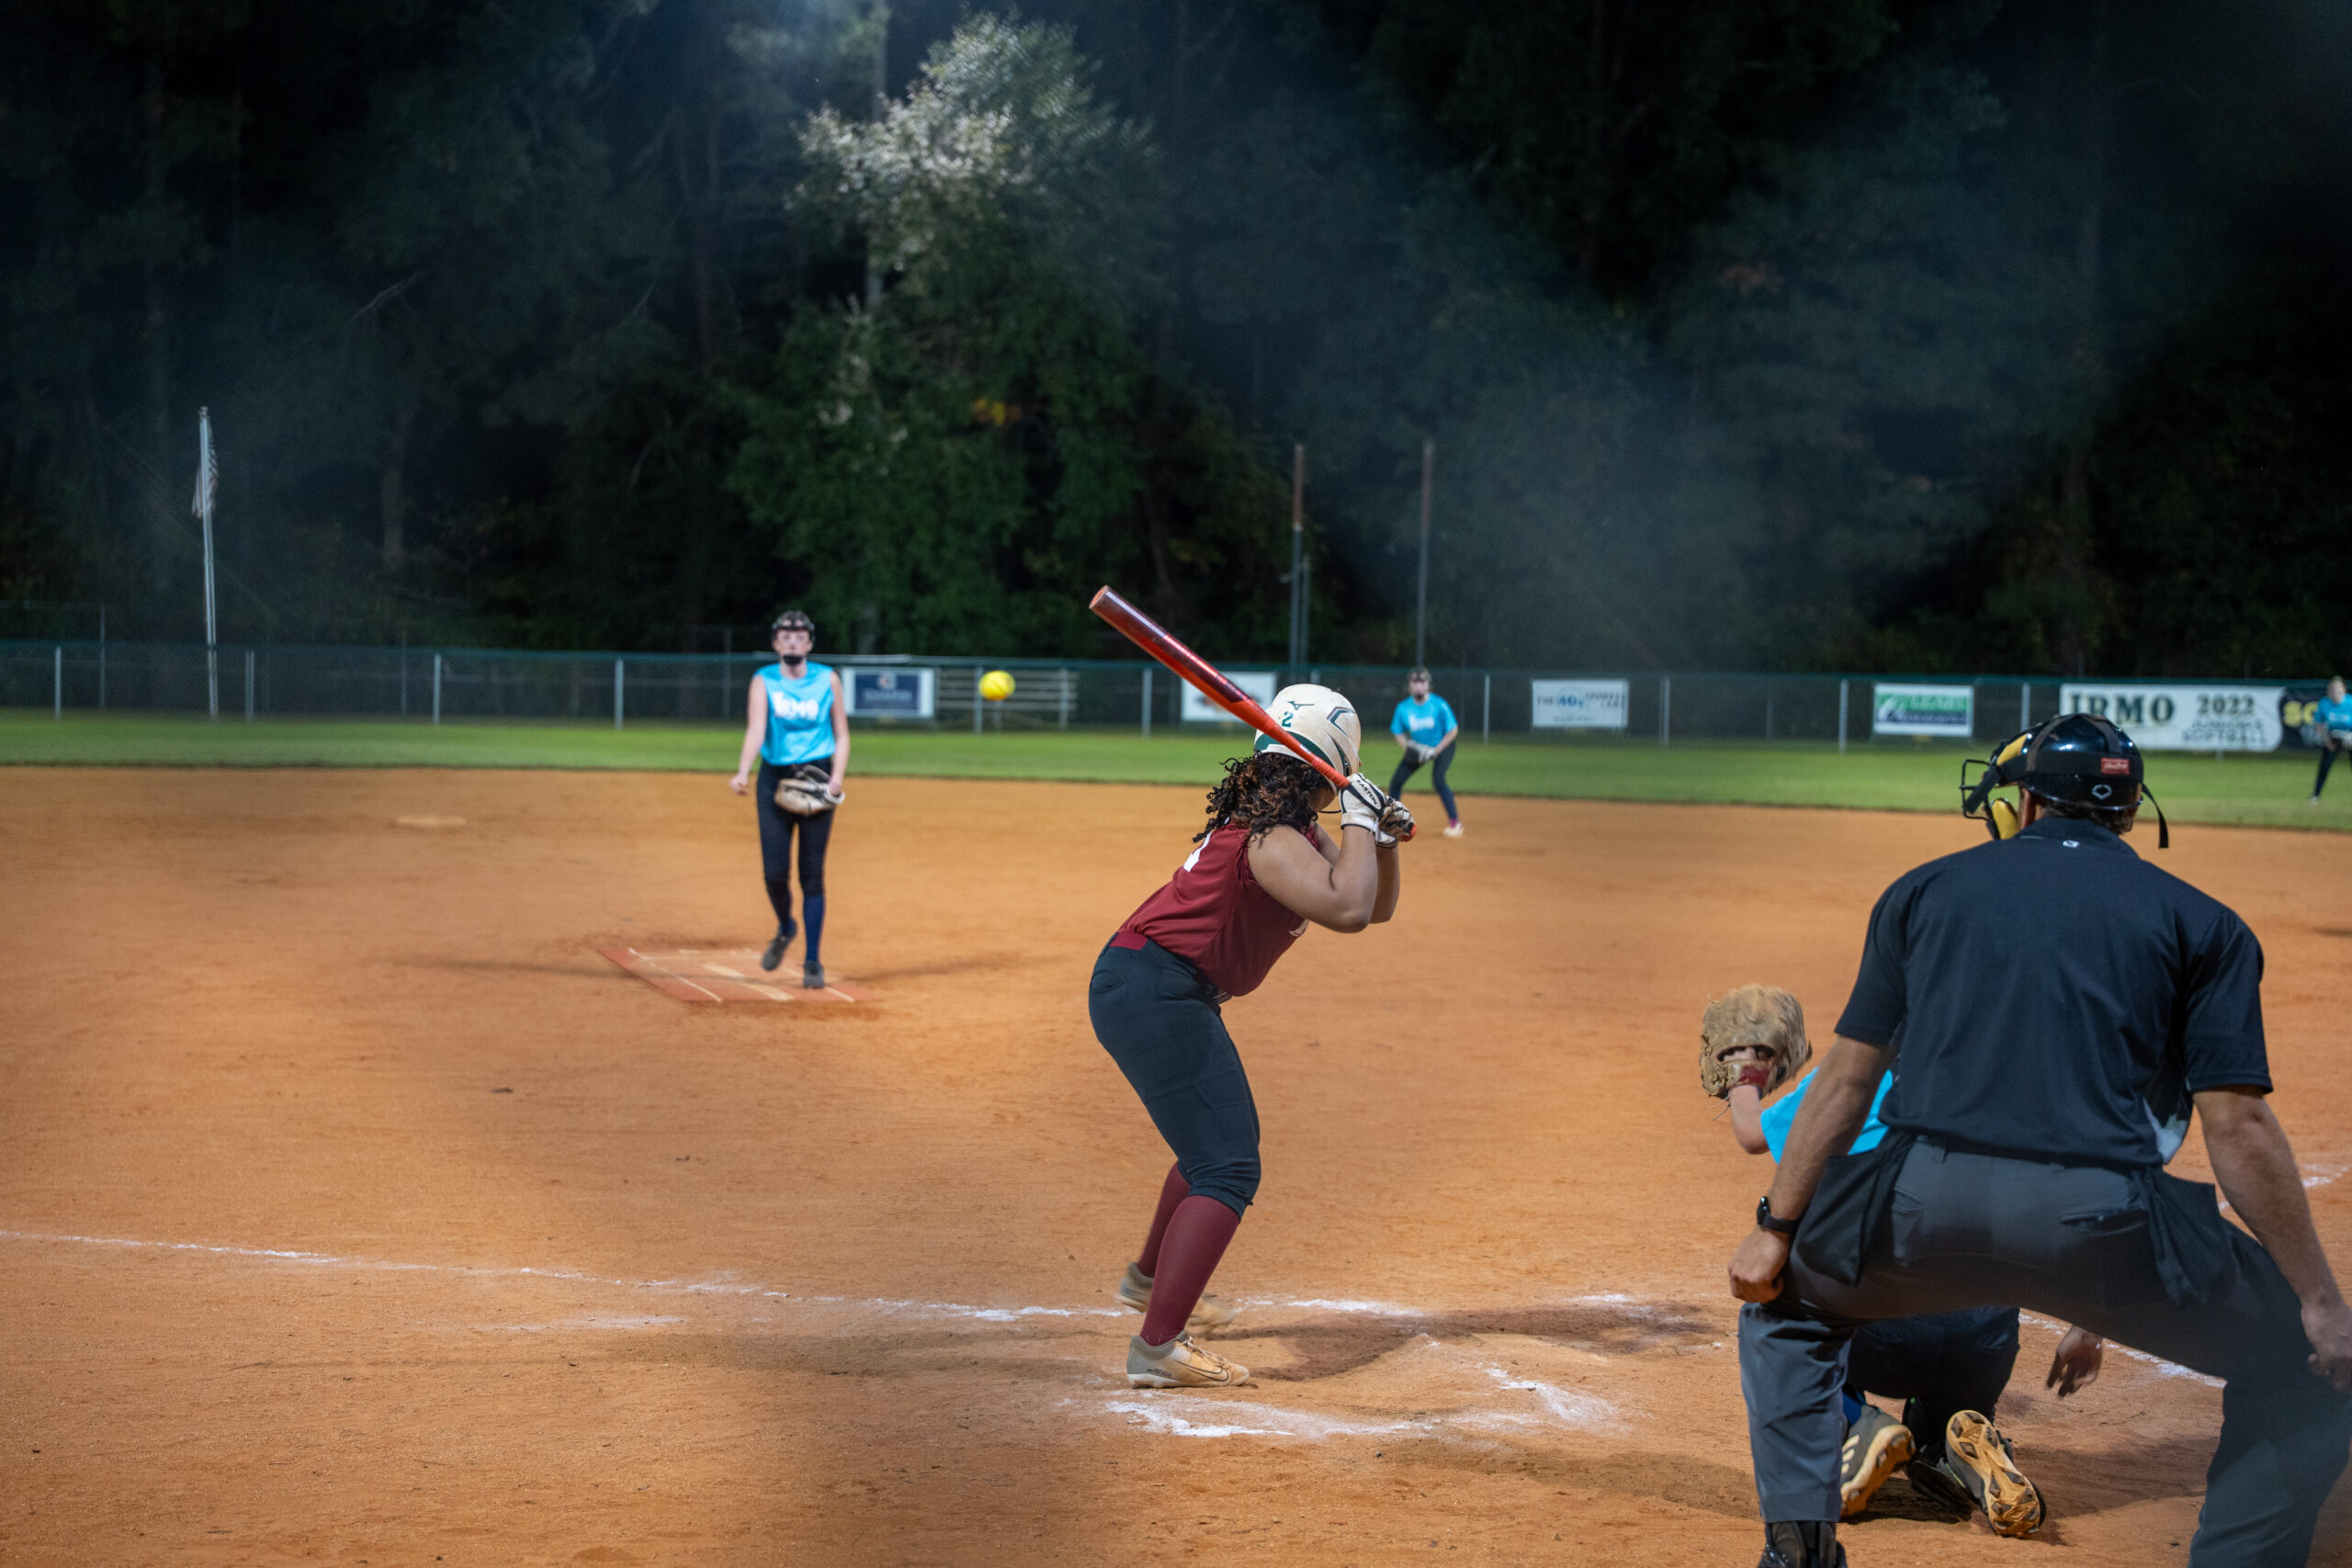
IRMO, S.C. — At Friarsgate Park, there’s never enough parking. Whenever there’s a baseball game, the lot gets full and drivers find spots on the grass next to the sidewalk. Eventually, the parking lot over at the elementary school fills, too.

It’s only a week night, but there’s so much commotion — and this isn’t for a tournament, just fall baseball games.

“It’s the old ‘Field of Dreams,’” said Bobby Jenson, Little League president. “If you build it, they will come. If you build the right atmosphere, people will come because, if it’s 60, 70 degrees and you’re just relaxed and you’re getting peanuts or popcorn or sunflower seeds, and just watching a game of baseball — it’s just no better place I’d rather be.”

This is Irmo, South Carolina, the most baseball a baseball town can be.

Irmo is so baseball that last year it sent not one, not two, not three, but four teams in different divisions to the Little League World Series — baseball teams of up to 12-, 13- and 16-year-old boys, along with a girls softball team. Little League has seven divisions, each of which holds a national tournament of top teams every year, the World Series. Do the math: One community sent clubs to more than half the national competitions.

Irmo is so baseball that championship jerseys hang in local restaurants as relics of pride with signatures of the ball players, who are treated as local celebrities.

Irmo is so baseball that even though the South Carolina Golf Association is just a few miles down the road from the ball fields, there isn’t even a golf course in town. It closed several years ago.

It’s hard to find someone not connected to Irmo Little League.

“I’ve lived in North and South Carolina my whole life and baseball is very important here,” said Matt Westbrooks, a Little League parent. “We’re shocked that we don’t have a major league team yet. And I will tell you, Irmo Little League is doing it right. If you’re not involved, you need to be involved. It’s a great place to have your kids. It’s a great place to learn about baseball.”

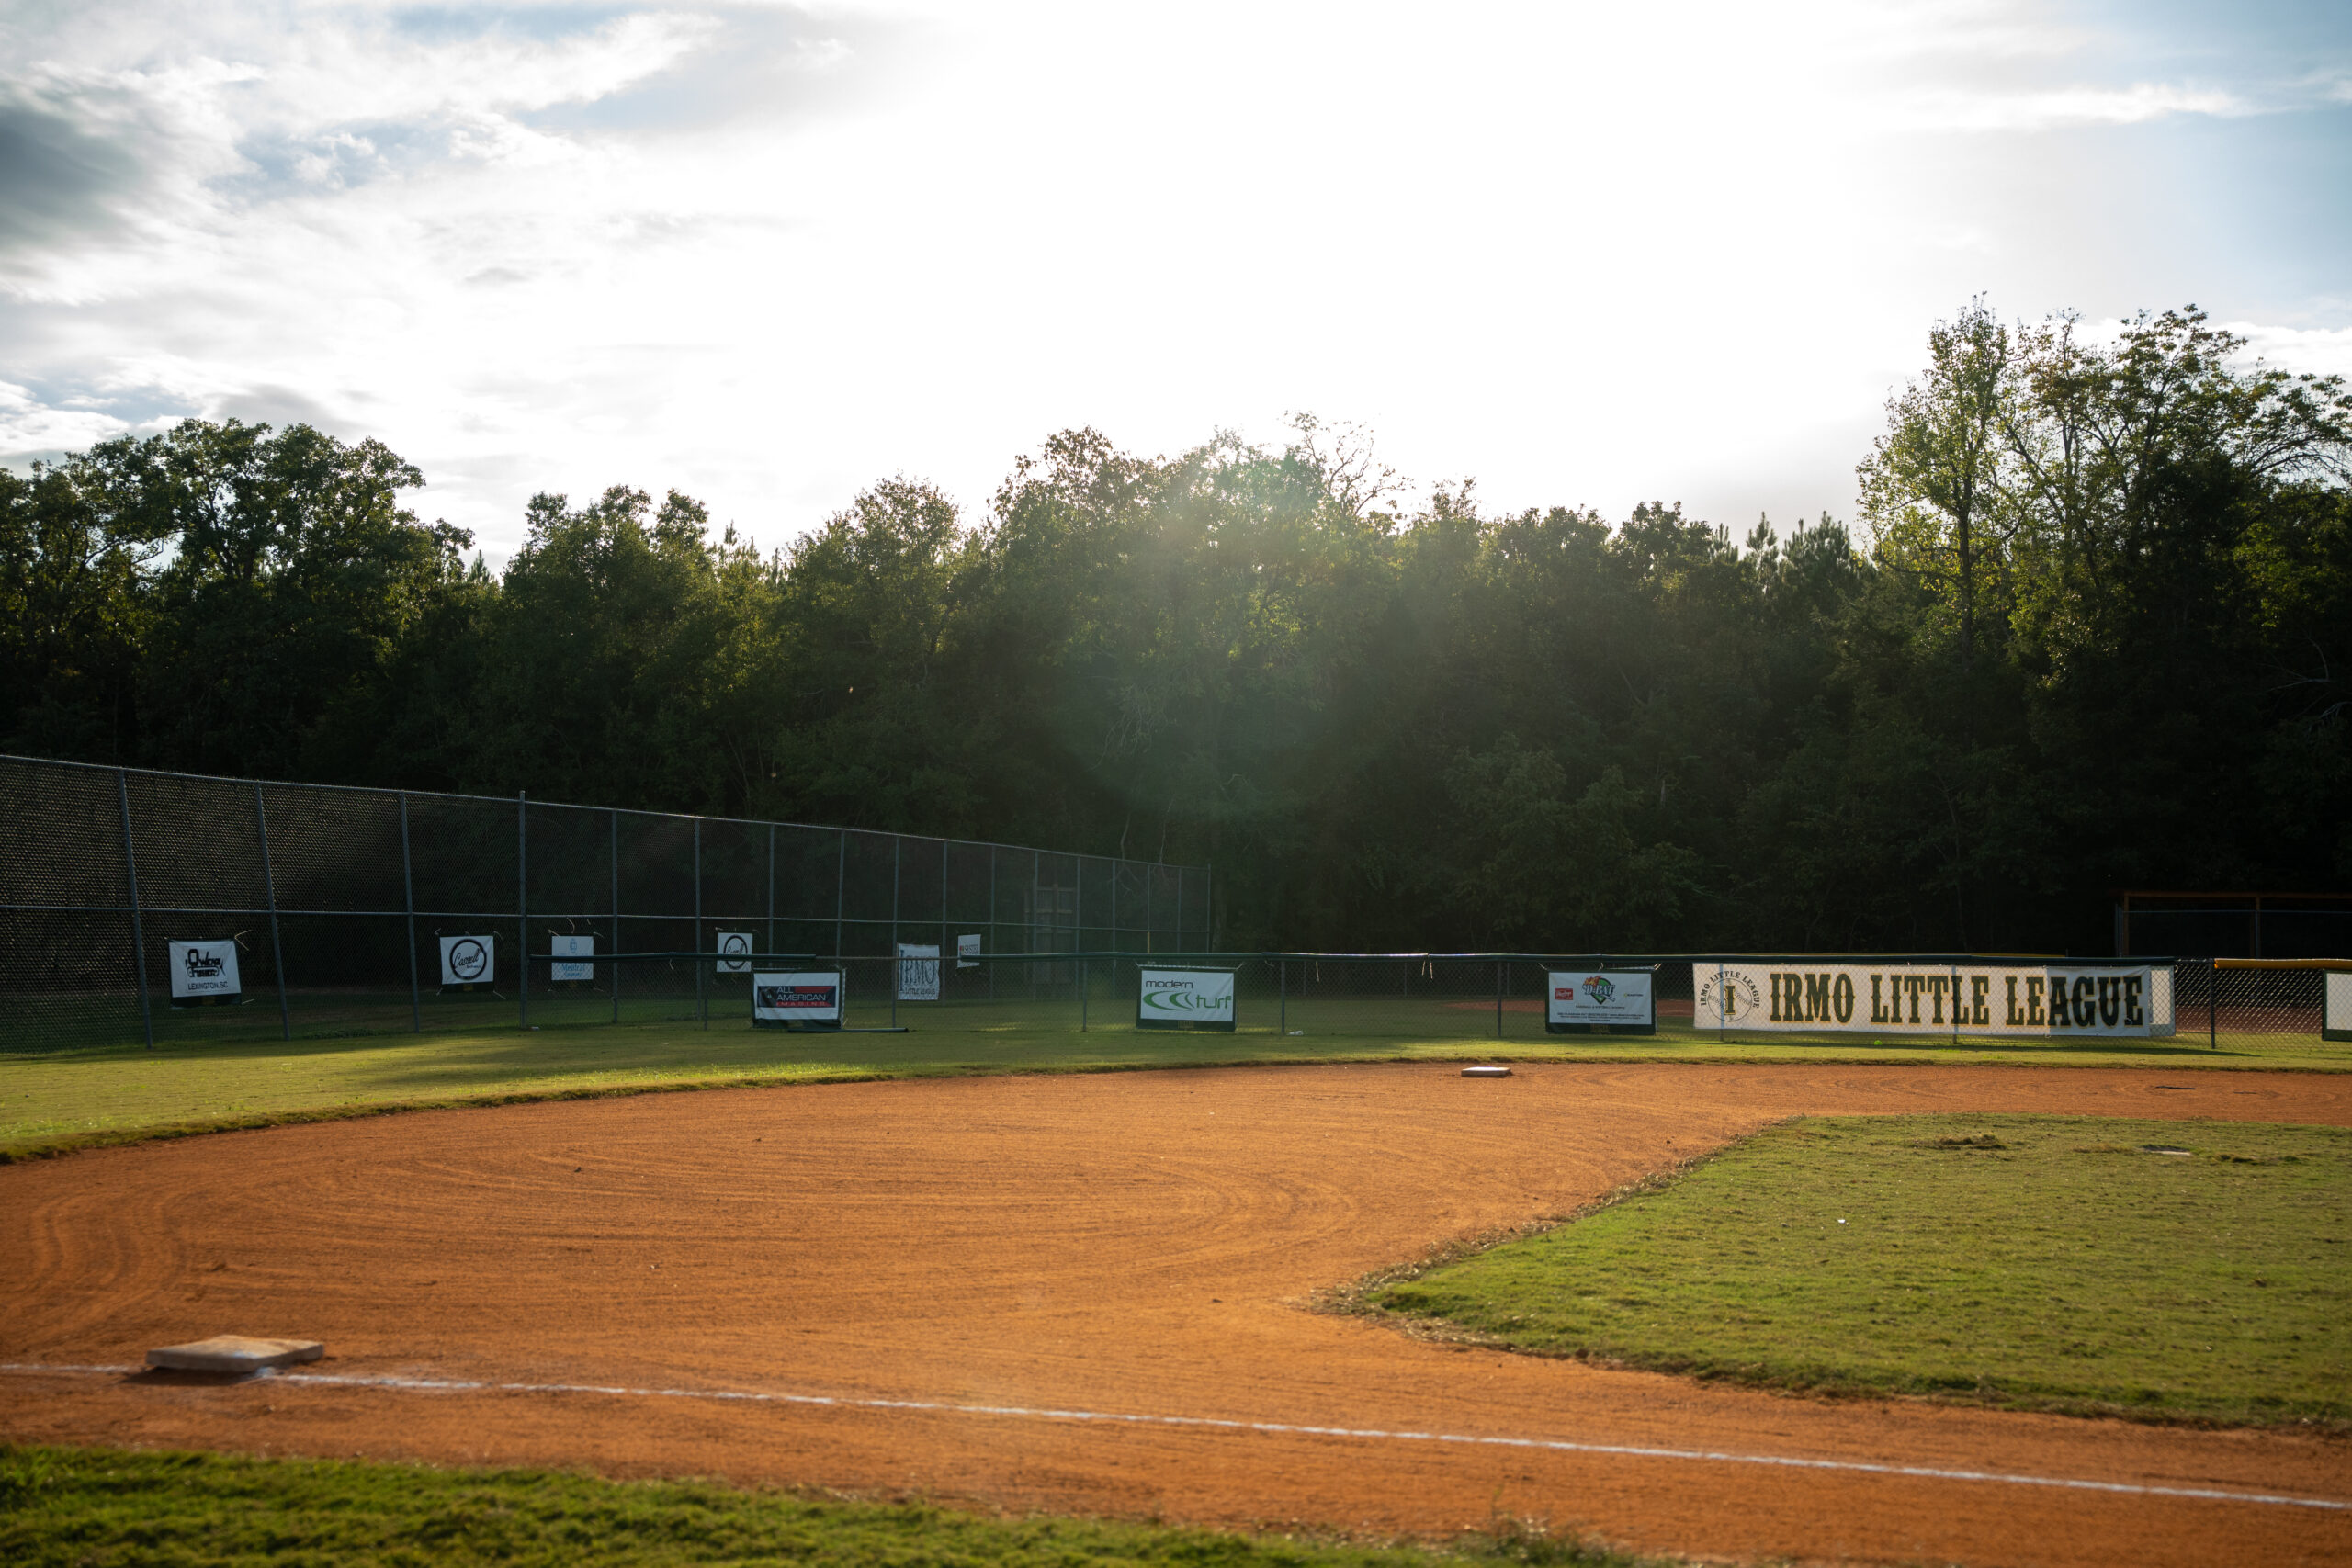
One of the six fields at Friarsgate Park, home of Irmo Little League (Photo by Amanda Vogt)

Classic Southern

Irmo is 20 minutes away from Columbia and is full of Southern charm. Local businesses coexist with typical chain restaurants and retail stores, and with the South Carolina Gamecocks competing close by, there’s an SEC rooting interest.

Lake Murray is just to the west of town and has 650 miles of shoreline. The Big Bass Tour hosts tournaments on the lake each fall and spring that draw people to Irmo. But there’s always plenty of folks fishing. Some of the players often trade in bats for fishing rods.

Irmo is home to the annual Okra Strut, a two-day festival with a parade that was started by the Lake Murray-Irmo women’s club 50 years ago. Initially, the goal was to fundraise money to build a new library, but that only took seven years.

It still remains the town’s most cherished celebration, but the Williamsport team of up to 12-year-olds couldn’t attend the strut this year — the Atlanta Braves were hosting the little leaguers for their game against the Pittsburgh Pirates.

Where The Magic Happens

Irmo Little League has been around for a while, and baseball has been considered America’s favorite pastime for a lot longer, so why is it just now that Irmo is so good?

One reason is facilities. At Friarsgate, there are four large fields, three for baseball and one for softball. Right at the park’s entrance, there are two smaller fields for t-ball.

The fall season for Irmo Little League is dedicated to teaching young players the game and developing skills. Scores aren’t kept, the outfield boards remain off, and coaches interrupt the game action for pivotal teaching moments. But in the spring, kids are playing to make an All-Star team with the chance to make a Little League championship bracket and coaches want the chance to make the trip North, too.

Registration for the spring starts in December and ends in the middle of January. In February, players are evaluated and the regular season teams are formed, practices begin and games run for seven weeks starting in early March.

At 9 a.m. on opening day there’s a parade — it’s a town spectacle. All teams take the field that day and Jensen said 5,000 people normally attend.

“Oh my gosh, it was like if Norman Rockwell was here today, like what he would create for a town celebration,” said Jill Giulietti, mother of one of Irmo’s star sluggers. “It was so charming.”

The fences surrounding each field and the press box structures behind home plate are covered in banners of previous Irmo Little League teams that won state championships or reached a Little League World Series. The sign from 2009 sits next to more recent champions. It might be old, but the cracks in it are an important reminder of how much Irmo Little League has grown.

The fields didn’t always have lights, they didn’t always have scoreboards, there wasn’t always a paved walkway providing better accessibility to the fields. It took commitment from the community and investing to get here.

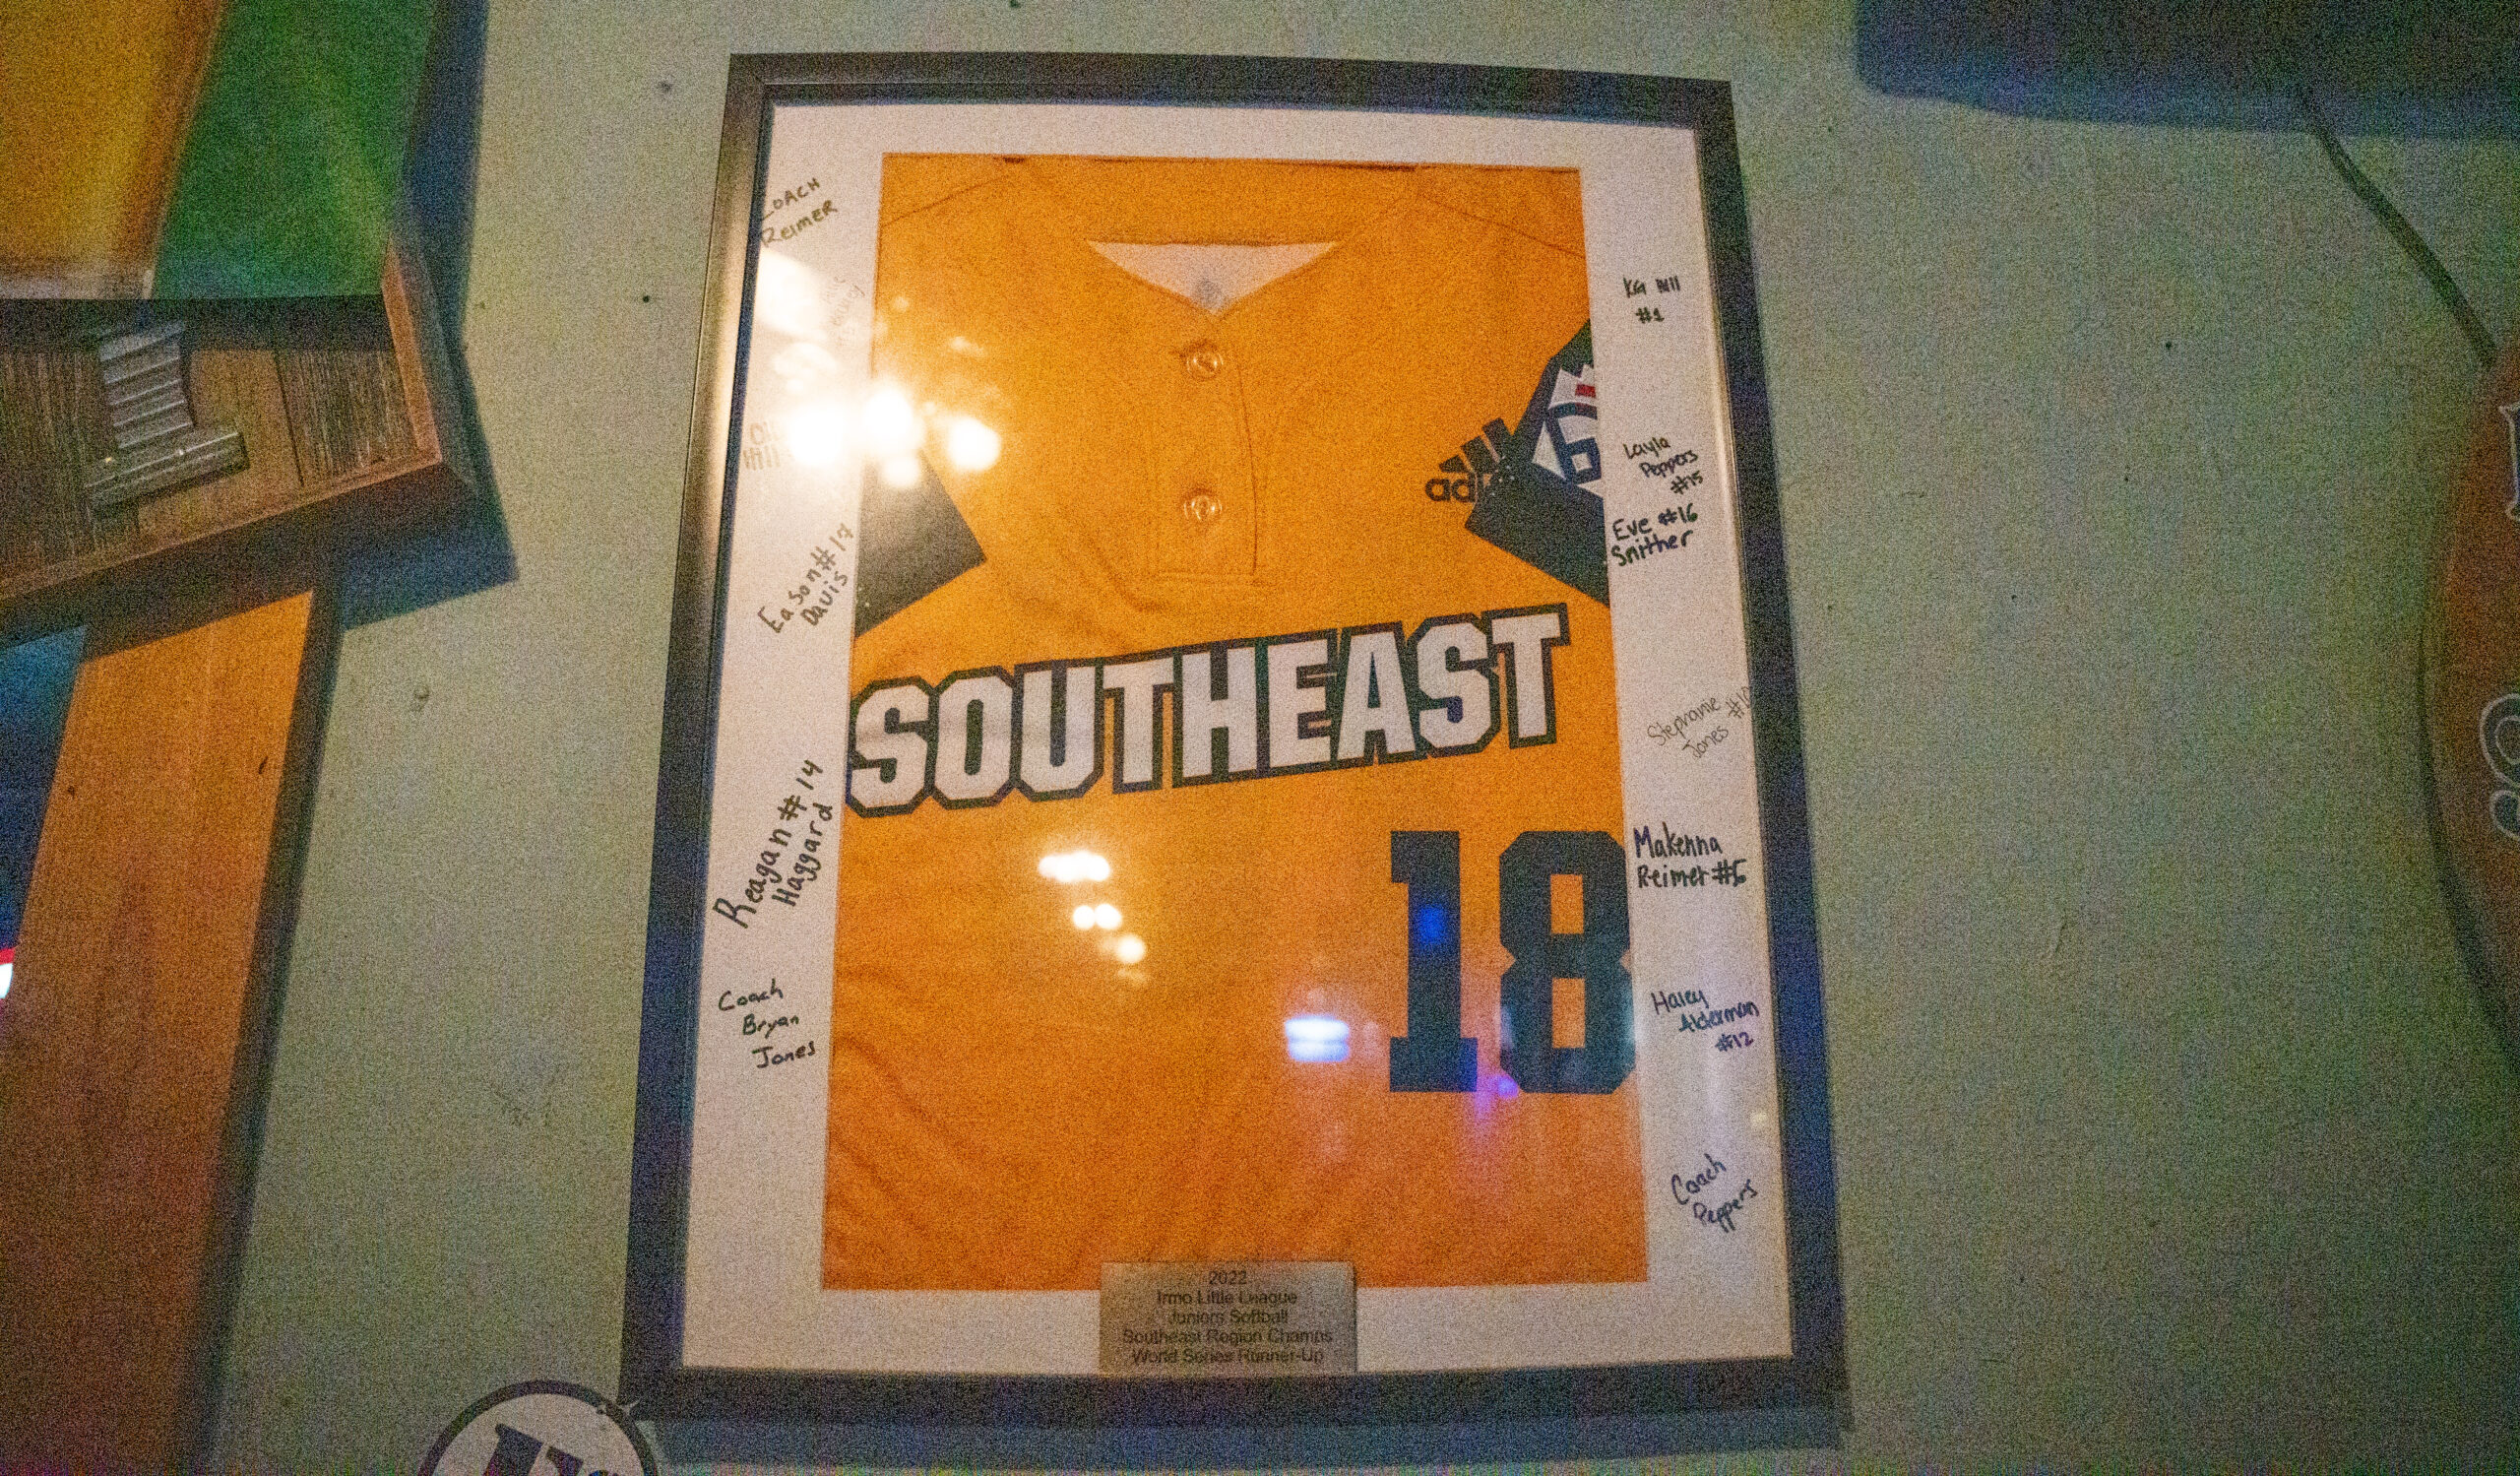
Baseball may have come first, but softball is what put Irmo Little League on the map. In 2022, the juniors team made it to the World Series in Seattle and came in second. Their Southeast jersey is framed at Lucky’s Burger Shack — it’s the place everyone flocks to when Irmo teams play in the World Series. The lineups are always posted and the regulars enjoy knowing who to root for each night.

“You don’t necessarily have to be family to be supportive of each other,” restaurant manager Kim Laniere said. “Everybody becomes aunts and uncles and brothers and sisters, you know, they all adopt whoever the kids are.”

A Southeast jersey autographed by the 2022 Irmo team that made it to the Junior League Softball World Series hangs inside Lucky’s Burger Shack. (Photo by Amanda Vogt)

The Grind

Irmo is the first local Little League to send four teams to their respective World Series in one season and it sent two teams in 2023 and 2024. But it’s not so simple to make that final tournament.

“It’s very hard, and for these players and families, there’s a lot of commitment that they make,” Jenson said.

Once All-Star teams are announced at the end of the spring regular season, practices begin and they’re intense. This year’s team that went to Williamsport practiced in the evenings three to four nights a week, starting at 7 p.m. to try and avoid the heat of the day. Practices were slotted for an hour and a half but it wasn’t unusual if they ran late and the crew shut down Friarsgate.

Manager Dave Bogan prepared his players intentionally and vigorously — they worked hard. His son, Andrew, was on the team, and his oldest, Jake who also played up through Irmo Little League, now goes to Dutch Fork High School.

“They got some of the high schoolers to come down and pitch to us, like throwing 70, 75, fastball, curveball, like all the pitches to get us ready for what we’re gonna face,” said Joe Giulietti, pitcher and third baseman.

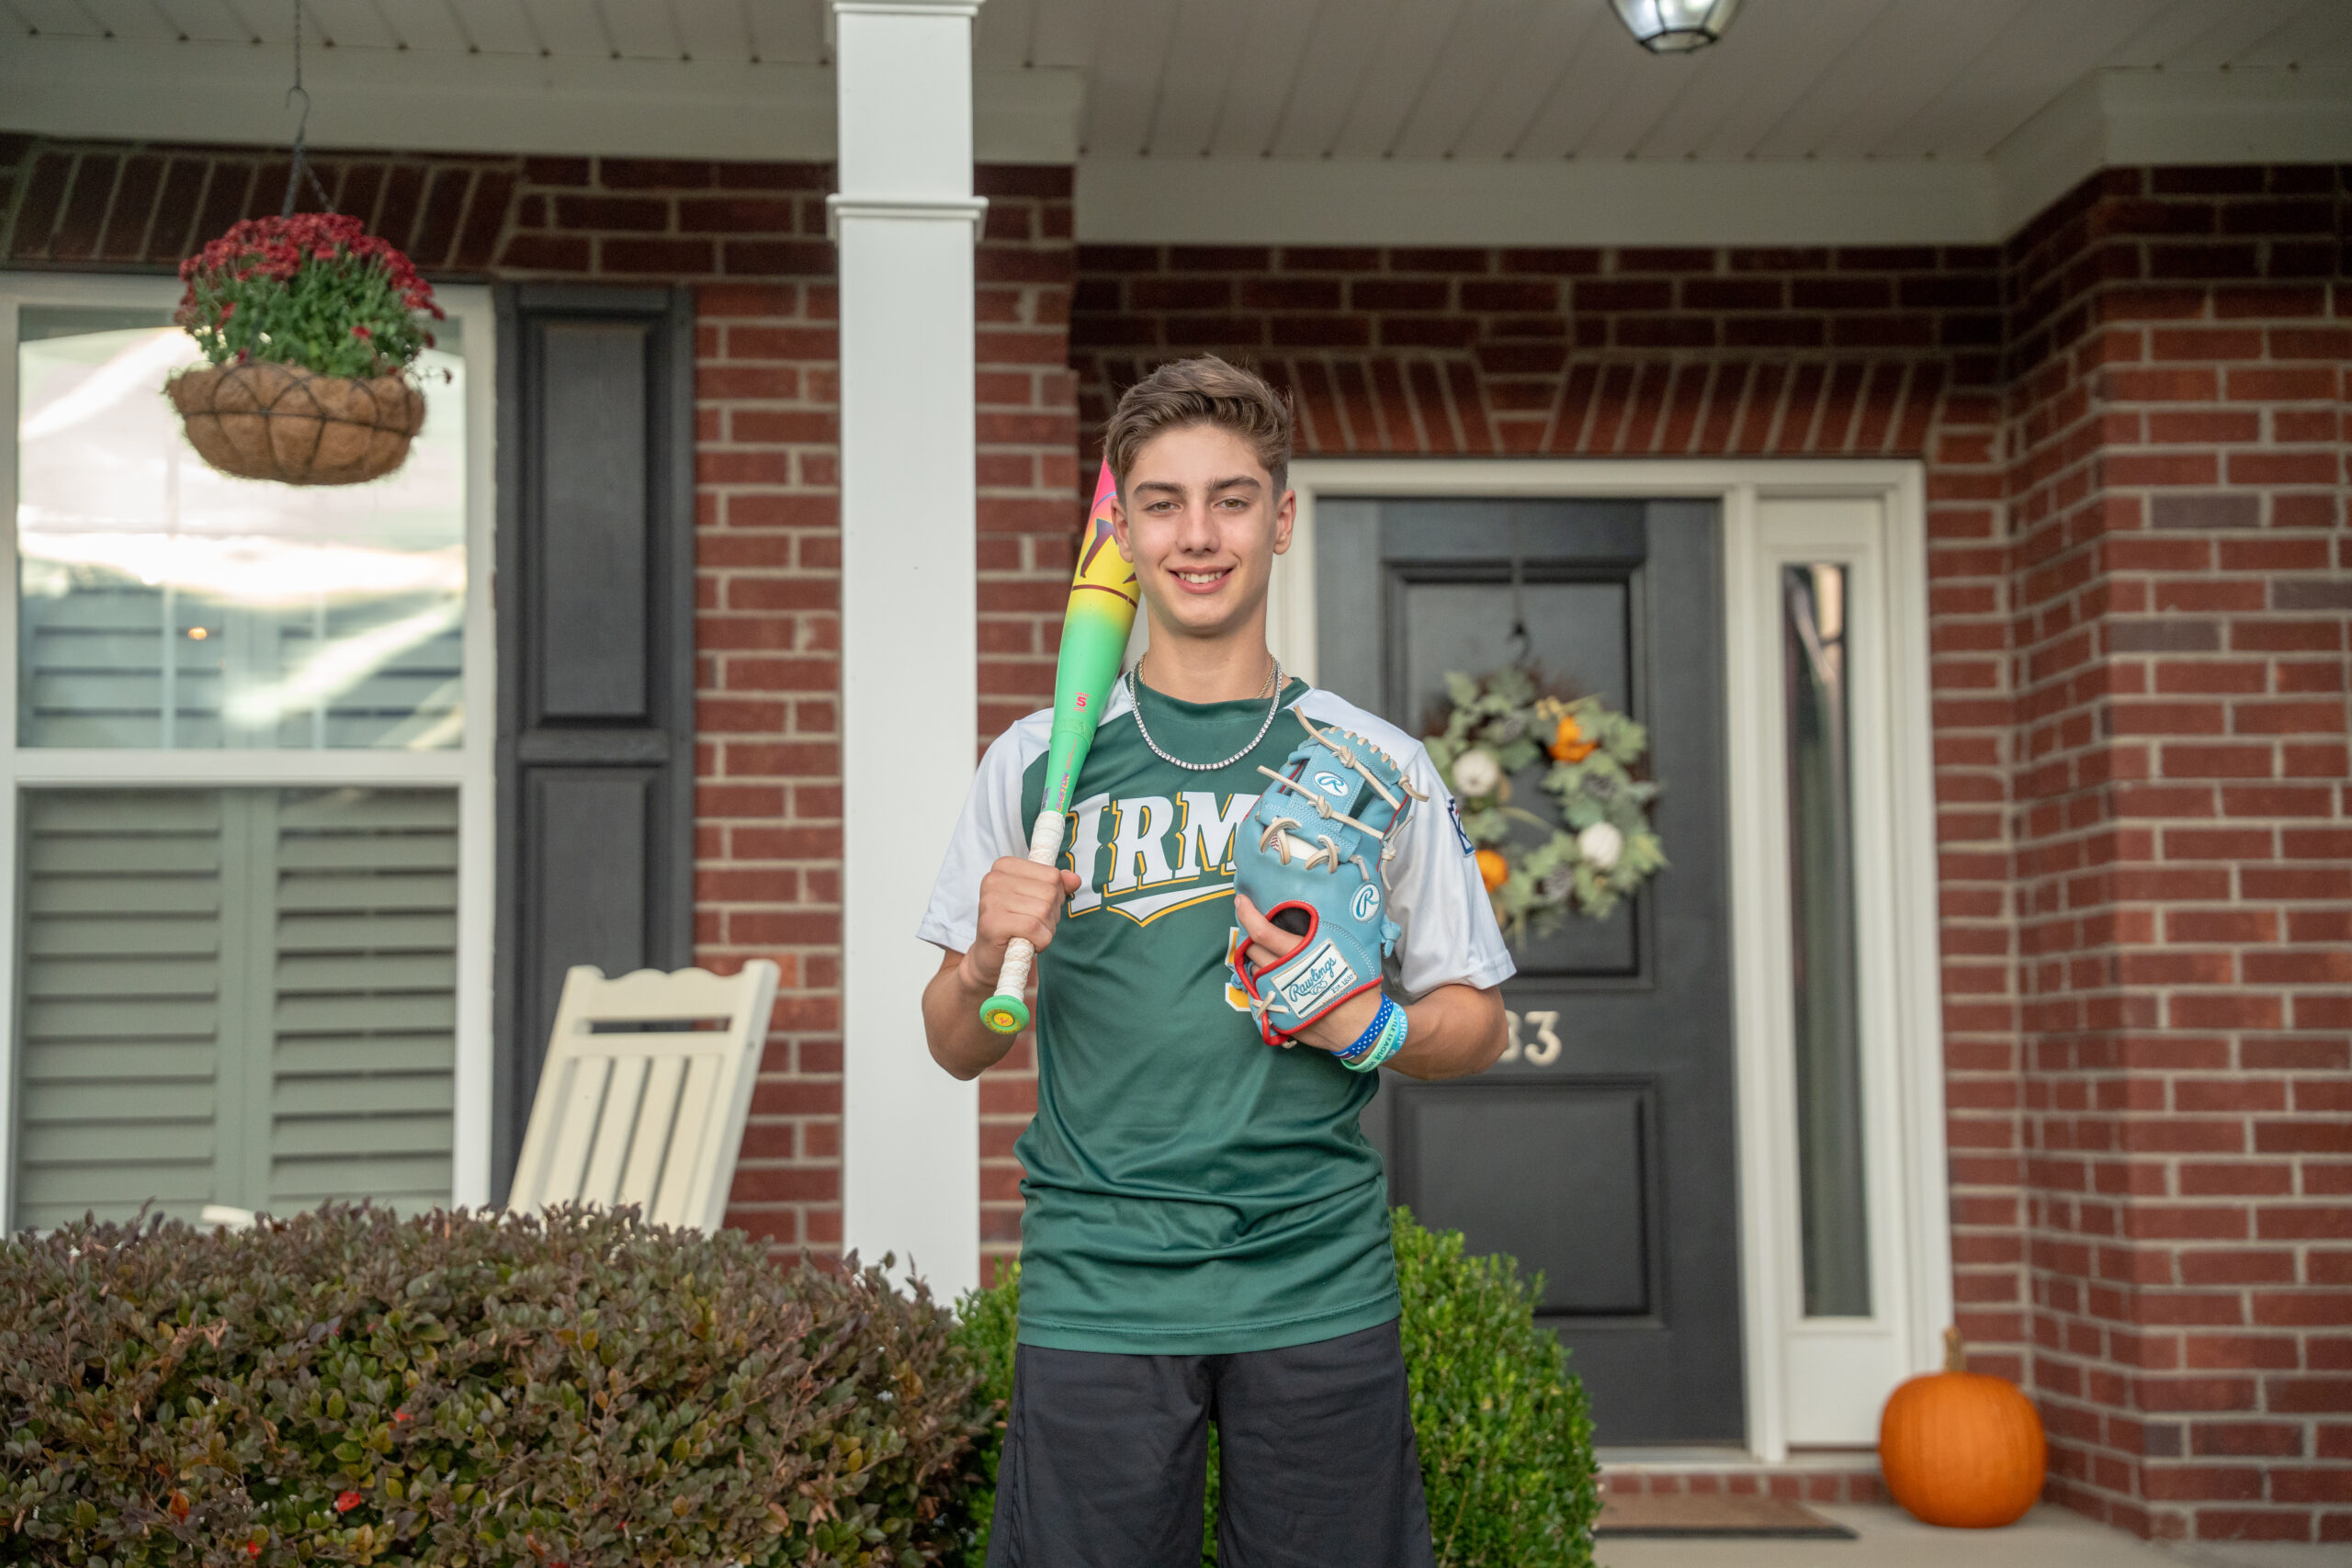
Joe was one of Irmo’s most powerful hitters and he’s not bad on the mound either. He hit a grand slam during Irmo’s first game in Williamsport and his younger sister teased him that it wasn’t even off the barrel. At Friarsgate, during the home run derby last year, he even broke a scoreboard.

“If you run cross county, which is the three-mile race, you’re gonna go out and you’re gonna train for eight or nine miles,” Bogan said. “If I can get a high school kid that’s going to throw 75 to 80, which is really fast for these boys, when we see someone throwing 60-70, they’re ready.”

Bogan had to switch fields for practice so he wouldn’t lose as many baseballs in the trees beyond the fence.

“Practice was always hard and they made it hard on purpose to face difficult moments so it would look easy and make it easy,” said Brady Westbrooks, who smacked the walk-off hit in the regional tournament that earned Irmo its trip to Williamsport.

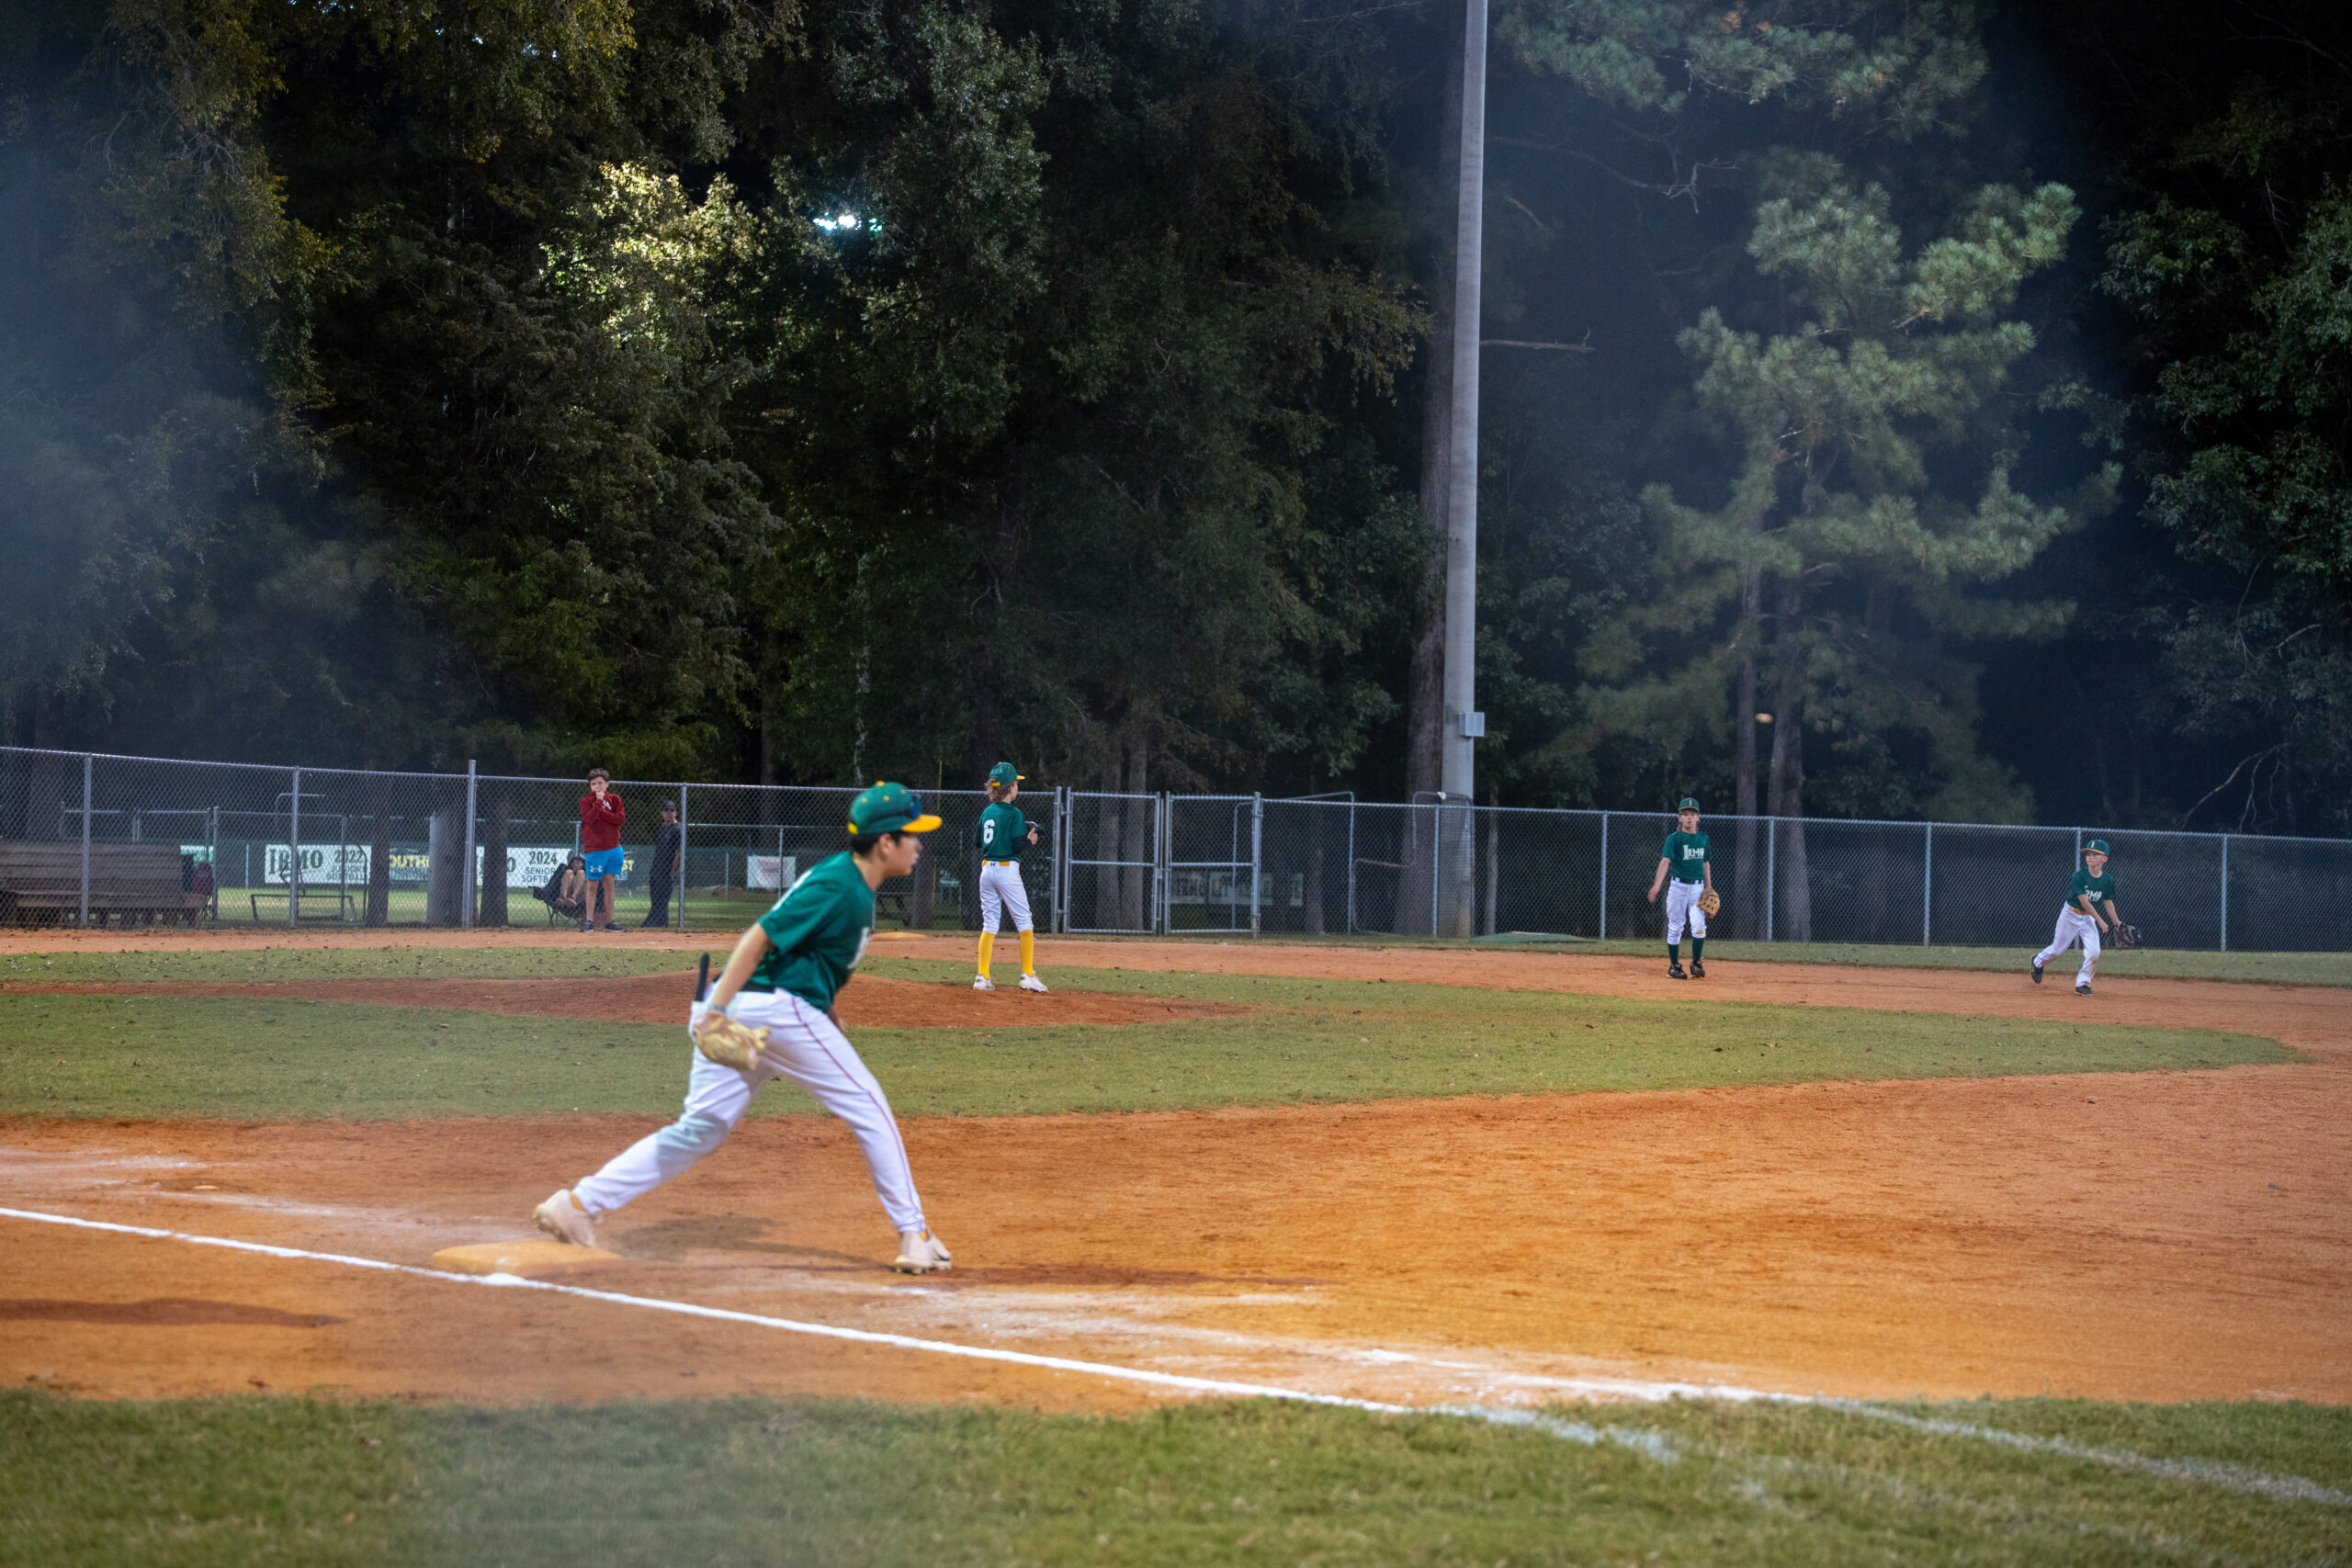
Irmo Little League in action (Photo by Amanda Vogt)

What Makes Irmo Different?

If you’re a parent and you have a son or daughter who wants to play ball, you basically have two choices: rec or travel ball.

Recreational baseball programs such as Little League don’t always have a great reputation because they aren’t necessarily recognized as competitive as travel ball. Even the Giuliettis were skeptical.

Before arriving in Irmo because of a career move, they lived in Texas. There, Joe seemed to out-grow Little League ball. He always had a strong arm. In Williamsport, Joe never gave up a hit.

“The coaches (in Texas) were trying to teach him to either roll it or to throw a rainbow,” Jill Giulietti said. That was because they worried Joe would “take someone’s face off.” So, to put Joe in a more competitive baseball environment, the Giuliettis turned to travel ball.

That’s where they believed the best players had the best opportunities. They had no idea Irmo was such a baseball haven.

While the popularity of travel ball has skyrocketed, Irmo Little League hasn’t been affected because of the program’s commitment to letting travel and rec play coexist. The two sometimes conflict in scheduling.

Before Jenson was league president, Justun Baxter held the position for eight years and he bought into travel ball rather than trying to work separately from it.

“Justun got them involved with our concession stand and stuff like that, to where you can make a little extra money to help your travel ball team expenses,” Jenson said about Baxter’s approach. “That got travel ball players to come back (for Little League).”

Joe Giuliette of Irmo Little League (Photo by Amanda Vogt)

Irmo Little League refrains from having its games on the weekend because that’s when travel tournaments are typically held. Now when those tournaments use Friarsgate fields, all concession sales go back to Irmo Little League. Jensen and other volunteers are typically outside of the concession stand under a tent working the grill all afternoon.

While Irmo Little League prevents travel teams from staying together — players get divided among all teams in their age group — it ultimately makes the spring regular season games more competitive.

“They get to play against each other, pitching against each other, hitting against each other, it brings back that excitement to the travel ball players,” Jensen said. “You get the better players in your zip codes and success can happen.”

Because of its recent success, Irmo Little League is expecting to have close to 1,000 kids playing baseball and softball in the spring. This fall, a record 43 teams (nearly 500 kids) played, which is nearly double the amount of participation compared with when Jensen first got involved 15 years ago.

And for a sport like softball, the popularity and excitement are only continuing to grow.

Sarah Minchew coached her daughter, Ainsley, in the junior softball Little League World Series last summer. Sarah grew up playing the game, but Ainsley was a dancer before becoming a lights-out pitcher. Sarah sees a drastic difference in the sport’s popularity because of the exposure collegiate softball now receives.

“The diamond sports, to me, are some of the most difficult games because you have to be really athletic, but you also have to be really skilled,” Sarah said. “You can’t just get by with athleticism, you have to really commit yourself to being a good skilled player too, so it’s unique in that regard, but I think girls are putting in more time than they ever have historically to this game.”

Irmo currently has its highest participation in softball with at least 250 girls expected in the spring and about 150 playing this fall.

Irmo Little League softball is experiencing record participation. (Photo by Amanda Vogt)

Community Commitment

Jensen and Baxter spend nearly 40 hours every week at Friarsgate and that’s in addition to their full-time jobs. Irmo Little League is run entirely by volunteers and most parents are highly involved in the league’s operation.

There are about 200 volunteers, but Baxter said only about five “put in way too much time.” Even though his kids are too old to still play in Irmo Little League, he wouldn’t do anything differently.

“This is my home,” Baxter said, adding that he believes this league is so successful because “it’s 80% family, 20% baseball.”

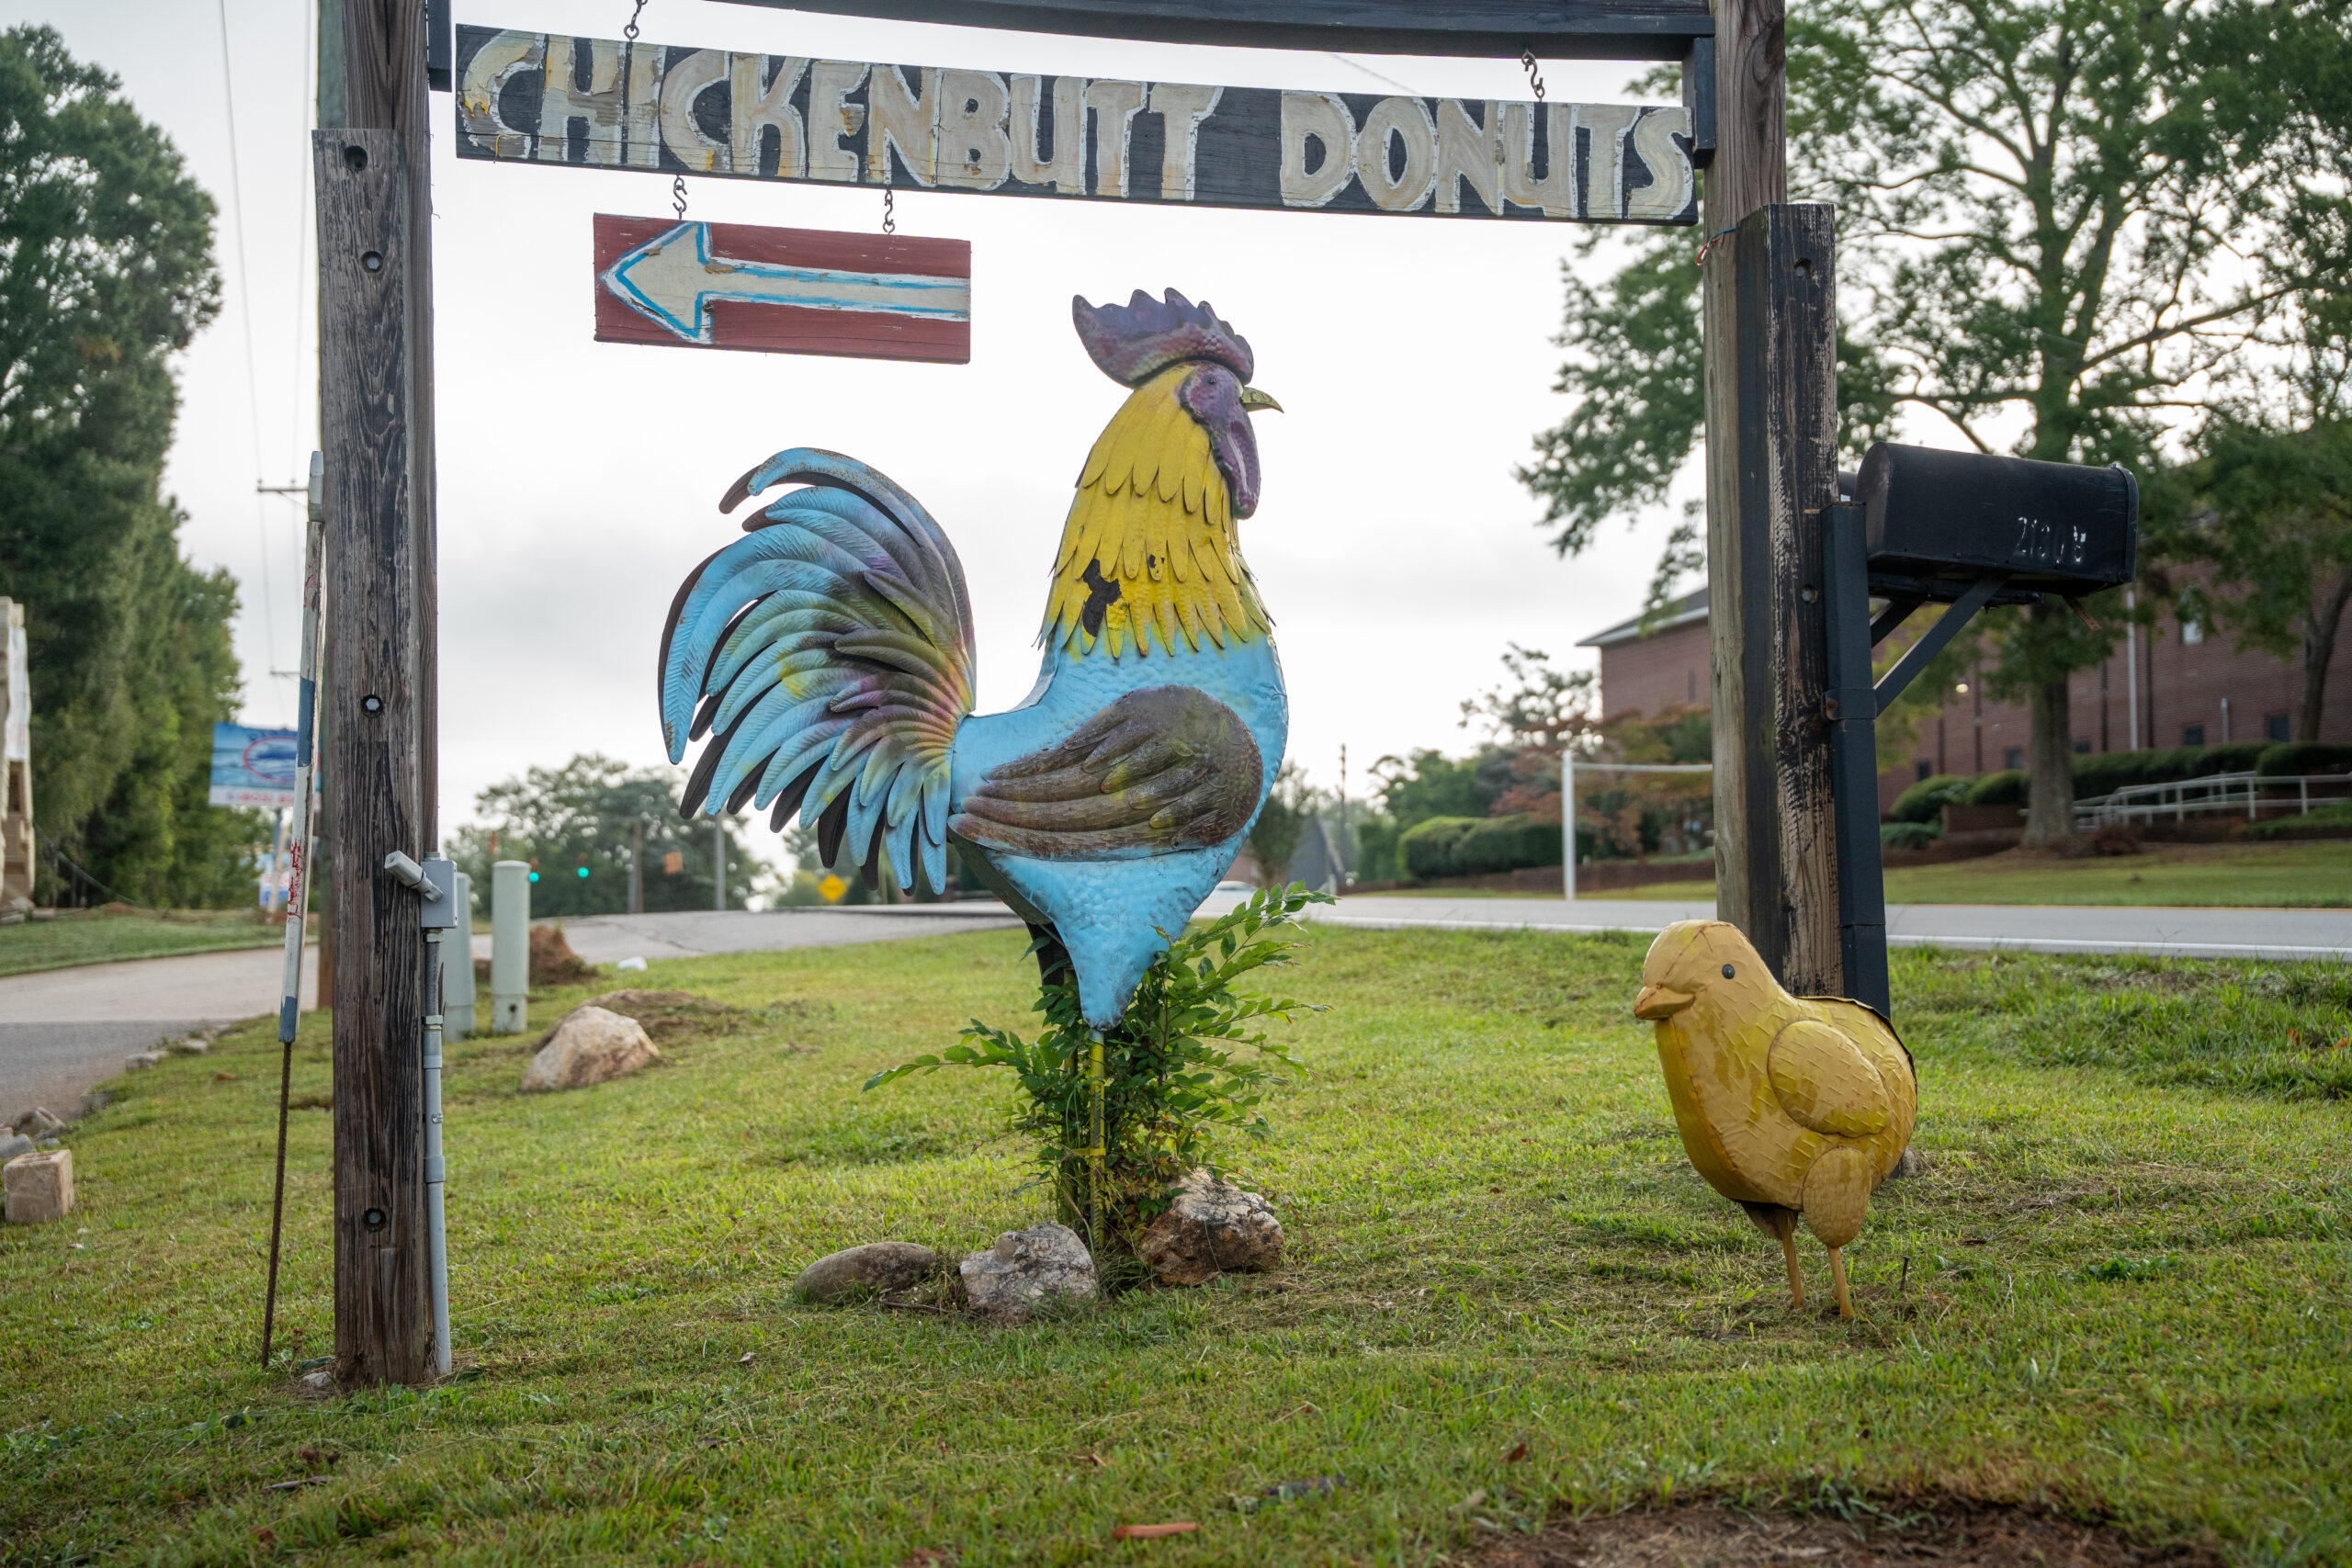
Irmo is a place where many people grow up and eventually move back to and start businesses. Tre Dabney opened Chickenbutt Donuts seven years ago with his wife. He grew up in Irmo and played Little League — now he’s a sponsor of the program.

“There just hasn’t been a better place that I’ve been,” Dabney said. “And it really seems like the rest of the country is figuring it out. The secret is kind of out.”

Chickenbutt Donuts was a part of Irmo Little League’s largest fundraising year last season, supplying over 300 dozen donuts sold at the concession stand. Dabney does not see this partnership ending anytime soon.

“It’s great coaches and it’s great kids and it’s a great community supporting them along the way,” Dabney said. “When you see what they put on the field, it looks like magic, it looks like it’s just supernatural, but really, it’s about coaches working hard and kids working hard and the community putting the full force of their support behind all of them. And boy, howdy.”

Over 300 dozen Chickenbutt Donuts were sold at Friarsgate Park last year. (Photo by Amanda Vogt)

Baseball Is Fun!

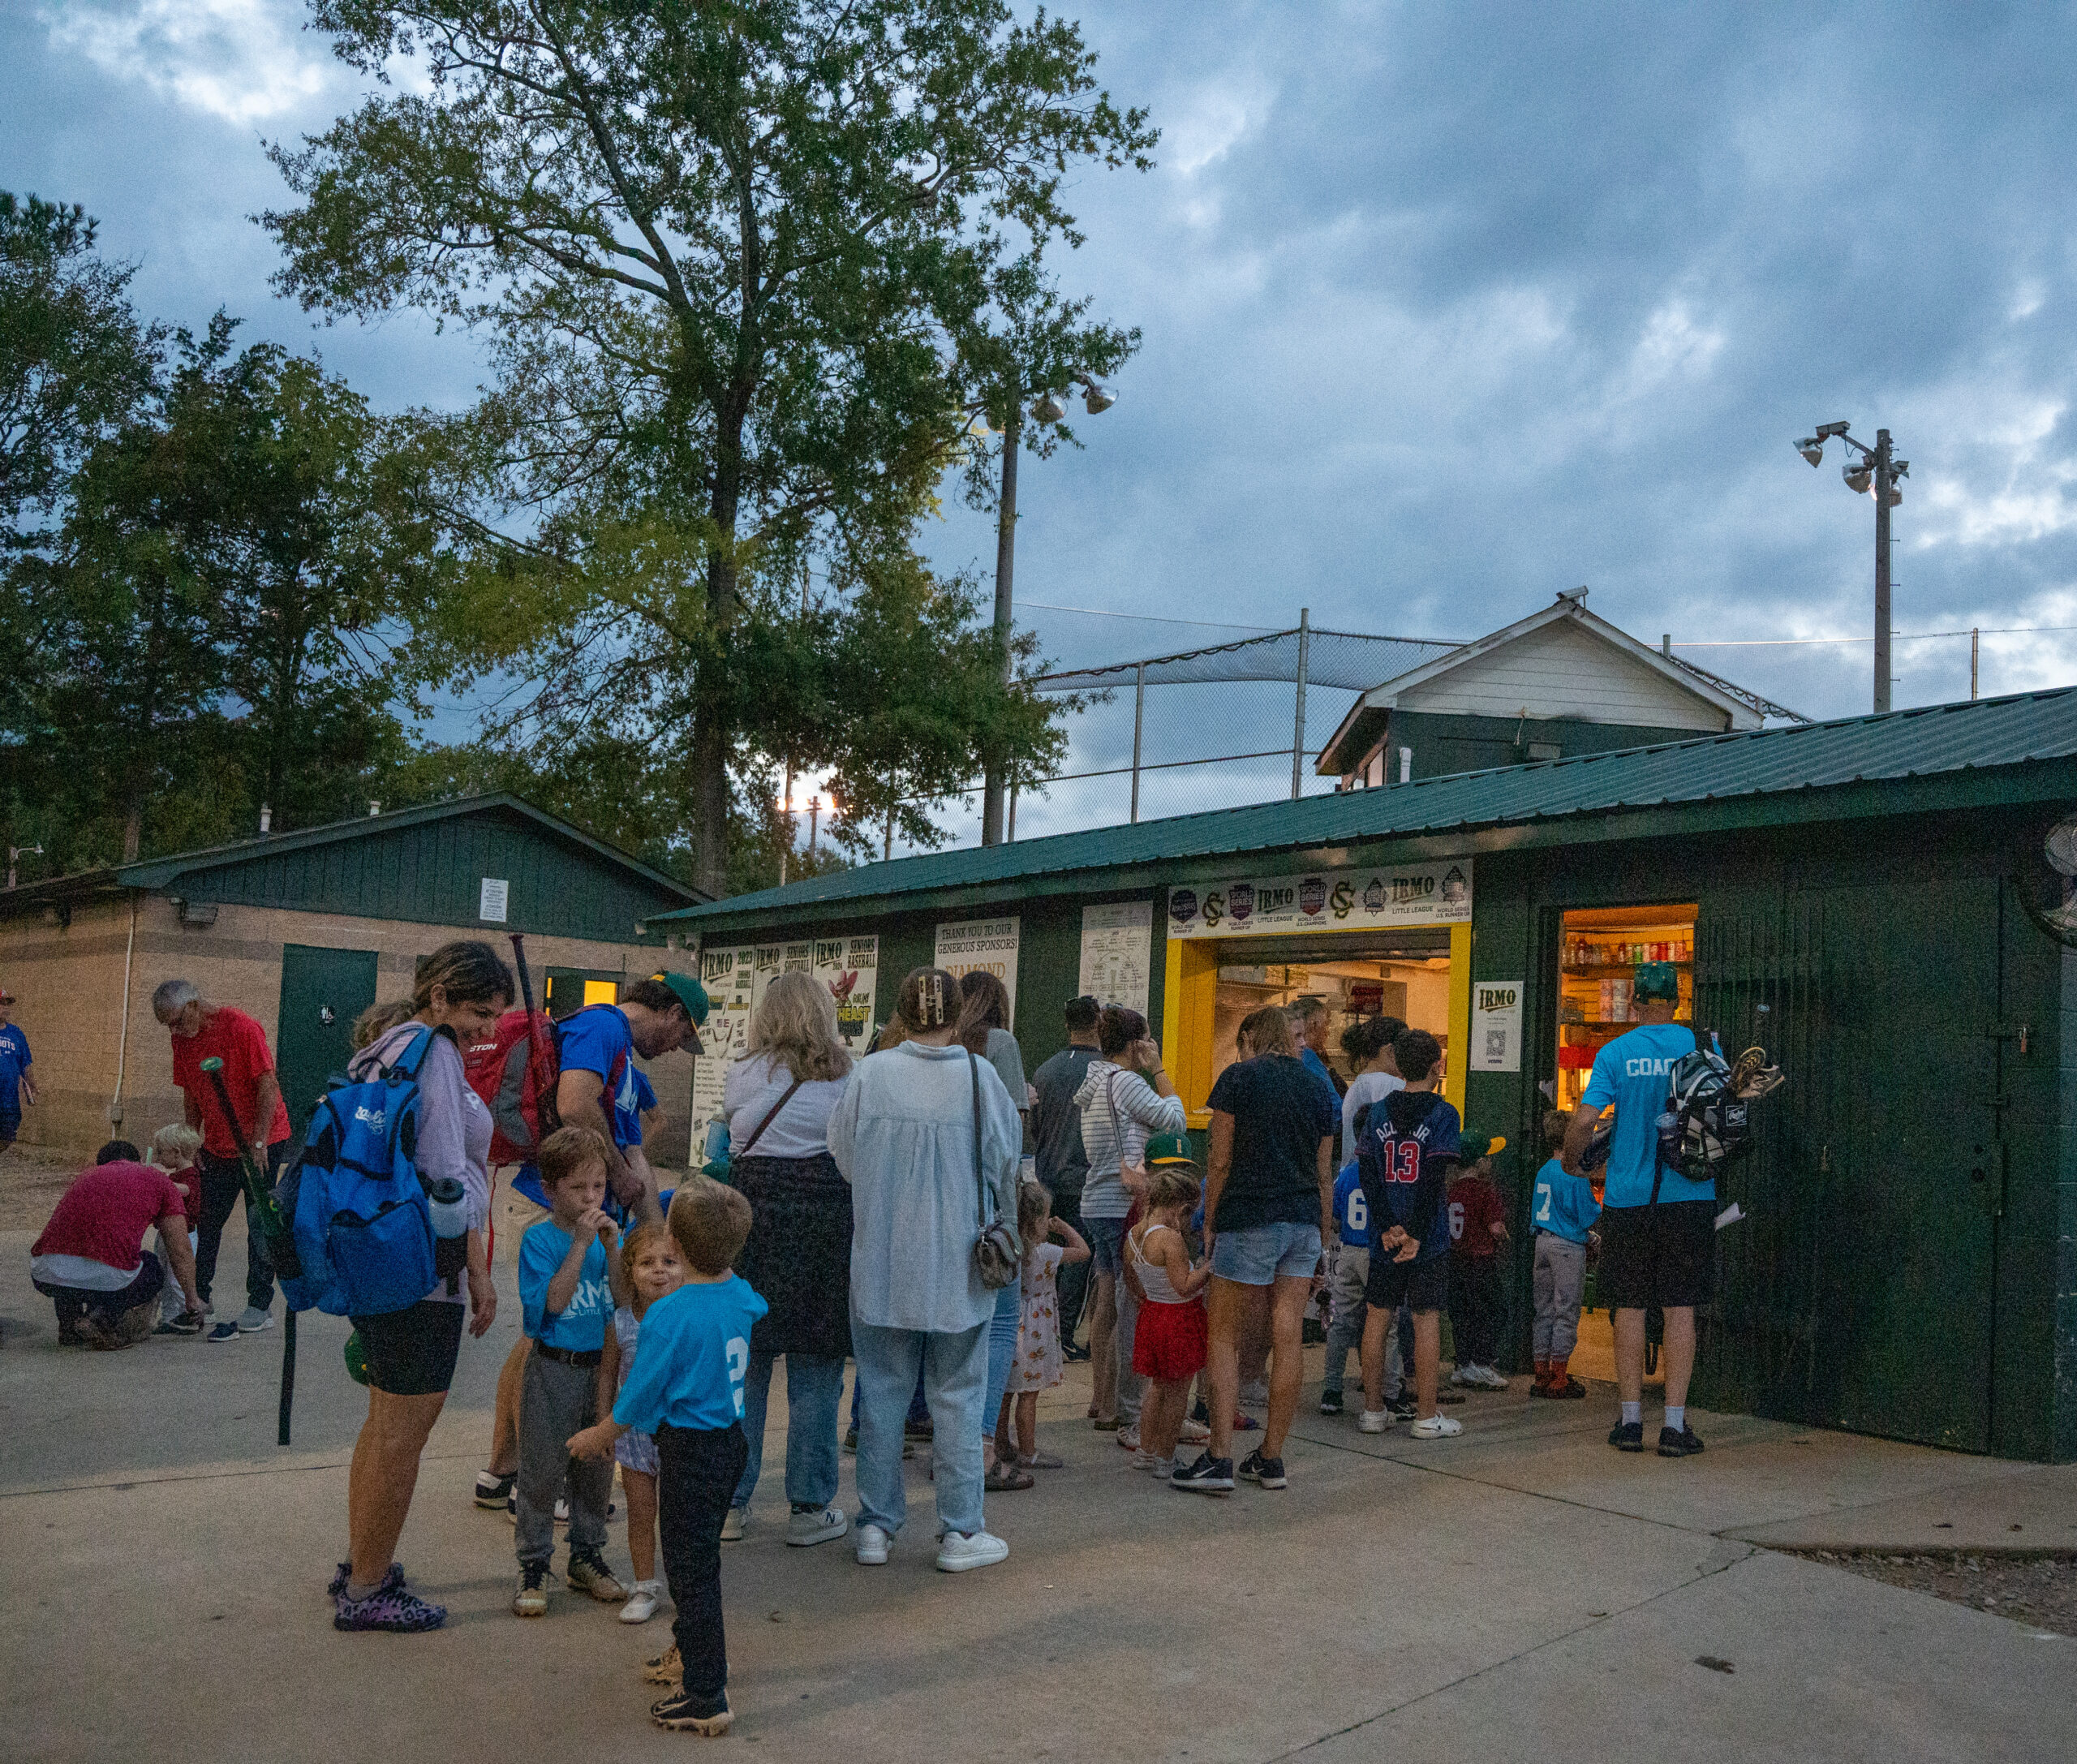
In a town like Irmo, baseball is tradition. The community rallies behind its clubs and in September it hosted a town celebration for the four teams that made Little League World Series appearances.

“Success is when I come down here (to Friarsgate), am I seeing a bunch of smiling faces?” Jensen said. “Are siblings who you see at other sports maybe getting dragged by the hand out of the car because their brother or sister is playing? Versus, when they get out of the car here, and they’re running to see their friends. That, to me, is success.”

Sunflower seeds coat the ground from underneath the bleachers where parents keep a close eye on the game. Siblings and other kids are running around, even tossing rocks in the air and trying to hit them with sticks while baseball is played all around them.

“You have so many people come out that are not even having to be here that night but are coming just because it’s so much fun,” Jensen said.

In the rare moments when not all of the Friarsgate fields are occupied, the lights remain on.

Kids often just play sandlot ball on the fields, nothing serious, just fun. Friends are made during pick-up games of catch or impromptu hitting practice.

“I’m sure this happens at lots of Little Leagues, I’m not saying it doesn’t, but that’s the kind of thing that makes it special,” Bogan said mid-interview, when he noticed a group of kids randomly playing together. “I don’t even know how well (they know each other) but they’re out there playing and they’re just goofing off.

“It’s just a fever about playing baseball.”

Joe, the slugger/pitching star for Irmo, certainly has that fever. After coming back from Williamsport, the first thing he did was pick up a bat and started swinging in the back yard.

“If we were the ones pushing him, I feel like it wouldn’t be right, but he wants to do it,” said his father, Jason Giulietti.

Members of last year’s All-Star teams are still deciding if they will return to Irmo Little League or not. The divisions they compete in are changing as the kids get older. But no one wants to think about next year yet — the accomplishment of making it to a Little League World Series is still sinking in.

Irmo Little League families line up at the Friarsgate Park concession stand. (Photo by Amanda Vogt)

“Imagine having a great Thanksgiving dinner and you’re just stuffed and you’ve had a great experience, you wouldn’t trade it for anything and then people say ‘Well what are you going to do for breakfast tomorrow?’ Like, you’re not ready to think about it,” Bogan said, referring to a conversation he had with his wife about baseball decisions for next spring. “That’s kind of where we’re at. We’re not really ready to think about it.”

But if not Bogan, someone will coach Irmo Little league next year. And kids will certainly be ready to play. And Friarsgate will be ready to greet them.


Sunday Notes: Bobby Abreu, Jimmy Rollins, Chase Utley, and the 2026 HoF Ballot

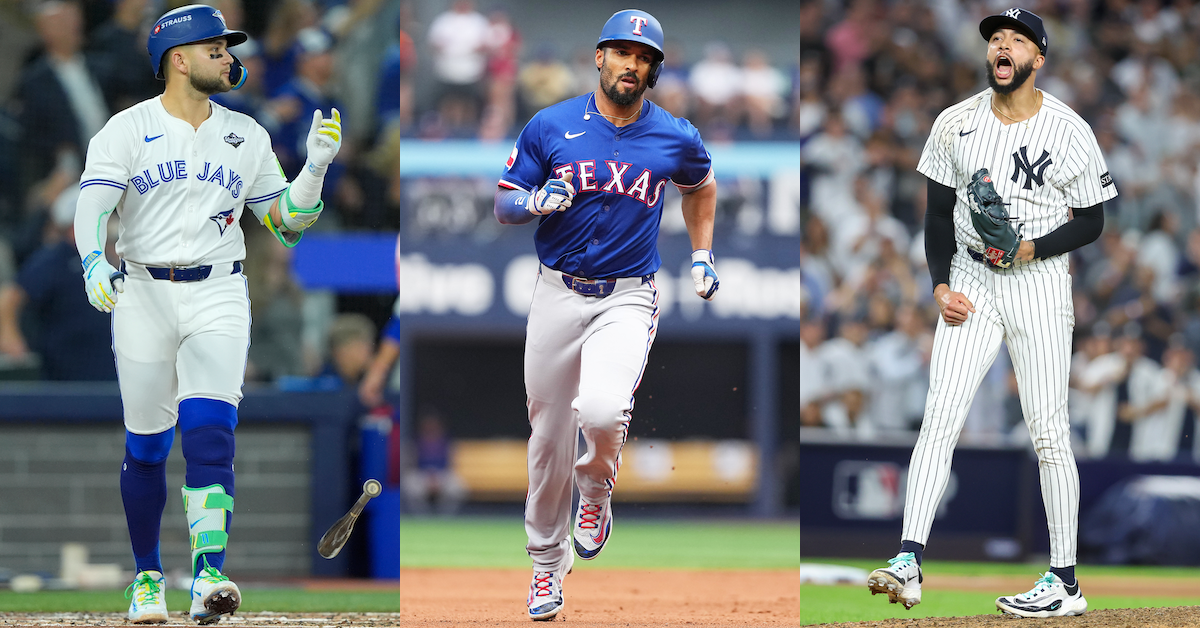
This year’s Hall of Fame ballot included three former Philadelphia Phillies position players, none of whom received the necessary 319 votes (out of 425 cast) to gain election. Chase Utley fared best with 251 votes (59.1%), while Bobby Abreu got 131 (30.8%), and Jimmy Rollins received 108 (25.4%). As did my colleagues Jay Jaffe and Dan Szymborski, I put checkmarks next to Abreu’s and Utley’s names, but not Rollins’s.

How did other BBWAA voters choose among the Phillies trio? A comprehensive answer isn’t possible — not everyone makes their ballots public — but we do know about the 260 voters whose selections were shared on Ryan Thibodaux’s Ballot Tracker. Here is the breakdown as of yesterday afternoon courtesy of the Tracker’s Anthony Calamis:

66 voted for none of the three.
25 had all three.
52 had only Utley.
9 had only Abreu.
3 had only Rollins.
63 had Utley and Abreu, but not Rollins.
42 had Utley and Rollins, but not Abreu.

As for the players’ relative merit, that is in the eye of the beholder. Reasonable arguments, both for and against, can be made for all three former Phillies by prioritizing specific statistics and accolades — or even reputations (none of Abreu, Rollins, or Utley have been tainted by scandal). Read the rest of this entry »


FanGraphs Weekly Mailbag: January 24, 2026

Troy Taormina-Imagn Images

At this time last week, the Mets were celebrating their signing of Bo Bichette. Up until that point, though, their offseason was largely being viewed as a letdown as they assembled an oddly shaped roster. Earlier this winter, they watched as Edwin Díaz spurned them for the Dodgers, let Pete Alonso walk and then signed Jorge Polanco to play first base, and missed out on Kyle Tucker. Sure, they upgraded at second base with the Marcus Semien trade, but doing so required them to part with Brandon Nimmo, who was coming off a year in which he hit a career-high 25 home runs and posted 3.0 WAR. They decided to replace that production with 23-year-old Top 100 prospect Carson Benge, who had a 53 wRC+ in 103 Triple-A plate appearances last season, as the big spoon of a platoon in left field. They also reinforced their bullpen with two of the more inconsistent members of the 2025 Yankees’ relief corps, Devin Williams and Luke Weaver. These weren’t bad moves, to be clear. Williams especially is a strong bounce-back candidate; Polanco is a quality player, though his entire experience at first base consists of one defensive plate appearance; and Semien fulfills the team’s desire to get better defensively. But they were a bit puzzling given that the Mets’ greatest areas of need were another impact bat, a center fielder, and a frontline starting pitcher.

As it turns out, adding Bichette was just the first in a trio of acquisitions to address those major roster holes. Late Tuesday night, the Mets traded for center fielder Luis Robert Jr., who is coming off two straight seasons of injuries and poor performance but is still a tantalizing talent and just 28 years old. “If you made an outfielder in a lab, he’d look a lot like this,” wrote Ben Clemens about Robert after the trade. Then, on Wednesday, they swung a swap with the Brewers for All-Star right-hander Freddy Peralta to anchor their rotation. They had to give up two of their top prospects to get him, but as Davy Andrews noted in his column on the trade, “the Mets are trying to win this season, and now that he’s not in Milwaukee, David Stearns has the luxury of leaving tomorrow’s problems for tomorrow.”

We won’t be answering any questions about the Mets or any of the other big recent transactions, such as Cody Bellinger’s re-signing with the Yankees or the Rangers’ trade for MacKenzie Gore, but we will be talking about the other big baseball topic of the week: the Hall of Fame. We’ll also discuss the best left-on-left hitters of all time, the aesthetic potential of the Colorado Rockies, and what to expect from Foster Griffin with the Nationals. But first, I’d like to remind you that this mailbag is exclusive to FanGraphs Members. If you aren’t yet a Member and would like to keep reading, you can sign up for a Membership here. It’s the best way to both experience the site and support our staff, and it comes with a bunch of other great benefits. Also, if you’d like to ask a question for an upcoming mailbag, send me an email at mailbag@fangraphs.com. Read the rest of this entry »


2026 ZiPS Projections: St. Louis Cardinals

For the 22nd consecutive season, the ZiPS projection system is unleashing a full set of prognostications. For more information on the ZiPS projections, please consult this year’s introduction, as well as MLB’s glossary entry. The team order is selected by lot, and the ultimate team is the St. Louis Cardinals.

Batters

If you looked up “.500 team” in the dictionary, you’d find, well, nothing. THAT’S NOT HOW DICTIONARIES WORK. But if they did have extensive listings of colloquialisms and an editor obsessed with baseball, you might see the 2025 Cardinals. Despite not falling behind by double digits in the NL Central race until late in the season, the Cardinals certainly never felt like they were ever realistically in any playoff race. At the same time, they were also never enough of a doormat team to be interesting out of ineptitude. The Cards spent the season basically playing out the string, in baseball limbo while fans waited out the swan song year of executive vice-president John Mozeliak, with most of the interest surrounding when/if various veterans would be traded.

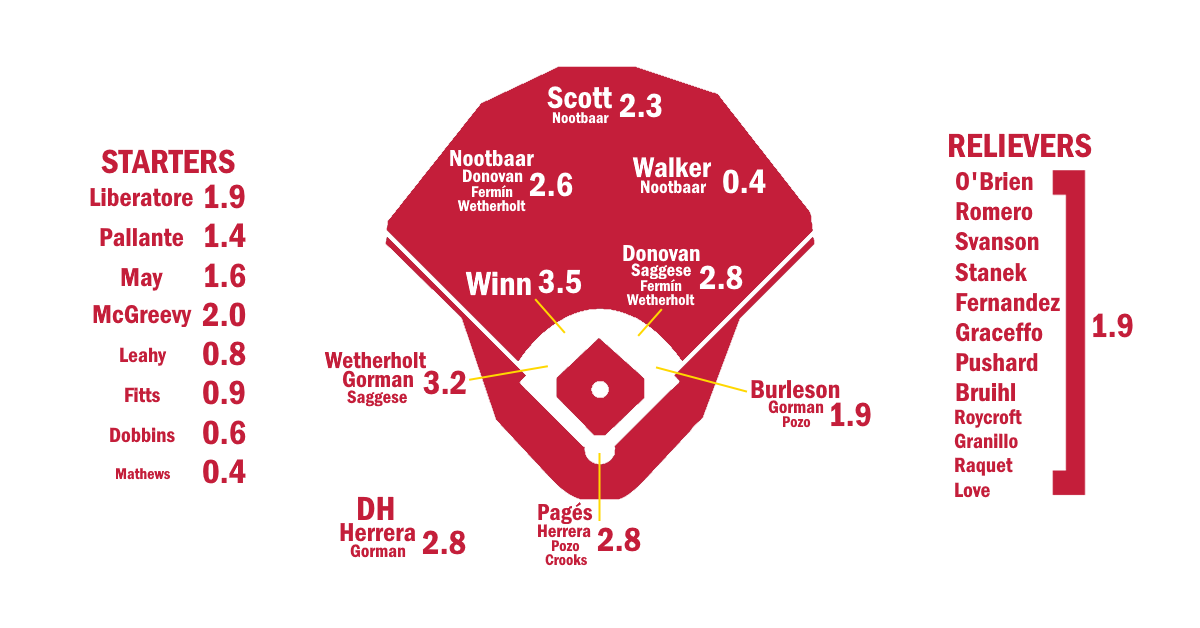
While roughly a .500-looking team has some wild card upside, St. Louis has the look of a team with an incredibly low ceiling in the short term, like on the level of that room near the start of Willy Wonka’s factory tour. Only Masyn Winn is a high threat to put up a 4-WAR season, and he’s already at that level, not someone who can break out to that level. But except for right field, since ZiPS has long since thrown in the towel on Jordan Walker, the Cardinals also aren’t bad anywhere in their lineup, either. Brendan Donovan is extremely versatile, but he could be traded sometime during the season, if not before then, and players like Nolan Gorman and JJ Wetherholt can also collect plate appearances playing a variety of positions. Wetherholt’s first full professional season was a dynamite one, and he gets a strong projection entering his first year in the big leagues. ZiPS at least sees him as an upgrade on the departed Nolan Arenado in 2026.

ZiPS thinks Lars Nootbaar is still young enough to bounce back from a real down season in 2025. When that may happen, though, is an open question. Last fall, he had surgery to shave down his heels to remedy his Haglund’s deformities, and reading the first half of this sentence makes me wonder if my brain has actually finally lost its last connection with reality. Nootbaar’s lack of ability to do much against lefties limits his upside, but like most of the rest of the team, he’ll be… fine. Also in that wide range of adequacy is Victor Scott II, who plays defense well enough these days to carry his abysmal offense, and Alec Burleson at first, who needs a lefty-crushing platoon partner, though he did improve some against southpaws last season. The Cardinals’ catching situation could be really interesting, depending on when and if Iván Herrera gets back to playing catcher. Even if he doesn’t, he’s shown he’s a good enough player to have value as a DH, and Pedro Pagés hits just enough that he’s not a problem starting behind the plate.

Luckily, the mid- and long-term outlooks for St. Louis are sunnier. Wetherholt has already been mentioned, but ZiPS thinks both Jimmy Crooks and Leonardo Bernal could hold their own as major league catchers. Joshua Baez has a strong long-term ZiPS projection, and the computer sees him as someone who could (and should) replace Walker if/when the former top prospect doesn’t come around.

Pitchers

As with the starting lineup, the Cards look like they’re going to have a very deep rotation, but one that’s almost mindblowingly average. Michael McGreevy has the best projected ERA of the starters, which ought to tell you a lot about the state of the rotation. If you believe ZiPS, St. Louis could field about three major league rotations of starting pitchers with an ERA+ somewhere in the 90s. So there’s not a lot of difference between the guys we have as getting the bulk of the innings on the depth chart (Matthew Liberatore, Andre Pallante, Dustin May, Kyle Leahy, Richard Fitts), and the guys who aren’t (Quinn Mathews, Tink Hence, Hunter Dobbins, Ixan Henderson, Tekoah Roby if not for the Tommy John surgery). In other words, this group probably won’t crack the top 10 in starting pitcher WAR, but there are enough spares that it likely won’t be an embarrassment, either.

While that’s not great for the team’s chances to contend in 2026, that does suggest a path to long-term benefits. The deep stable of no. 3 and no. 4 starters is decidedly on the young side, all in their 20s, and at least some of them ought to develop into something better. Mathews is probably the best candidate to do so, as is Hence, even though there’s a reasonable chance that the latter pitches out of the bullpen in the short term. Liam Doyle didn’t get an official projection here because of his lack of professional experience, but if I instruct ZiPS to use his college translations, he has a very good long-term outlook, too.

ZiPS projects the bullpen as below average, but not in dumpster-fire territory. The computer only really likes three relievers, JoJo Romero, Matt Svanson, and Gordon Graceffo, and a fourth if you believe the Cards will use Hence in relief in 2026. Outside of that quartet, there are a lot of guys with projected ERAs just above four in relief, firmly in C- territory. It’s probably not quite this bad, as the multitude of starting pitching options means the pen will get some reinforcements if the top starters are healthy, so someone like Leahy could end up here after all. In any case, this is a middling bullpen, one that probably won’t approach the production of last year’s unit, which had the ninth-best relief WAR in baseball.

All told, ZiPS sees St. Louis as, you guessed it, about a .500 team.

Ballpark graphic courtesy Eephus League. Depth charts constructed by way of those listed here. Size of player names is very roughly proportional to Depth Chart playing time. The final team projections may differ considerably from our Depth Chart playing time.

Batters – Standard
Player B Age PO PA AB R H 2B 3B HR RBI BB SO SB CS
Masyn Winn R 24 SS 597 545 79 136 27 2 12 61 41 110 12 4
JJ Wetherholt L 23 SS 523 461 66 117 20 1 10 62 50 84 12 2
Brendan Donovan L 29 2B 534 473 63 129 26 1 11 54 47 70 3 3
Iván Herrera R 26 DH 464 402 58 110 20 1 14 60 49 91 8 2
Lars Nootbaar L 28 LF 539 465 68 114 24 2 16 54 66 108 5 3
Jimmy Crooks L 24 C 455 415 50 100 19 2 10 49 31 124 1 0
Nolan Gorman L 26 3B 463 413 57 92 18 0 21 61 46 148 3 1
Alec Burleson L 27 1B 530 486 58 133 23 1 18 68 36 73 5 1
Leonardo Bernal B 22 C 468 427 49 98 18 1 10 47 34 97 6 3
Victor Scott II L 25 CF 514 452 60 102 16 3 7 43 41 108 36 6
Pedro Pagés R 27 C 384 351 35 79 15 1 10 42 24 100 1 0
Thomas Saggese R 24 2B 546 502 63 125 24 2 11 58 32 141 6 3
José Fermín R 27 2B 349 299 43 71 18 0 6 38 37 38 11 4
Bryan Torres L 28 2B 460 393 53 109 17 1 4 43 53 74 16 6
Joshua Baez R 23 RF 468 418 55 98 22 2 12 57 36 137 24 5
César Prieto L 27 SS 519 482 60 125 27 2 7 56 24 76 6 7
Mike Antico L 28 LF 451 407 53 94 18 2 7 44 33 118 19 4
Nathan Church L 25 CF 493 448 62 111 18 2 7 50 31 64 12 4
Jon Jon Gazdar R 24 SS 460 417 46 100 13 1 1 43 24 56 9 4
Matt Koperniak L 28 RF 511 469 55 114 17 2 11 54 35 106 6 3
Ramon Mendoza R 25 3B 374 329 38 72 13 1 6 36 34 89 2 2
Yohel Pozo R 29 C 301 290 30 76 18 0 8 38 8 34 1 0
Noah Mendlinger L 25 RF 458 399 49 98 17 2 1 43 37 55 5 4
Blaze Jordan R 23 1B 530 494 58 120 25 1 12 58 28 68 2 1
Deniel Ortiz R 21 1B 473 422 50 91 19 1 11 53 42 148 18 6
Carlos Linarez R 24 C 157 146 12 29 4 1 2 13 8 64 1 1
Ryan Campos L 23 C 406 365 39 76 19 2 2 30 38 83 6 2
Sammy Hernandez R 22 C 395 347 36 68 12 0 3 34 28 88 4 2
Chase Davis L 24 CF 482 431 48 89 17 0 7 44 43 155 5 1
Dakota Harris R 24 3B 453 421 50 99 18 0 6 46 16 94 10 4
Graysen Tarlow R 24 C 190 165 14 37 4 0 1 15 16 49 0 2
Jesus Baez R 21 SS 435 402 49 88 13 0 12 45 27 86 4 3
Gavin Collins R 30 C 270 244 25 53 9 1 4 25 18 41 2 1
Jordan Walker R 24 RF 530 482 52 112 23 1 14 57 39 140 9 3
Jose Cordoba R 23 RF 282 260 28 56 14 2 2 25 14 59 7 2
Zach Levenson R 24 LF 441 394 47 84 16 1 10 46 40 101 4 5
Travis Honeyman R 24 CF 352 310 43 69 13 2 2 34 28 74 4 1
Chase Adkison R 26 DH 172 150 15 32 6 0 1 16 15 32 0 0
Jeremy Rivas R 23 SS 494 449 48 89 14 1 5 39 33 136 13 6
Miguel Villarroel R 24 SS 350 330 38 73 12 1 1 27 13 93 13 3
Tre Richardson R 24 2B 340 311 33 64 15 0 2 28 22 71 8 5
Andy Yerzy L 27 C 215 194 16 37 6 1 4 18 18 70 1 1
Michael Curialle R 25 3B 327 296 35 61 13 1 4 32 17 104 3 2
Trey Paige L 25 1B 386 350 42 71 13 4 3 31 29 122 4 2
Anyelo Encarnacion R 22 SS 423 383 37 74 13 2 5 33 33 154 9 4
Christian Martin L 23 2B 382 340 35 70 14 1 1 29 29 80 8 4
Ian Petrutz L 23 LF 361 320 30 72 14 1 4 36 26 56 1 7
Jacob Buchberger R 28 LF 404 371 43 79 11 2 6 35 30 104 7 3
Wade Stauss L 27 C 96 82 5 12 2 0 0 7 8 44 0 0
Brody Moore R 25 SS 400 369 42 80 12 1 2 29 22 94 9 3
Miguel Ugueto R 23 RF 251 240 23 54 10 1 2 20 6 48 6 4
R.J. Yeager R 27 1B 412 379 47 81 14 1 7 41 21 75 4 2
Johnfrank Salazar R 22 1B 302 278 25 57 12 0 2 25 17 53 7 1
Won-Bin Cho L 22 CF 418 376 41 79 14 1 4 34 32 129 12 4
Bryce Madron L 24 LF 207 176 21 26 5 0 1 12 26 62 1 4
Darlin Moquete R 26 LF 312 287 36 58 8 1 6 29 17 82 8 4
Josh Kross B 23 1B 420 387 42 73 15 2 10 44 22 129 0 1
Brayden Jobert L 25 1B 359 320 31 56 10 1 6 33 28 111 5 4

Batters – Advanced
Player PA BA OBP SLG OPS+ ISO BABIP Def WAR wOBA 3YOPS+ RC
Masyn Winn 597 .250 .306 .372 92 .123 .293 10 3.2 .298 95 66
JJ Wetherholt 523 .254 .338 .367 100 .113 .292 2 2.9 .314 101 60
Brendan Donovan 534 .273 .349 .402 113 .129 .301 -4 2.4 .330 109 68
Iván Herrera 464 .274 .362 .433 125 .159 .323 0 2.4 .348 124 65
Lars Nootbaar 539 .245 .340 .409 112 .164 .287 4 2.3 .328 109 67
Jimmy Crooks 455 .241 .300 .369 89 .128 .320 4 2.0 .293 91 46
Nolan Gorman 463 .223 .300 .419 101 .196 .291 1 1.9 .311 102 53
Alec Burleson 530 .274 .325 .436 114 .162 .291 -1 1.8 .330 112 70
Leonardo Bernal 468 .230 .290 .347 80 .117 .275 7 1.8 .281 85 45
Victor Scott II 514 .226 .300 .321 77 .095 .282 7 1.8 .278 82 53
Pedro Pagés 384 .225 .277 .359 79 .134 .286 7 1.6 .277 76 35
Thomas Saggese 546 .249 .301 .371 89 .122 .326 2 1.6 .294 91 59
José Fermín 349 .237 .335 .358 97 .121 .255 1 1.5 .310 95 40
Bryan Torres 460 .277 .361 .356 105 .079 .333 -8 1.4 .322 103 56
Joshua Baez 468 .234 .306 .383 94 .149 .320 5 1.4 .302 100 56
César Prieto 519 .259 .303 .367 89 .108 .296 -4 1.1 .294 88 58
Mike Antico 451 .231 .296 .337 79 .106 .309 8 0.9 .281 80 46
Nathan Church 493 .248 .305 .344 84 .096 .276 -1 0.9 .287 85 51
Jon Jon Gazdar 460 .240 .307 .283 69 .043 .275 2 0.7 .270 71 40
Matt Koperniak 511 .243 .299 .358 86 .115 .293 5 0.7 .289 86 53
Ramon Mendoza 374 .219 .297 .319 75 .100 .282 4 0.7 .277 79 32
Yohel Pozo 301 .262 .282 .407 93 .145 .274 -4 0.7 .296 89 33
Noah Mendlinger 458 .246 .330 .306 83 .060 .283 4 0.5 .289 82 43
Blaze Jordan 530 .243 .289 .370 86 .127 .261 4 0.3 .288 88 54
Deniel Ortiz 473 .216 .296 .344 81 .128 .304 3 0.2 .284 89 49
Carlos Linarez 157 .199 .244 .281 49 .082 .338 4 0.2 .233 53 11
Ryan Campos 406 .208 .286 .288 64 .080 .264 -1 0.2 .260 68 32
Sammy Hernandez 395 .196 .278 .256 53 .061 .254 3 0.1 .247 56 26
Chase Davis 482 .206 .286 .295 66 .089 .305 1 0.0 .262 69 38
Dakota Harris 453 .235 .275 .321 69 .086 .290 1 0.0 .262 72 41
Graysen Tarlow 190 .224 .307 .267 65 .043 .313 -1 0.0 .262 67 14
Jesus Baez 435 .219 .274 .341 73 .122 .250 -4 0.0 .271 78 40
Gavin Collins 270 .217 .280 .311 68 .094 .246 -3 -0.1 .262 65 22
Jordan Walker 530 .232 .296 .371 88 .139 .299 -6 -0.2 .293 91 56
Jose Cordoba 282 .215 .268 .308 63 .093 .271 3 -0.3 .256 69 24
Zach Levenson 441 .213 .293 .335 78 .122 .261 1 -0.3 .279 82 42
Travis Honeyman 352 .223 .310 .297 74 .074 .286 -6 -0.3 .276 75 30
Chase Adkison 172 .213 .298 .273 64 .060 .265 0 -0.4 .262 71 12
Jeremy Rivas 494 .198 .263 .267 51 .069 .273 2 -0.5 .239 56 37
Miguel Villarroel 350 .221 .256 .273 51 .052 .305 -1 -0.5 .236 55 27
Tre Richardson 340 .206 .271 .273 55 .067 .261 1 -0.5 .247 56 27
Andy Yerzy 215 .191 .265 .294 59 .103 .275 -5 -0.6 .251 57 16
Michael Curialle 327 .206 .273 .297 62 .091 .303 -3 -0.6 .255 63 25
Trey Paige 386 .203 .266 .289 58 .086 .302 7 -0.6 .249 60 29
Anyelo Encarnacion 423 .193 .264 .277 54 .084 .308 -3 -0.7 .245 60 31
Christian Martin 382 .206 .280 .262 55 .056 .266 -1 -0.7 .248 59 28
Ian Petrutz 361 .225 .304 .313 76 .088 .262 -2 -0.7 .279 77 34
Jacob Buchberger 404 .213 .275 .302 64 .089 .280 3 -0.7 .257 65 33
Wade Stauss 96 .146 .263 .171 27 .025 .316 -4 -0.7 .215 25 4
Brody Moore 400 .217 .265 .271 53 .054 .286 -3 -0.8 .241 55 30
Miguel Ugueto 251 .225 .247 .300 54 .075 .274 2 -0.9 .239 57 21
R.J. Yeager 412 .214 .265 .311 63 .097 .249 2 -1.1 .255 65 33
Johnfrank Salazar 302 .205 .262 .270 52 .065 .247 -1 -1.2 .240 55 21
Won-Bin Cho 418 .210 .278 .285 60 .075 .309 -8 -1.2 .253 64 34
Bryce Madron 207 .148 .263 .193 33 .045 .221 0 -1.3 .221 35 11
Darlin Moquete 312 .202 .252 .300 56 .098 .261 -2 -1.3 .243 61 25
Josh Kross 420 .189 .245 .315 58 .126 .254 2 -1.4 .245 66 30
Brayden Jobert 359 .175 .256 .269 50 .094 .246 2 -1.5 .239 54 25

Batters – Top Near-Age Offensive Comps
Player Hit Comp 1 Hit Comp 2 Hit Comp 3
Masyn Winn Bill Russell Rafael Ramirez Jimmy Rollins
JJ Wetherholt Mike Andrews Alan Trammell Larry Stroman
Brendan Donovan Ken Oberkfell Billy Goodman Ron Hunt
Iván Herrera John Kruk Dan Driessen Bruce Bochte
Lars Nootbaar Ron Roenicke Wes Parker Gerry Davis
Jimmy Crooks Bob Davis Andrew Knapp Tom Pagnozzi
Nolan Gorman Nick Esasky Russ Davis Shane Andrews
Alec Burleson Chad Tracy Randall Simon Walt Bond
Leonardo Bernal Matt Sinatro Ron Brand Dave Criscione
Victor Scott II Ben Copeland Ced Landrum Brad Coon
Pedro Pagés Tommy Smith Martín Maldonado Nelson Santovenia
Thomas Saggese Robby Thompson George Williams Frank Coggins
José Fermín David Eckstein Dick Howser Dan Monzon
Bryan Torres Quilvio Veras Jack Perconte Willie Randolph
Joshua Baez Jose Gonzalez Michael A. Taylor Lane Thomas
César Prieto Danny Sandoval Jerry Terrell Jose Iglesias
Mike Antico Tommy Murphy Demond Smith Mike Asche
Nathan Church Fred Krase Bobby Moore Leo Garcia
Jon Jon Gazdar Wilfredo Tovar Wladimir Sutil David Fletcher
Matt Koperniak Mitch Maier Bill Virdon Franklin Gutierrez
Ramon Mendoza Ronnie Farkas Fred Stanley Peter Peltz
Yohel Pozo Ray Serrano Bengie Molina Toby Hall
Noah Mendlinger Erik Komatsu Chas McCormick Bobby Darula
Blaze Jordan Luis Lopez Don Pepper Donald Cardoza
Deniel Ortiz Rickey Cradle Paul Rodgers Ray McDavid
Carlos Linarez Lindsey Johnson Cecil Strawn Brendon Ounjian
Ryan Campos Jason Fennell Mitch Canham Paul Hoover
Sammy Hernandez Thomas Newton Brett Kay Dick Harris
Chase Davis Tim Fedroff Cory Keylor Justin Toerner
Dakota Harris Alexis Infante Jose Garcia John Mason
Graysen Tarlow Larry Patterson Jose Umbria Bob Turzilli
Jesus Baez Lenny Faedo Robert Connolly Junior Moore
Gavin Collins Zane Chavez Darryl Kennedy Woody Huyke
Jordan Walker Kevin Belcher Ian Desmond Lane Adams
Jose Cordoba Shawon Dunston Ariel Soriano Donald Brown
Zach Levenson Billy Best Dave Hoyt Joe Panella
Travis Honeyman Robert Perry Rick Colzie Dan Robinson
Chase Adkison Mike Taylor Justin Ringo Terry Christman
Jeremy Rivas Kelby Tomlinson Lee Olmstead Christian Lara
Miguel Villarroel Tony Pena Jr. Deiner Lopez Luis Ugueto
Tre Richardson Lonnie Goldberg Reggie Nelson John Toven
Andy Yerzy Buddy Pryor Grant Fithian Ben Margalski
Michael Curialle Bryan Anderson Sean Murphy Damon Burkhart
Trey Paige Travis Whitmore Juan Rodriguez Nick Ward
Anyelo Encarnacion Dick Tracewski Kevin Flora Scarborough Green
Christian Martin Miles Mastrobuoni Mel Jackson Reggie Nelson
Ian Petrutz James White John Turner Charles Byrd
Jacob Buchberger Lloyd Turner Mike Daniel Tom Spitz
Wade Stauss John Beuerlein Ryan Bennett Dallas Tarleton
Brody Moore Dominic Ramos Pete Orr Nate Tebbs
Miguel Ugueto Ramon Jean Luis Landaeta Angelberth Montilla
R.J. Yeager Eddie Lara Craig MacKay Darryl Robinson
Johnfrank Salazar Roland Alburtis Miguel Castellanos Eddie Tisdale
Won-Bin Cho Ronald Dibelius Jason Denham Jeff Bonner
Bryce Madron Danny Payne Joseph Haney Corey Viltz
Darlin Moquete Jerry Simmons Darontaye Hollins Rick Angell
Josh Kross Rey Martinez Jim McManus Joe De Berry
Brayden Jobert Tyler Burnett Chris Carstensen Jalen Washington

Batters – 80th/20th Percentiles
Player 80th BA 80th OBP 80th SLG 80th OPS+ 80th WAR 20th BA 20th OBP 20th SLG 20th OPS+ 20th WAR
Masyn Winn .272 .331 .420 107 4.5 .228 .282 .337 73 1.9
JJ Wetherholt .281 .364 .410 120 4.2 .227 .313 .328 85 1.8
Brendan Donovan .299 .374 .442 129 3.5 .248 .324 .364 95 1.2
Iván Herrera .297 .389 .483 145 3.5 .241 .333 .390 106 1.3
Lars Nootbaar .268 .363 .459 130 3.5 .223 .317 .363 93 1.1
Jimmy Crooks .271 .328 .416 108 3.1 .213 .275 .327 72 1.1
Nolan Gorman .251 .328 .475 121 3.0 .195 .269 .360 78 0.4
Alec Burleson .303 .356 .488 134 3.2 .247 .297 .384 94 0.4
Leonardo Bernal .258 .316 .396 96 2.8 .203 .260 .306 59 0.5
Victor Scott II .250 .323 .358 92 2.9 .200 .274 .285 61 0.6
Pedro Pagés .255 .306 .401 98 2.5 .197 .250 .314 62 0.7
Thomas Saggese .275 .329 .419 108 2.9 .220 .275 .324 69 0.2
José Fermín .261 .364 .404 117 2.3 .212 .311 .311 79 0.6
Bryan Torres .304 .391 .398 125 2.6 .245 .333 .321 88 0.4
Joshua Baez .259 .329 .431 115 2.6 .206 .277 .347 79 0.4
César Prieto .285 .329 .410 107 2.4 .225 .274 .326 70 -0.2
Mike Antico .260 .325 .385 98 1.8 .204 .268 .291 59 -0.4
Nathan Church .276 .330 .383 102 2.0 .222 .281 .308 67 -0.3
Jon Jon Gazdar .266 .330 .316 84 1.6 .213 .282 .248 53 -0.3
Matt Koperniak .264 .325 .401 104 1.9 .213 .274 .315 68 -0.5
Ramon Mendoza .246 .322 .362 93 1.5 .191 .271 .279 57 -0.1
Yohel Pozo .293 .311 .459 113 1.5 .236 .256 .362 74 0.0
Noah Mendlinger .273 .356 .341 99 1.4 .219 .305 .270 66 -0.5
Blaze Jordan .271 .316 .416 105 1.6 .218 .262 .321 65 -1.1
Deniel Ortiz .248 .325 .397 103 1.5 .189 .269 .298 62 -1.0
Carlos Linarez .230 .276 .331 70 0.6 .168 .213 .232 28 -0.3
Ryan Campos .238 .315 .337 84 1.3 .175 .254 .246 42 -0.9
Sammy Hernandez .227 .305 .300 73 1.1 .164 .248 .220 36 -0.8
Chase Davis .235 .315 .335 83 1.1 .181 .263 .254 49 -1.0
Dakota Harris .260 .299 .358 86 1.0 .211 .248 .282 52 -1.1
Graysen Tarlow .260 .339 .307 85 0.4 .191 .274 .225 46 -0.5
Jesus Baez .247 .300 .392 93 1.1 .197 .250 .301 56 -0.9
Gavin Collins .256 .314 .361 91 0.7 .182 .244 .260 44 -0.9
Jordan Walker .256 .321 .415 105 0.9 .205 .270 .326 69 -1.6
Jose Cordoba .245 .294 .355 84 0.5 .189 .242 .267 46 -1.0
Zach Levenson .241 .320 .378 97 0.9 .183 .267 .287 59 -1.3
Travis Honeyman .249 .333 .334 90 0.4 .197 .284 .258 57 -1.1
Chase Adkison .241 .328 .310 82 0.0 .188 .272 .236 47 -0.8
Jeremy Rivas .223 .289 .303 67 0.4 .171 .241 .234 36 -1.4
Miguel Villarroel .248 .283 .310 67 0.3 .190 .228 .237 32 -1.3
Tre Richardson .238 .301 .317 76 0.4 .180 .243 .236 38 -1.2
Andy Yerzy .219 .297 .344 80 0.0 .161 .235 .253 39 -1.1
Michael Curialle .232 .299 .341 78 0.0 .178 .246 .257 42 -1.5
Trey Paige .232 .297 .327 77 0.4 .178 .239 .250 39 -1.5
Anyelo Encarnacion .218 .293 .313 71 0.3 .166 .240 .233 36 -1.6
Christian Martin .239 .310 .302 74 0.2 .183 .257 .229 42 -1.4
Ian Petrutz .249 .332 .351 93 0.2 .197 .278 .273 58 -1.4
Jacob Buchberger .241 .305 .349 84 0.3 .185 .248 .267 47 -1.6
Wade Stauss .184 .298 .219 50 -0.4 .118 .227 .134 8 -0.9
Brody Moore .244 .293 .302 70 0.1 .189 .238 .237 37 -1.6
Miguel Ugueto .258 .278 .346 76 -0.2 .194 .218 .258 35 -1.5
R.J. Yeager .242 .294 .359 82 -0.1 .189 .242 .273 46 -2.0
Johnfrank Salazar .236 .289 .310 69 -0.5 .180 .235 .231 35 -1.8
Won-Bin Cho .241 .309 .328 82 0.0 .183 .251 .244 44 -2.0
Bryce Madron .177 .290 .229 48 -0.9 .124 .236 .164 17 -1.7
Darlin Moquete .232 .284 .355 79 -0.4 .181 .228 .264 42 -2.0
Josh Kross .216 .277 .366 79 -0.3 .164 .224 .270 42 -2.3
Brayden Jobert .202 .283 .310 67 -0.7 .153 .228 .229 32 -2.3

Batters – Platoon Splits
Player BA vs. L OBP vs. L SLG vs. L BA vs. R OBP vs. R SLG vs. R
Masyn Winn .257 .319 .403 .246 .299 .356
JJ Wetherholt .241 .320 .346 .259 .346 .375
Brendan Donovan .259 .338 .353 .278 .354 .422
Iván Herrera .275 .373 .430 .273 .356 .435
Lars Nootbaar .235 .325 .364 .249 .346 .426
Jimmy Crooks .226 .291 .321 .246 .303 .385
Nolan Gorman .212 .282 .381 .227 .307 .434
Alec Burleson .259 .308 .381 .280 .332 .460
Leonardo Bernal .231 .288 .366 .229 .291 .338
Victor Scott II .218 .290 .290 .229 .304 .332
Pedro Pagés .234 .289 .379 .220 .271 .348
Thomas Saggese .250 .309 .388 .249 .297 .363
José Fermín .233 .333 .350 .240 .336 .362
Bryan Torres .267 .339 .333 .281 .369 .365
Joshua Baez .248 .322 .414 .228 .299 .368
César Prieto .250 .293 .357 .263 .307 .371
Mike Antico .222 .281 .333 .234 .302 .338
Nathan Church .246 .297 .322 .248 .307 .352
Jon Jon Gazdar .244 .313 .275 .238 .305 .287
Matt Koperniak .237 .297 .333 .246 .300 .368
Ramon Mendoza .219 .308 .316 .219 .292 .321
Yohel Pozo .270 .287 .414 .257 .280 .402
Noah Mendlinger .236 .320 .291 .249 .334 .311
Blaze Jordan .259 .308 .407 .237 .281 .357
Deniel Ortiz .221 .299 .359 .213 .294 .337
Carlos Linarez .204 .250 .286 .196 .240 .278
Ryan Campos .198 .270 .297 .212 .292 .284
Sammy Hernandez .211 .290 .284 .190 .273 .246
Chase Davis .194 .268 .274 .212 .294 .303
Dakota Harris .240 .283 .333 .233 .272 .315
Graysen Tarlow .226 .311 .245 .223 .305 .277
Jesus Baez .223 .286 .355 .217 .268 .335
Gavin Collins .232 .297 .305 .210 .271 .315
Jordan Walker .242 .311 .388 .227 .288 .363
Jose Cordoba .220 .273 .341 .213 .266 .292
Zach Levenson .220 .306 .339 .210 .287 .333
Travis Honeyman .229 .318 .323 .220 .306 .285
Chase Adkison .208 .291 .250 .216 .302 .284
Jeremy Rivas .200 .267 .273 .197 .261 .264
Miguel Villarroel .218 .255 .257 .223 .257 .279
Tre Richardson .208 .276 .292 .205 .268 .265
Andy Yerzy .185 .254 .262 .194 .271 .310
Michael Curialle .211 .280 .289 .204 .270 .301
Trey Paige .191 .260 .277 .207 .269 .293
Anyelo Encarnacion .197 .271 .299 .192 .261 .267
Christian Martin .191 .255 .225 .211 .288 .275
Ian Petrutz .218 .299 .287 .227 .307 .322
Jacob Buchberger .229 .299 .328 .204 .262 .288
Wade Stauss .125 .250 .167 .155 .269 .172
Brody Moore .221 .276 .283 .215 .260 .266
Miguel Ugueto .230 .256 .311 .223 .243 .295
R.J. Yeager .220 .273 .314 .211 .261 .310
Johnfrank Salazar .202 .260 .281 .206 .263 .265
Won-Bin Cho .206 .268 .275 .212 .281 .288
Bryce Madron .146 .255 .167 .148 .267 .203
Darlin Moquete .202 .259 .293 .202 .249 .303
Josh Kross .186 .238 .310 .190 .248 .318
Brayden Jobert .174 .258 .244 .175 .256 .278

Pitchers – Standard
Player T Age W L ERA G GS IP H ER HR BB SO
Michael McGreevy R 25 10 9 3.92 29 28 154.0 154 67 17 36 111
Matthew Liberatore L 26 8 9 4.10 31 24 131.7 127 60 15 41 111
Dustin May R 28 7 8 4.15 21 19 115.0 101 53 13 41 103
Andre Pallante R 27 8 9 4.30 32 24 136.0 137 65 13 52 96
Richard Fitts R 26 5 6 4.32 21 21 100.0 100 48 14 29 77
JoJo Romero L 29 6 3 3.41 61 0 58.0 50 22 5 23 57
Ixan Henderson L 24 6 8 4.50 23 22 110.0 110 55 14 45 86
Quinn Mathews L 25 5 6 4.37 24 24 101.0 93 49 12 54 99
Tekoah Roby R 24 5 6 4.20 17 17 79.3 78 37 11 22 68
Bruce Zimmermann L 31 6 8 4.53 24 18 113.3 127 57 16 28 76
Kyle Leahy R 29 4 4 4.03 50 5 87.0 83 39 9 31 75
Brycen Mautz L 24 5 7 4.64 24 24 104.7 106 54 15 37 86
Gordon Graceffo R 26 5 6 4.38 35 13 96.7 97 47 11 30 77
Pete Hansen L 25 5 7 4.69 23 23 119.0 129 62 18 36 83
Sem Robberse R 24 4 5 4.48 18 17 86.3 88 43 11 30 66
Tink Hence R 23 3 4 4.33 19 19 68.7 64 33 9 30 63
Aaron Wilkerson R 37 4 6 4.80 24 24 123.7 142 66 21 27 81
Hunter Dobbins R 26 4 4 4.58 16 15 78.7 82 40 10 25 54
Matt Svanson R 27 3 3 3.77 48 1 71.7 65 30 8 25 66
Miles Mikolas R 37 6 10 4.86 25 25 129.7 144 70 22 30 83
Zack Thompson L 28 4 5 4.56 24 13 73.0 69 37 9 37 71
Curtis Taylor R 30 5 6 4.81 27 19 103.0 105 55 15 40 79
Hancel Rincon R 24 5 6 4.79 20 18 97.7 104 52 15 30 68
Jared Shuster L 27 4 5 4.56 32 10 81.0 85 41 9 29 55
Scott Blewett R 30 3 4 4.39 32 7 65.7 68 32 8 24 47
Alex Cornwell L 27 4 5 4.74 28 12 87.3 95 46 11 31 56
Riley O’Brien R 31 2 2 3.88 51 0 55.7 47 24 5 26 59
Max Rajcic R 24 5 7 5.00 24 24 113.3 120 63 17 40 76
Austin Love R 27 4 5 4.52 34 6 63.7 63 32 8 28 54
Ian Bedell R 26 2 4 4.90 18 17 71.7 74 39 11 28 55
John King L 31 3 2 3.91 50 0 53.0 59 23 5 14 32
Nick Raquet L 30 6 6 4.26 35 2 57.0 57 27 7 19 46
Ryan Fernandez R 28 4 4 4.12 54 0 59.0 53 27 7 26 63
Matt Pushard R 28 4 4 4.17 44 1 54.0 52 25 7 20 47
Luis Gastelum R 24 4 3 4.02 41 0 56.0 52 25 7 18 56
Ryne Stanek R 34 4 4 4.13 54 0 48.0 44 22 5 24 48
Justin Bruihl L 29 3 3 4.26 48 0 50.7 49 24 6 19 45
Zach Plesac R 31 4 6 5.26 16 15 75.3 85 44 12 29 46
Ryan Murphy R 26 2 3 5.08 15 12 51.3 54 29 7 22 34
Andre Granillo R 26 3 4 4.40 43 0 57.3 53 28 8 26 56
Chris Roycroft R 29 4 4 4.48 49 0 62.3 62 31 6 29 50
Tyler Matzek L 35 1 0 4.70 24 0 23.0 23 12 3 12 20
Ricardo Velez R 27 3 5 4.78 32 1 52.7 54 28 7 22 39
Skylar Hales R 24 4 5 4.53 46 0 49.7 49 25 6 18 41
Gerson Moreno R 30 2 2 4.93 36 0 38.3 35 21 5 24 37
Randel Clemente R 24 2 3 4.80 36 0 45.0 40 24 5 31 45
Zack Weiss R 34 2 2 4.86 34 0 50.0 49 27 7 24 47
Andrew Marrero R 26 2 4 4.95 29 0 40.0 38 22 6 23 38
Hunter Hayes R 25 2 4 5.02 31 1 57.3 61 32 8 24 40
Michael Gomez R 29 2 3 5.08 30 1 44.3 44 25 5 23 32
Michael Watson L 24 2 4 4.97 38 0 54.3 51 30 7 28 50
Nathanael Heredia L 25 1 2 5.17 31 0 38.3 38 22 5 24 30
Tyler Bradt R 25 2 4 5.26 34 2 53.0 53 31 8 31 43
Leonardo Taveras R 27 2 4 5.40 31 2 46.7 47 28 7 30 40
Edwin Nunez R 24 3 5 5.75 32 5 51.7 52 33 8 32 38

Pitchers – Advanced
Player IP K/9 BB/9 HR/9 BB% K% BABIP ERA+ 3ERA+ FIP ERA- WAR
Michael McGreevy 154.0 6.5 2.1 1.0 5.6% 17.3% .288 105 106 3.92 95 2.2
Matthew Liberatore 131.7 7.6 2.8 1.0 7.3% 19.9% .290 100 102 4.03 100 1.6
Dustin May 115.0 8.1 3.2 1.0 8.5% 21.4% .273 99 100 4.17 101 1.3
Andre Pallante 136.0 6.4 3.4 0.9 8.7% 16.1% .292 95 97 4.23 105 1.3
Richard Fitts 100.0 6.9 2.6 1.3 6.8% 18.2% .286 95 98 4.43 105 1.0
JoJo Romero 58.0 8.8 3.6 0.8 9.3% 23.2% .285 120 119 3.61 83 0.9
Ixan Henderson 110.0 7.0 3.7 1.1 9.4% 17.9% .289 91 96 4.62 110 0.9
Quinn Mathews 101.0 8.8 4.8 1.1 12.0% 22.0% .291 94 98 4.50 106 0.9
Tekoah Roby 79.3 7.7 2.5 1.2 6.6% 20.3% .290 98 104 4.20 102 0.9
Bruce Zimmermann 113.3 6.0 2.2 1.3 5.7% 15.5% .303 91 89 4.48 110 0.8
Kyle Leahy 87.0 7.8 3.2 0.9 8.3% 20.1% .291 102 101 3.96 98 0.7
Brycen Mautz 104.7 7.4 3.2 1.3 8.2% 19.0% .293 88 93 4.64 114 0.7
Gordon Graceffo 96.7 7.2 2.8 1.0 7.2% 18.6% .295 94 97 4.07 106 0.7
Pete Hansen 119.0 6.3 2.7 1.4 7.0% 16.1% .295 87 91 4.77 115 0.7
Sem Robberse 86.3 6.9 3.1 1.1 8.0% 17.6% .293 91 97 4.47 110 0.7
Tink Hence 68.7 8.3 3.9 1.2 10.0% 21.0% .285 95 100 4.43 106 0.7
Aaron Wilkerson 123.7 5.9 2.0 1.5 5.1% 15.2% .302 85 80 4.76 118 0.6
Hunter Dobbins 78.7 6.2 2.9 1.1 7.3% 15.8% .290 90 93 4.55 112 0.6
Matt Svanson 71.7 8.3 3.1 1.0 8.3% 21.9% .284 109 110 4.07 92 0.5
Miles Mikolas 129.7 5.8 2.1 1.5 5.4% 15.0% .292 84 79 4.88 119 0.5
Zack Thompson 73.0 8.8 4.6 1.1 11.5% 22.0% .296 90 92 4.51 111 0.5
Curtis Taylor 103.0 6.9 3.5 1.3 8.9% 17.6% .288 85 85 4.92 117 0.4
Hancel Rincon 97.7 6.3 2.8 1.4 7.1% 16.0% .291 86 91 4.84 116 0.4
Jared Shuster 81.0 6.1 3.2 1.0 8.2% 15.5% .295 90 92 4.36 111 0.4
Scott Blewett 65.7 6.4 3.3 1.1 8.3% 16.3% .293 93 92 4.50 107 0.3
Alex Cornwell 87.3 5.8 3.2 1.1 8.0% 14.5% .297 86 88 4.69 116 0.3
Riley O’Brien 55.7 9.5 4.2 0.8 10.9% 24.7% .288 106 103 3.99 94 0.3
Max Rajcic 113.3 6.0 3.2 1.4 8.0% 15.3% .288 82 87 5.07 122 0.2
Austin Love 63.7 7.6 4.0 1.1 10.0% 19.2% .294 91 93 4.61 110 0.2
Ian Bedell 71.7 6.9 3.5 1.4 8.9% 17.5% .289 84 86 5.01 119 0.2
John King 53.0 5.4 2.4 0.8 6.1% 13.9% .305 105 102 4.03 95 0.2
Nick Raquet 57.0 7.3 3.0 1.1 7.7% 18.7% .292 96 94 4.36 104 0.2
Ryan Fernandez 59.0 9.6 4.0 1.1 10.3% 24.9% .295 100 101 3.94 100 0.2
Matt Pushard 54.0 7.8 3.3 1.2 8.5% 20.1% .288 98 100 4.33 102 0.2
Luis Gastelum 56.0 9.0 2.9 1.1 7.6% 23.7% .294 102 105 3.91 98 0.2
Ryne Stanek 48.0 9.0 4.5 0.9 11.3% 22.6% .295 99 92 4.08 101 0.1
Justin Bruihl 50.7 8.0 3.4 1.1 8.7% 20.6% .295 96 97 4.41 104 0.1
Zach Plesac 75.3 5.5 3.5 1.4 8.6% 13.6% .296 78 77 5.21 128 0.0
Ryan Murphy 51.3 6.0 3.9 1.2 9.6% 14.8% .288 81 83 5.13 124 0.0
Andre Granillo 57.3 8.8 4.1 1.3 10.3% 22.2% .287 93 98 4.44 107 0.0
Chris Roycroft 62.3 7.2 4.2 0.9 10.4% 18.0% .298 92 92 4.35 109 -0.1
Tyler Matzek 23.0 7.8 4.7 1.2 11.5% 19.2% .299 87 83 4.82 115 -0.1
Ricardo Velez 52.7 6.7 3.8 1.2 9.4% 16.7% .290 86 88 4.89 116 -0.2
Skylar Hales 49.7 7.4 3.3 1.1 8.4% 19.2% .293 90 96 4.41 111 -0.2
Gerson Moreno 38.3 8.7 5.6 1.2 13.6% 21.0% .286 83 82 5.12 120 -0.3
Randel Clemente 45.0 9.0 6.2 1.0 14.4% 20.9% .287 85 90 4.94 117 -0.3
Zack Weiss 50.0 8.5 4.3 1.3 10.8% 21.2% .298 84 80 4.66 119 -0.3
Andrew Marrero 40.0 8.6 5.2 1.4 12.5% 20.7% .288 83 85 5.24 121 -0.3
Hunter Hayes 57.3 6.3 3.8 1.3 9.4% 15.6% .293 82 86 5.05 123 -0.4
Michael Gomez 44.3 6.5 4.7 1.0 11.6% 16.1% .287 81 80 5.28 123 -0.4
Michael Watson 54.3 8.3 4.6 1.2 11.5% 20.5% .288 82 88 4.88 122 -0.4
Nathanael Heredia 38.3 7.0 5.6 1.2 13.5% 16.9% .287 79 83 5.56 126 -0.4
Tyler Bradt 53.0 7.3 5.3 1.4 12.8% 17.8% .287 78 82 5.48 128 -0.5
Leonardo Taveras 46.7 7.7 5.8 1.3 13.7% 18.3% .292 76 77 5.65 132 -0.5
Edwin Nunez 51.7 6.6 5.6 1.4 13.0% 15.4% .280 71 75 6.14 140 -0.6

Pitchers – Top Near-Age Comps
Player Pit Comp 1 Pit Comp 2 Pit Comp 3
Michael McGreevy Kendall Graveman Ariel Jurado Randy Dobnak
Matthew Liberatore Sean Manaea Sterling Hitchcock Bob Knepper
Dustin May Jeff Juden Diego Segui Jeff Hoffman
Andre Pallante Mike Pelfrey Wily Peralta Sal Romano
Richard Fitts Cody Anderson Luis Cessa Taylor Clarke
JoJo Romero Steve Kline John Franco Darold Knowles
Ixan Henderson Danny Christensen Bruce Zimmermann Eric Jokisch
Quinn Mathews Michael Kirkman Chris Hammond Rich Sauveur
Tekoah Roby Mitch Lukevics Connor Seabold J.D. Martin
Bruce Zimmermann Matt Tomshaw Adam Pettyjohn Scott Diamond
Kyle Leahy Buck Farmer Drew VerHagen Dave Swartzbaugh
Brycen Mautz Anthony Ward Wandy Rodriguez Mike Butler
Gordon Graceffo Seth Lugo Anthony Bass Robert Gsellman
Pete Hansen Cole Irvin Packy Naughton John Means
Sem Robberse Aaron Shafer Byron Ballard Mike Rowland
Tink Hence Mel Stottlemyre Dan Eskew Doug Mlicki
Aaron Wilkerson Doyle Alexander Carl Pavano Bartolo Colon
Hunter Dobbins Raul Alcantara Carlos Frias Luis Cessa
Matt Svanson Alex Colomé Edwin Moreno Tony Pena
Miles Mikolas Jeremy Guthrie Jeff Samardzija Jason Hammel
Zack Thompson Eude Brito Chet Nichols Wil Ledezma
Curtis Taylor Richard Dotson Chuck Dobson Joe Oeschger
Hancel Rincon Ryan Mottl Geraldo Padua Mike Wodnicki
Jared Shuster Dan Serafini James Hurst Ryan Dennick
Scott Blewett Roman Colon John Weiss Bo Schultz
Alex Cornwell Eric Hillman Matt Whitehouse Jason Mackintosh
Riley O’Brien Curt Leskanic Joe Kelly Joe Boever
Max Rajcic Matt Esparza Chase De Jong JT Brubaker
Austin Love R.J. Seidel Ty Kelley Shayne Bennett
Ian Bedell Jose Vargas Phil Regan Pat Leahy
John King Mike Paul Rusty Kilgo T.J. McFarland
Nick Raquet Dave Von Ohlen Blake McGinley Jon Switzer
Ryan Fernandez Doug Henry Scott Proctor Wayne Rosenthal
Matt Pushard Josh Martin Austin Brice Sendy Rleal
Luis Gastelum Marv Rockman Michael Dubee Diego Castillo
Ryne Stanek John Axford Fernando Rodney Doug Henry
Justin Bruihl Tim Kubinski Jorge Castillo Rudy Arias
Zach Plesac Dewon Brazelton Steve Sundra Sean O’Sullivan
Ryan Murphy Frank Frontino Ben Christensen John Parker
Andre Granillo Yoan López Pat Mahomes A.J. Achter
Chris Roycroft Andy Shibilo Victor Moreno Dwight Bernard
Tyler Matzek Andy Hassler Rich Sauveur Ray Searage
Ricardo Velez Andy Kimball Clay Condrey Jim Miner
Skylar Hales Roman Martinez Rolando Valdez Greg Belson
Gerson Moreno Dave Jolly Doug Bochtler Manny Delcarmen
Randel Clemente Garry Grafton Fred Lasher Clevelan Santeliz
Zack Weiss Domingo Jean Ken Ray Barry Manuel
Andrew Marrero Ryan Burr Trevor Hurley Steve Palazzolo
Hunter Hayes Bernard Belan Geoff Hartlieb Geoff Grenert
Michael Gomez Jake Robbins Dave Wainhouse Ryan Perry
Michael Watson Joel McKeon Mike Mohler Will Lamb
Nathanael Heredia Rendy Espina Curt Conley Daniel Gibson
Tyler Bradt Simon Mercedes Mark Ecker Danny Fitzpatrick
Leonardo Taveras James Thornton Brian Woods Vince Bongiovanni
Edwin Nunez Felix Cuello Mike Gunderson Torey Deshazier

Pitchers – Splits and Percentiles
Player BA vs. L OBP vs. L SLG vs. L BA vs. R OBP vs. R SLG vs. R 80th WAR 20th WAR 80th ERA 20th ERA
Michael McGreevy .276 .332 .455 .235 .265 .351 3.1 1.3 3.47 4.44
Matthew Liberatore .234 .291 .317 .253 .315 .429 2.3 0.6 3.63 4.70
Dustin May .244 .339 .404 .225 .288 .358 2.0 0.4 3.66 4.79
Andre Pallante .245 .309 .365 .265 .336 .415 2.1 0.4 3.87 4.84
Richard Fitts .257 .317 .419 .253 .306 .427 1.7 0.4 3.78 4.86
JoJo Romero .205 .280 .274 .240 .317 .390 1.5 0.1 2.67 4.33
Ixan Henderson .262 .333 .407 .249 .326 .412 1.6 0.3 4.03 4.96
Quinn Mathews .234 .333 .369 .239 .336 .396 1.7 0.1 3.82 5.02
Tekoah Roby .243 .302 .412 .257 .307 .429 1.5 0.3 3.67 4.97
Bruce Zimmermann .266 .298 .413 .279 .327 .464 1.5 0.1 4.00 5.07
Kyle Leahy .238 .315 .381 .251 .310 .393 1.3 -0.1 3.52 4.80
Brycen Mautz .236 .307 .341 .265 .333 .464 1.3 0.0 4.18 5.23
Gordon Graceffo .257 .321 .411 .250 .301 .394 1.3 0.1 3.86 5.00
Pete Hansen .272 .315 .464 .267 .328 .441 1.2 -0.2 4.27 5.29
Sem Robberse .253 .339 .430 .259 .305 .405 1.2 0.2 4.04 4.99
Tink Hence .241 .326 .405 .240 .315 .393 1.2 0.1 3.84 4.97
Aaron Wilkerson .290 .335 .493 .274 .303 .460 1.3 -0.3 4.32 5.52
Hunter Dobbins .283 .341 .434 .242 .303 .416 1.0 0.1 4.12 5.10
Matt Svanson .243 .331 .405 .233 .300 .362 1.0 -0.1 3.22 4.57
Miles Mikolas .282 .329 .485 .270 .308 .459 1.1 -0.4 4.42 5.54
Zack Thompson .238 .330 .345 .245 .339 .415 1.0 -0.2 4.00 5.28
Curtis Taylor .265 .343 .486 .254 .329 .393 1.1 -0.3 4.29 5.40
Hancel Rincon .262 .324 .452 .269 .324 .439 1.0 -0.2 4.29 5.37
Jared Shuster .280 .336 .440 .256 .317 .399 0.9 -0.2 4.01 5.23
Scott Blewett .268 .338 .433 .254 .313 .396 0.7 -0.1 3.89 5.04
Alex Cornwell .260 .316 .375 .273 .337 .454 0.8 -0.3 4.32 5.32
Riley O’Brien .220 .327 .330 .227 .326 .361 0.9 -0.3 3.12 4.82
Max Rajcic .262 .341 .455 .269 .331 .442 0.9 -0.4 4.53 5.49
Austin Love .293 .371 .457 .216 .303 .366 0.7 -0.2 3.98 5.08
Ian Bedell .260 .338 .450 .261 .333 .438 0.6 -0.3 4.38 5.48
John King .234 .277 .312 .291 .336 .454 0.5 -0.2 3.45 4.48
Nick Raquet .253 .321 .373 .252 .317 .424 0.7 -0.3 3.58 4.93
Ryan Fernandez .232 .321 .411 .233 .304 .361 0.7 -0.5 3.41 4.96
Matt Pushard .247 .315 .351 .250 .320 .455 0.6 -0.3 3.57 4.98
Luis Gastelum .243 .301 .398 .231 .300 .376 0.7 -0.4 3.32 4.95
Ryne Stanek .247 .337 .358 .229 .317 .390 0.5 -0.5 3.44 5.16
Justin Bruihl .221 .307 .286 .267 .346 .475 0.5 -0.4 3.54 4.98
Zach Plesac .275 .346 .458 .280 .333 .476 0.4 -0.5 4.75 5.79
Ryan Murphy .250 .345 .390 .276 .342 .467 0.3 -0.3 4.71 5.65
Andre Granillo .266 .364 .468 .222 .288 .365 0.5 -0.5 3.68 5.17
Chris Roycroft .270 .364 .414 .235 .309 .360 0.3 -0.6 3.91 5.12
Tyler Matzek .214 .290 .357 .274 .370 .435 0.2 -0.3 3.75 6.12
Ricardo Velez .286 .366 .490 .234 .312 .360 0.1 -0.6 4.24 5.43
Skylar Hales .247 .327 .393 .250 .317 .407 0.2 -0.5 3.91 5.16
Gerson Moreno .262 .400 .415 .222 .326 .395 0.1 -0.7 4.19 6.16
Randel Clemente .225 .367 .413 .237 .351 .344 0.1 -0.7 4.16 5.47
Zack Weiss .270 .363 .472 .234 .314 .374 0.1 -0.8 4.09 5.83
Andrew Marrero .258 .388 .455 .233 .327 .400 0.0 -0.7 4.31 5.81
Hunter Hayes .268 .357 .454 .263 .331 .421 0.0 -0.7 4.45 5.50
Michael Gomez .263 .378 .474 .250 .360 .354 0.0 -0.8 4.33 5.81
Michael Watson .242 .333 .387 .243 .351 .412 0.0 -0.9 4.27 5.77
Nathanael Heredia .250 .368 .354 .255 .374 .451 -0.1 -0.8 4.60 6.01
Tyler Bradt .261 .367 .467 .248 .350 .402 -0.1 -0.8 4.66 5.90
Leonardo Taveras .286 .412 .464 .230 .339 .410 -0.1 -0.9 4.80 6.24
Edwin Nunez .279 .406 .512 .241 .364 .388 -0.3 -1.0 5.27 6.36

Players are listed with their most recent teams wherever possible. This includes players who are unsigned or have retired, players who will miss 2026 due to injury, and players who were released in 2025. So yes, if you see Joe Schmoe, who quit baseball back in August to form a Ambient Math-Rock Trip-Hop Yacht Metal band that only performs in abandoned malls, he’s still listed here intentionally. ZiPS is assuming a league with an ERA of 4.16.

Hitters are ranked by zWAR, which is to say, WAR values as calculated by me, Dan Szymborski, whose surname is spelled with a z. WAR values might differ slightly from those that appear in the full release of ZiPS. Finally, I will advise anyone against — and might karate chop anyone guilty of — merely adding up WAR totals on a depth chart to produce projected team WAR. It is important to remember that ZiPS is agnostic about playing time, and has no information about, for example, how quickly a team will call up a prospect or what veteran has fallen into disfavor.

As always, incorrect projections are either caused by misinformation, a non-pragmatic reality, or by the skillful sabotage of our friend and former editor. You can, however, still get mad at me on Twitter or on Bluesky. This last is, however, not an actual requirement.


More for Gore: Rangers Snag Top-Line Starter in Bulk Deal

Brad Mills-Imagn Images

When the market is hot, it seems like it’ll never cool down. Forget the fact that we’re late into free agency and yet too early in the year for contract extensions. The last few marquee free agents to sign are starting to do so – hi, Cody – and that seems to have opened the floodgates for a series of trades. You’ve heard about all the noise the Mets have gotten up to, no doubt. They aren’t the only ones. The Rangers have jumped in on the action in a big way. On Thursday, they acquired MacKenzie Gore from the Nationals in exchange for prospects Gavin Fien, Devin Fitz-Gerald, Alejandro Rosario, Abimelec Ortiz, and Yeremy Cabrera, as Jon Heyman of the New York Post first reported.

In some ways, this trade has been a long time coming. Gore has been on the trade block for most of his major league career. First, he got sent from San Diego to Washington in the first Juan Soto trade. Almost immediately upon his arrival in the nation’s capital, however, he turned into a trade chip. The Nats were pretty obviously far away from competing, and Gore is the kind of arm that lots of teams dream about placing at the top of their rotation.

By 2024, Gore’s third year in the big leagues, the trade rumors were at full volume. Gore exploded out of the gate, with 98 strikeouts over 80 innings in his first 15 starts. He was a deadline target for many teams – but he slumped hard down the stretch, with a 4.48 ERA and 4.16 FIP the rest of the way, and no trade ever came to fruition. The Nats looked around that winter, didn’t move him, and then again held on after Gore came out of the gates hot, making his first All-Star appearance on the back of a 3.02 ERA (2.96 FIP) in the first half. He stayed put at the deadline – and once again slumped hard down the stretch.

That brings us to the present. Trading Gore always made sense, and the new Nationals front office finally did it. He still has two years of team control remaining, and the price for controllable starters has never been higher. His service time status lines up very well with the situation in Arlington. The Rangers have a roster that is built to contend now. Their lineup has five different hitters in their 30s (baseball-age wise, Jake Burger doesn’t celebrate his 30th until April), and only two who are 25 or younger. The rotation is led by Jacob deGrom and Nathan Eovaldi, two heroes of the 2010s who are in the twilight of their respective careers. Read the rest of this entry »


Take Peralta: Brewers and Mets Trade Top Prospects for No. 1 Starter

Benny Sieu-Imagn Images

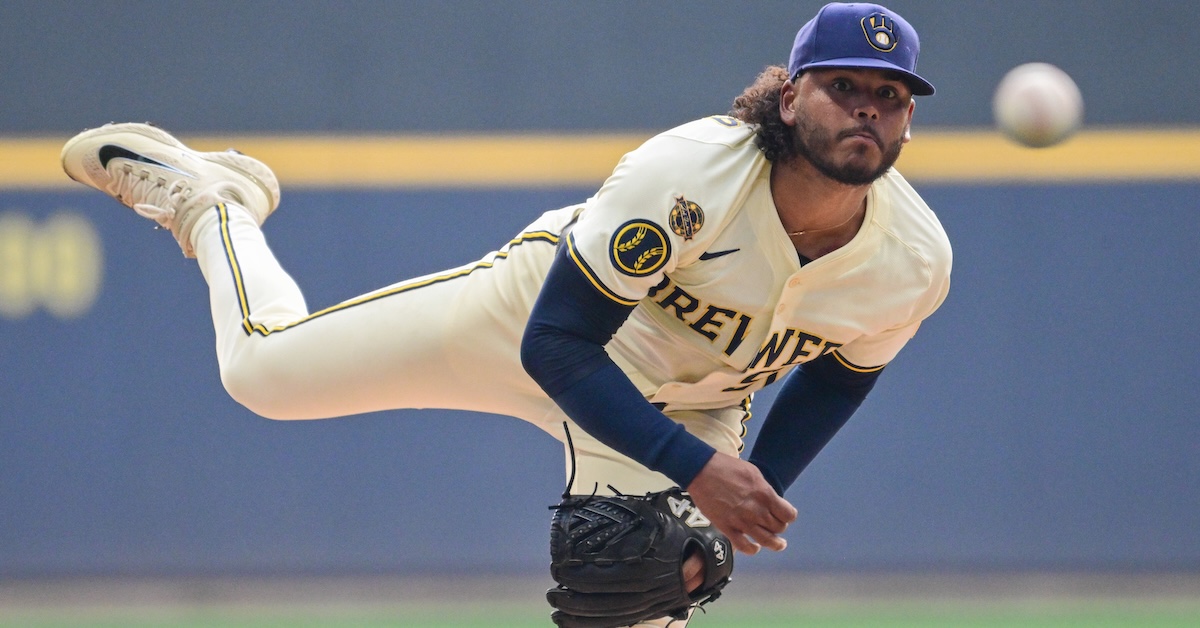
This one may be a little too one the nose. On Wednesday evening, the Brewers and Mets agreed to a trade that sent Freddy Peralta and Tobias Myers to the Mets in exchange for two top 100 prospects, Jett Williams and Brandon Sproat. That’s right, the Brewers got cheaper and younger by selling their best pitcher for prospects, the Mets flexed their financial muscle, and president of baseball operations David Stearns acquired Freddy Peralta. Welcome to every single day.

Peralta may not be your idea of a surefire ace, but he was the unquestioned leader of the Brewers rotation, their Game 1 starter in the playoffs for each of the past two years. As salary dumps go, this one is particularly depressing. Peralta is due just $8 million in his walk year, a hair more than the Angels will be paying Anthony Rendon to clear out of Anaheim as soon as possible, if you please. For Myers and the wildly underpaid Peralta, the Mets surrendered the prospects who ranked 31st and 63rd overall in our Top 100 update back in July. The Brewers did what they do, avoiding expenditures of any kind, finding young players, and trusting that they can keep creating aces out of whole cloth. Meanwhile, the Mets have increased their CBT tax hit from preposterously large to ludicrously large in order to reinforce a rotation that still ranks just 15th on our Depth Charts.

Brendan Gawlowski wrote about Sproat and Williams in a separate article, so our focus here is on the major league side of things, and we’ll start with the headliner. In February 2020, right before the world started exploding, Peralta signed a five-year, $15.5 million extension with two club options that could push the total to $30 million. He was, at that point, a 23-year-old with a career 4.79 ERA and 3.96 FIP and more relief appearances than starts. “We are happy to announce that we have reached a multi-year extension with Freddy that can keep him in a Brewers uniform for the better part of this decade,” said Stearns, then Milwaukee’s president of baseball operations. That prediction came true by the slimmest of margins.

Peralta pitched in relief in 2020, running a 3.99 ERA and an encouraging 2.41 FIP. He broke out in 2021. Over the past five seasons, Peralta has put up 14.8 WAR and gone 54-34 with a 3.30 ERA and 3.65 FIP. Despite dealing with shoulder injuries earlier in his career, he’s pitched at least 165 innings in each of the last three seasons. He anchored the rotation in 2024 when Corbin Burnes got traded and Brandon Woodruff got hurt. By my count, the Brewers extracted roughly two-thirds of a win for each million they paid Peralta. At that rate for their entire roster, the Dodgers would expect to win 208 games this season.

Peralta’s $8 million salary was the fourth-highest on the Brewers, but it will now slot in as the 14th-highest on the Mets. The galling part isn’t just that the Brewers couldn’t swallow the $8 million this year. Trading him means there wasn’t even a thought that they might be able to extend him, or at least that they might be able use a really good pitcher in 2026 and then just deal with losing him in 2027. After all, this is a team that just finished with the best record in baseball and made it to the NLCS. No matter. Milwaukee is taking the cash and the prospects and betting that Woodruff will finally get healthy (and that his alarming drop in velocity isn’t a portent of bad things to come).

After this year (and just in time for a possible work stoppage), Peralta will be entering his age-31 season and finally have the chance to make what he is worth on the open market, unless the Mets lock him up to another extension. This certainly seems like the kind of trade that ends up that way, especially when you consider that Stearns must like Peralta an awful lot, given that he has now traded for him twice and extended him once. Peralta won’t turn 30 until early June, and he just put up the highest fastball velocity of his career. Sproat was our top-ranked prospect on Eric Longenhagen’s updated Mets list from last June, and Williams came in at sixth. In his piece on the Brewers’ return, Brendan wrote that both players “are near-ready, 50-FV contributors and slot into Milwaukee’s farm system as the club’s third- and fourth-best prospects, respectively. Sproat projects as a mid-rotation starter, while Williams is a middle-of-the-diamond player with an as-yet undetermined defensive home.” That’s a serious haul. Keeping Peralta for a while would certainly take some of the sting out of losing them.

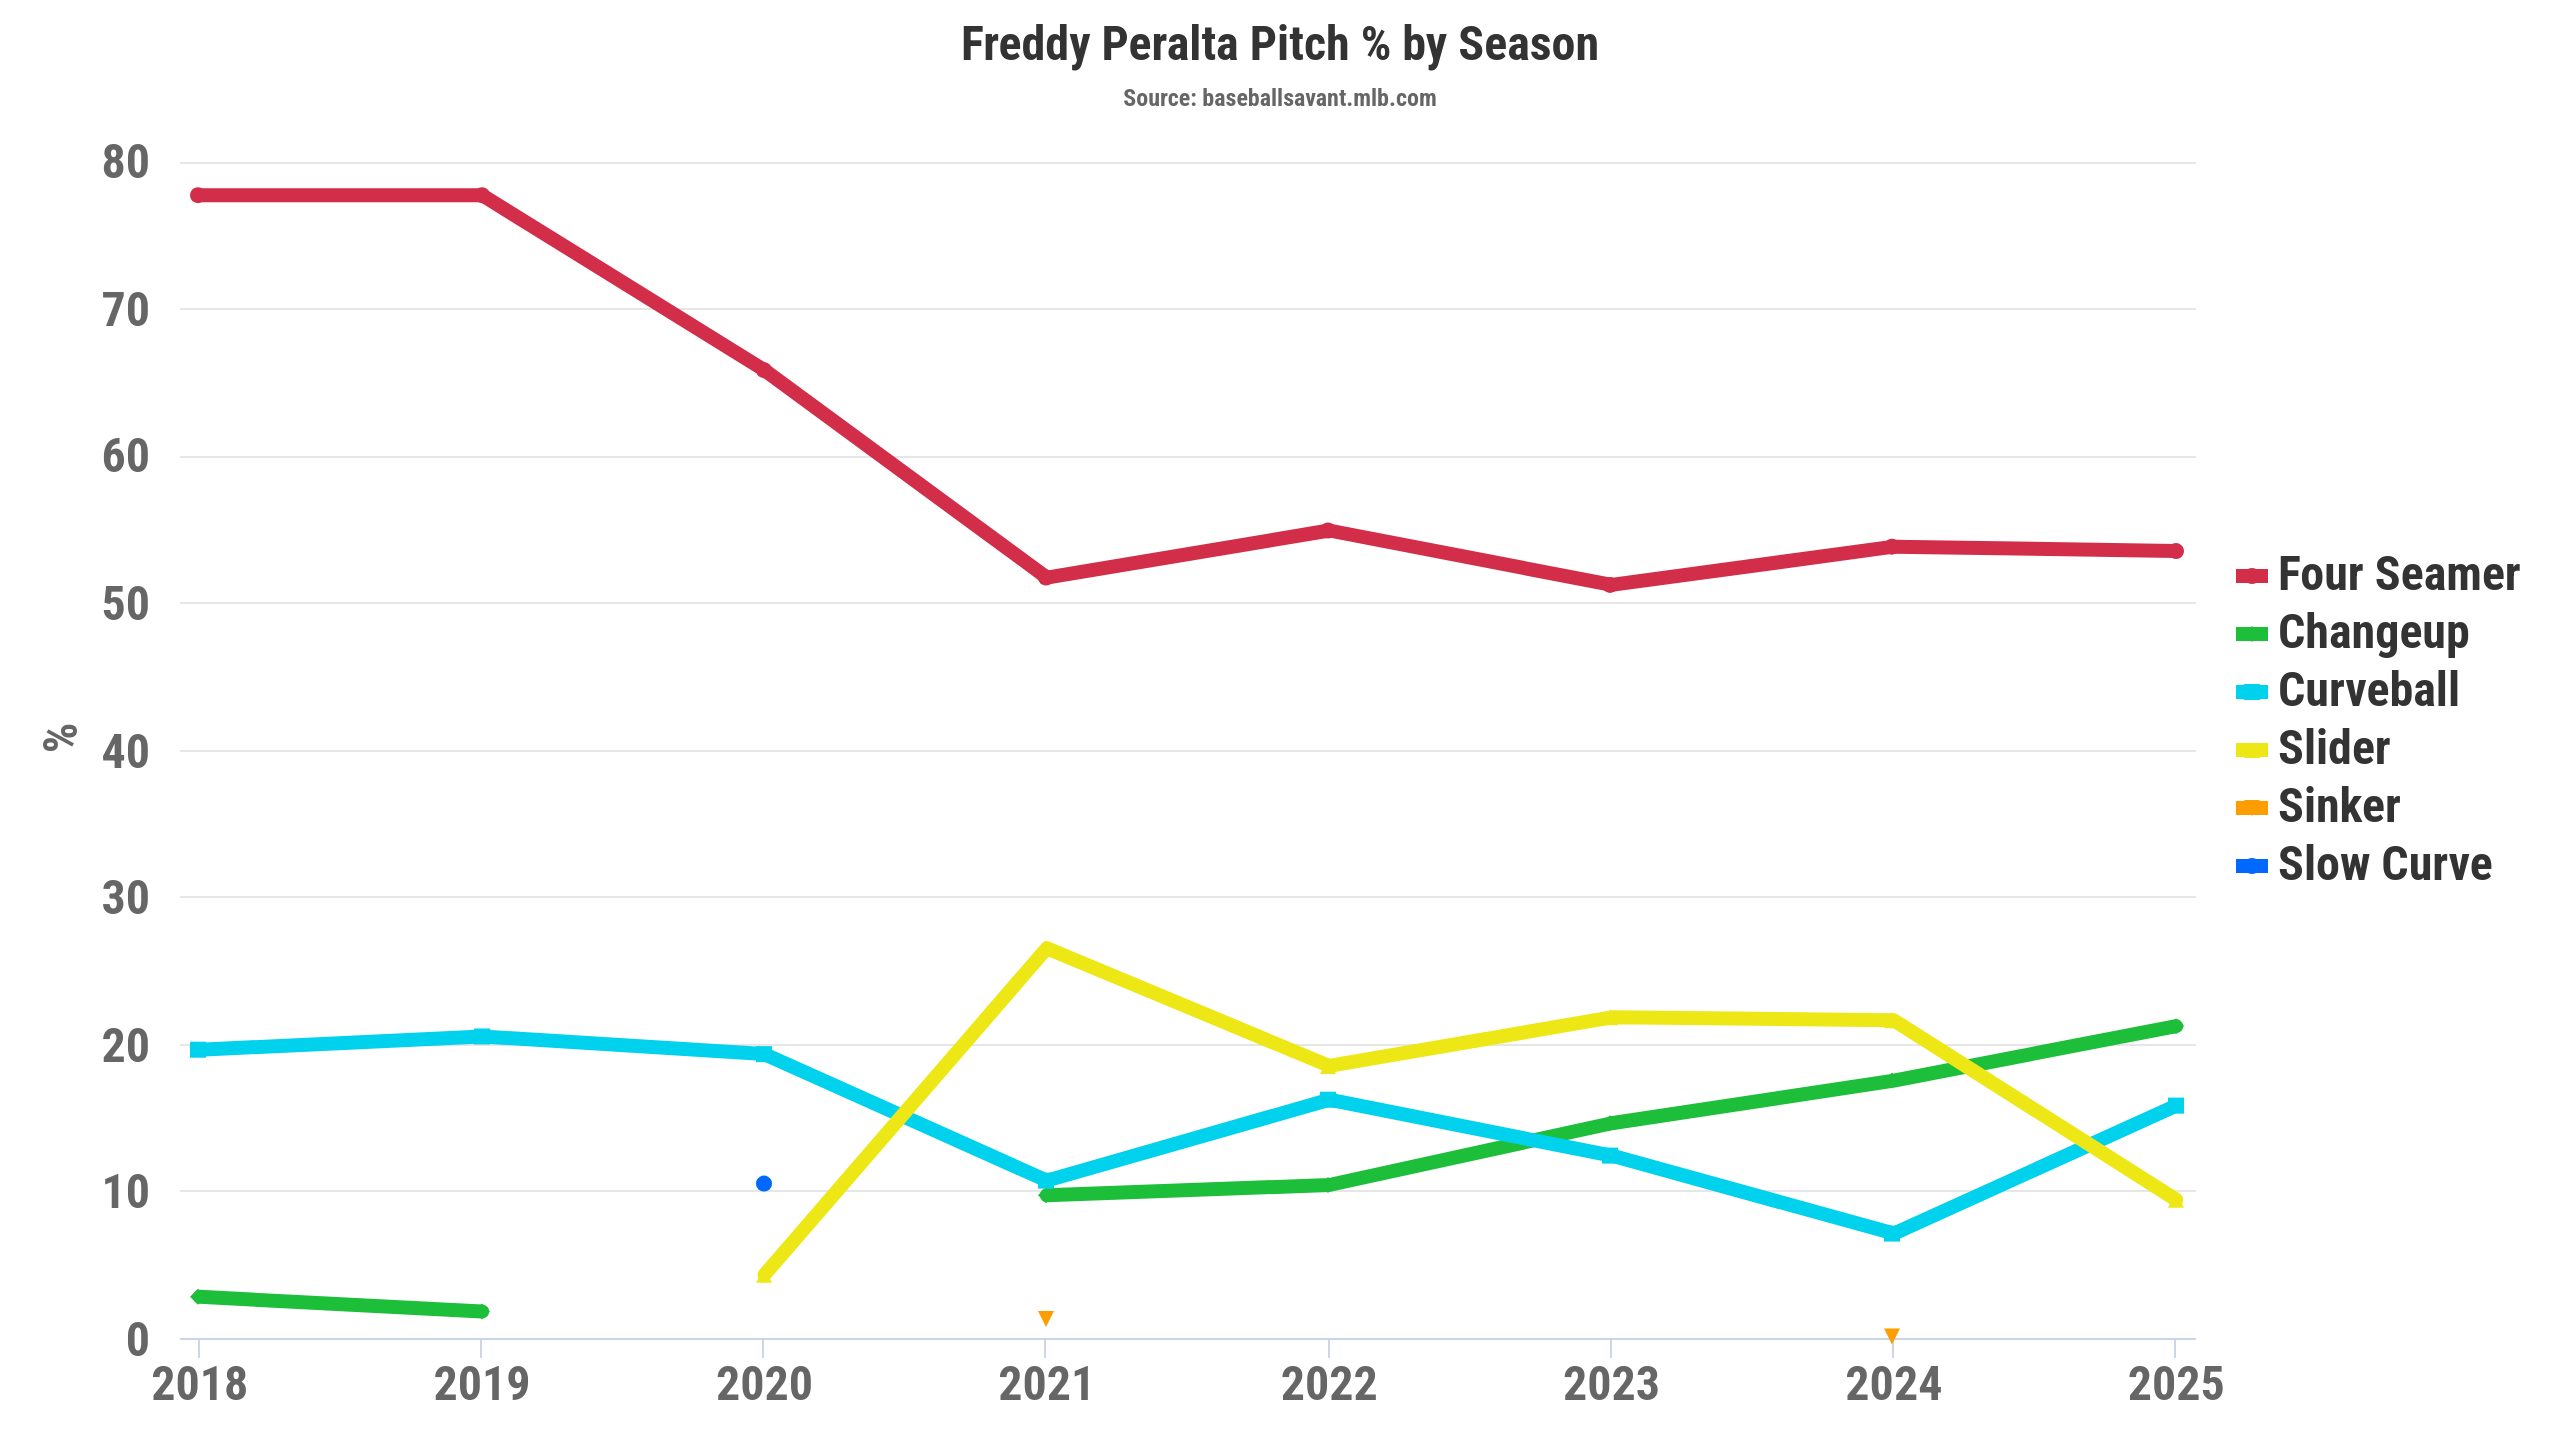
Peralta throws a four-pitch mix: four-seamer, changeup, curveball, and slider. He leads with the four-seamer, throwing it just over half the time to both righties and lefties. As Lance Brozdowski noted in his write-up of the trade, it’s a weird pitch (complimentary). It comes from a low release point not because of a low arm angle, but because he’s only six feet tall and he has a huge stride that brings him a long way down the mound. That huge stride also means huge extension. So even though Peralta’s 94.8 mph velocity put him in just the 57th percentile (among pitchers who threw at least 100 four-seamers in 2025), his 95.2 mph perceived velocity put him in the 74th percentile. A flat fastball with above-average velocity is a great combination, but it’s worth noting that Peralta really needs every bit of his stuff.

He hit the strike zone just 45% of the time in 2025, the lowest rate among all qualified pitchers. He ran the third-lowest mark in 2024 and the 13th lowest in 2023. Over the past five years, among pitchers who have thrown at least 2,000 pitches, his 46% zone rate puts him in the ninth percentile. That’s great if you can get away with it, as pitches over the plate are the ones that get hit. Peralta gives up too many walks, but he runs average chase rates and superlative whiff rates, allowing him to offset all those walks with tons of strikeouts and lots of weak contact. It’s a cocktail that some advanced ERA estimators, like DRA, absolutely abhor, but he’s got a long track record of success with it.

If and when Peralta’s stuff stops fooling batters, though, this trick could fall apart in a hurry. If he can’t induce chases, he’ll have to come into the zone. Once he’s in the zone, he’s probably going to allow more hard contact, and if he’s not inducing chases, he’s probably not going to induce as many whiffs either. That’s not to say that he couldn’t learn a new approach, and the good news is that this potentially swift decline doesn’t seem imminent. As you know, his four-seamer averaged 94.8 mph in 2025 (and played even faster), but his fastball velocity has actually been trending up over the past few seasons. It performed well even in 2022, when it averaged just 92.9 mph. That’s a reassuringly large margin for error. On the other hand, the inefficiency of his approach means that he throws tons of pitches; 8,991 over the past three years, to be exact. That’s the fifth most in the game, and it’s fair to wonder whether he might one day, you know, get tired.

Peralta halved his slider usage in 2025, throwing it just under 10% of the time. He didn’t really throw it to lefties at all, and against righties, he threw all three of his non-fastballs roughly 16% of the time.

Brozdowski posited that Peralta lost feel for his slider, noting its inconsistent amount of horizontal break. It has shifted so much that in some years, some pitch classifications split it up into a slider and a sweeper. Regardless, Stuff+ and StuffPro both regard the pitch as Peralta’s best, and Brozdowski hypothesized that the Mets will try to help him figure it out and return it to its place of prominence. Even if he doesn’t find another gear, he still slides in as the top pitcher in a Mets rotation that completely fell apart in the second half in 2025, and projects as average in 2026. That’s not to say it’s without upside.

The Mets have several starters whose names any baseball fan will know. It starts with Nolan McLean and Jonah Tong, who made their debuts in 2025. McLean looks ready to contribute right away in 2026. Kodai Senga has a career 3.00 ERA and 3.82 FIP in MLB. After a shoulder capsule strain and a calf strain cost him nearly the entire 2024 season, his velocity dropped and his strikeout rate cratered last year, when he also dealt with a hamstring strain. As a result, the projections peg him for an ERA that’s dangerously close to 4.00. But if he finds his old form, he’s a star.

In his first season as a starter, Clay Holmes posted a solid 3.53 ERA, but his 4.11 FIP told a different tale, and the peripherals were scary. The velocity of his sinker, his most-used pitch, fell by 2.9 mph as he transitioned from high-leverage reliever to starter. His strikeout rate, which had averaged nearly 25% to that point in his career, dropped to 18%. Holmes is entering his age-33 season, and it’s hard to know how much improvement to expect from him with one year of starting experience under his belt.

Despite underperforming his peripherals in a major way in 2024, David Peterson seems solid as ever, and he’ll make $100,000 more than Peralta in his final year of arbitration. An oblique strain blew up Sean Manaea’s 2025 season, limiting him to 12 ugly starts, but he’s just one year removed from a 2024 season in which he earned a Cy Young vote. That’s six names and nearly as many question marks, but this rotation certainly isn’t devoid of talent. It’s not hard to envision this staff being good, and it’s not hard to envision it being quite bad. If nothing else, Peralta adds some much-needed stability.

Tobias Myers is 27, and across his two big league seasons, he has made 31 starts and 18 relief appearances, putting up a 3.55 ERA and 3.92 FIP. An early-season oblique strain cost Myers some time in 2025, and he got sent down after a rough start. However, he came back up in a relief role in July, and over the last three months of the season, he posted a 2.64 ERA and 3.49 FIP. With a 93.5 mph fastball, his stuff grades out as roughly average, and he doesn’t strike out many batters. He also had the odd distinction of tying for the splitter that had the most induced vertical rise in baseball at 10.5 inches.

Myers throws six pitches: a four-seamer, cutter, slider, splitter, changeup, and curveball. When you look at his extremely steep 61-degree arm angle and the huge rise on his four-seamer, you start to wonder why he doesn’t embrace this North-South profile and throw his curveball much more often. He was blocked in Milwaukee, and if all goes to plan, he’s likely to be blocked in New York too, and maybe he’s shown all that he has to offer. Still, though it might not be the smartest thing in the world to assume that some other team is going to do a better job of developing a pitcher than the Brewers, it’s fair to say that Myers doesn’t seem like a finished product.

The Mets spent the beginning of the offseason upgrading their bullpen and replacing Pete Alonso. Over the past several days, they’ve reminded everyone just how much of a juggernaut they really are. What’s $8 million (and the resultant $8.8 million luxury tax hit) to a team that just snatched Bo Bichette away from the Phillies for (in theory) three years and $126 million? It’s entirely possible that the Brewers will turn Sproat into their latest ace, and that in a year or two he’ll start a playoff game against the Mets, just like Peralta did in 2024. But the Mets are trying to win this season, and now that he’s not in Milwaukee, David Stearns has the luxury of leaving tomorrow’s problems for tomorrow.


2026 ZiPS Projections: New York Mets

For the 22nd consecutive season, the ZiPS projection system is unleashing a full set of prognostications. For more information on the ZiPS projections, please consult this year’s introduction, as well as MLB’s glossary entry. The team order is selected by lot, and the penultimate team is the New York Mets.

Batters

The Mets are a bit like an intellectual character in a 19th Century Russian novel. They’re well-read enough to understand why life just isn’t working, and while they make changes every winter, it always seems to come with the precognition that something will go horribly wrong, and there’s little recourse but to observe their own downfall. Yankees fandom is more transactional, and depending on how the season turns out, you either cheer the empire or curse Brian Cashman. Rooting for the Mets is existential; you go into every season with hope, but an unquenchable feeling that something will go horribly or maybe even comically wrong. Meaning as a Mets fan does not come from celebrating the team’s achievements, but the act of enduring and returning, year after year, with the knowledge that preparation offers no escape. Mets fans essentially become annotators of doomed worlds.

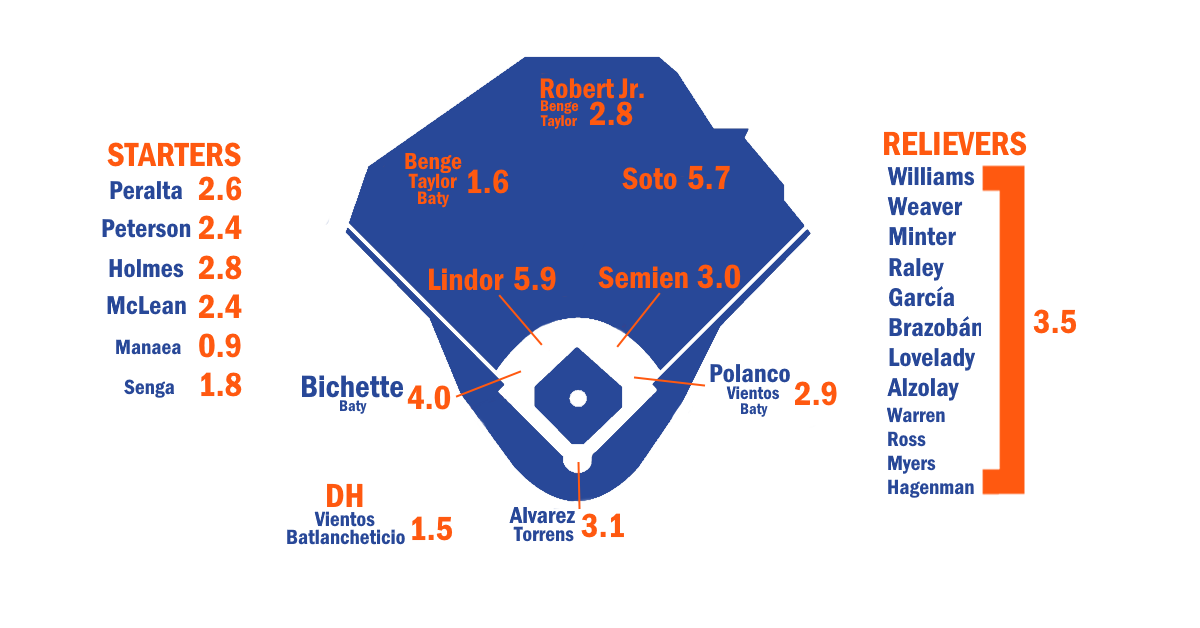
If every moment of Mets triumph is matched with an equal measure of Mets tragedy, the lineup may be in for some dark times when the worm turns. I actually think I’d rather have Pete Alonso for his deal than Jorge Polanco for his if I were the Mets, but the projections suggest that I might be wrong. Either way, this lineup looks extremely solid as a whole. Starting with two players, Juan Soto and Francisco Lindor make up for a lot of sins. But there aren’t really a lot of sins in the lineup. ZiPS thinks Bo Bichette is more valuable at third base than he was at shortstop, and he certainly has All-Star potential. ZiPS also forecasts decent bounce-back seasons for offseason trade acquisitions Luis Robert Jr. and Marcus Semien. Francisco Alvarez is coming off a near .800 OPS season, and under the new rules encouraging stolen bases, Luis Torrens’ value has increased because of his ability at preventing them, making him more than capable at holding up the lighter end of a catching tandem.

The DH situation isn’t amazing, with Mark Vientos getting the bulk of the plate appearances there, but only a few teams really get a ton of WAR from that spot anyway. Carson Benge certainly has upside, and while it’s not a particularly exciting projection, it’s not a bad forecast for a guy who hasn’t hit Triple-A pitchers yet. Brett Baty showed in 2025 that he can hit well enough to provide solid depth for the Mets. Jett Williams was also good depth in the infield, but he didn’t have a clear path to actual playing time in the majors in 2026 outside of a reserve role, so the Mets sent him to Milwaukee on Wednesday night as part of a trade to the get right-handed pitchers Freddy Peralta and Tobias Myers.

Pitchers

ZiPS expects the Mets’ pitching to be pretty good, giving the staff a bit of a bump from last year’s preseason projections. And that was before the trade for Peralta, who was the Brewers’ the most valuable pitcher. While Peralta’s not really a sub-three ERA guy — ZiPS thinks he’s legitimate a low-BABIP pitcher, but .243 is damned hard to maintain — he’s still an excellent pitcher who is a huge addition to New York’s rotation. Clay Holmes isn’t an ace, and he bled a couple strikeouts when he transitioned from the bullpen to the rotation, but his 2025 also demonstrates that his conversion to starting wasn’t just a mad scientist’s latest crazy plan. Nolan McLean looks like a much stronger bet going into 2026 than he did at this time last year, and while Jonah Tong didn’t have instant success in the majors, he also greatly boosted his stock, though we may not see a lot of it in the majors in 2026 unless the team is hit by injuries. Last year, David Peterson didn’t match his 2.90 ERA from 2024, but that never should have been the expectation anyway, and he’s a fairly dependable no. 2 starter type. Kodai Senga’s return went generally well, aside from nobody checking how the ghost fork graphic at the stadium would interact with a strikeout tally.

Sean Manaea ought to get back to effectively eating innings in 2026, and though he’s certainly not the headliner, the acquired Myers is a reasonable option to have in reserve. ZiPS is less excited once we get past Myers, to guys like Christian Scott and Cooper Criswell. But on the plus side, ZiPS thinks there’s a real chance that Jonathan Pintaro’s command will improve just enough for him to have a breakout in 2026.

ZiPS views the Mets as having an above-average bullpen, but one that’s below baseball’s elite. Maybe it’s just cognitive dissonance on my part, but I still have some worries about Devin Williams despite all the objective data suggesting he’s a great bounce-back candidate. And he is, but 2025 will still be in the back of my mind plus, you know, the Mets. Luke Weaver is a good bullpen no. 2 and fallback closer option, and A.J. Minter was at his Mintest last season. Brooks Raley gets a strong projection as well, and ZiPS is unaware of my extreme bias in favor of side-armers; Raley is more low three-quarters, but he’s at least side-arm adjacent. Criswell gets a significantly better projection as a reliever than as a starter. My silicon counterpart is rather meh on the rest of the bullpen, except for maybe Huascar Brazobán, but it still looks like a highly cromulent unit.

Despite last season’s collapse, ZiPS projects the Mets as a highly competitive team in the NL East, and one the league shouldn’t dismiss. Now, come September, six Mets could need Tommy John surgery, or maybe Juan Soto and Francisco Lindor are destined to get trapped inside a leatherbound book given to Carlos Mendoza by a library maintenance worker who looks suspiciously like M.R. James. But predictive algorithms and fuzzy clustering methods allow us to peek only so far behind the veil of fate.

Ballpark graphic courtesy Eephus League. Depth charts constructed by way of those listed here. Size of player names is very roughly proportional to Depth Chart playing time. The final team projections may differ considerably from our Depth Chart playing time.

Batters – Standard
Player B Age PO PA AB R H 2B 3B HR RBI BB SO SB CS
Juan Soto L 27 RF 670 538 109 146 23 1 37 103 124 116 23 3
Francisco Lindor B 32 SS 672 596 102 157 30 1 27 90 58 121 23 4
Bo Bichette R 28 3B 598 555 73 163 31 1 17 80 37 97 5 4
Marcus Semien R 35 2B 581 521 80 127 21 2 17 69 52 93 9 2
Brett Baty L 26 3B 471 426 59 107 16 1 19 61 39 115 5 1
Francisco Alvarez R 24 C 441 392 53 92 15 1 21 64 41 118 1 0
Jorge Polanco B 32 1B 473 419 56 106 18 0 21 69 45 93 4 2
Luis Robert Jr. R 28 CF 470 428 59 102 19 0 18 69 35 127 24 6
Mark Vientos R 26 3B 527 480 59 121 22 2 22 77 37 137 1 0
Jacob Reimer R 22 3B 518 461 74 108 27 3 15 70 41 123 6 2
Ronny Mauricio B 25 3B 460 429 54 104 18 1 15 53 27 117 13 4
Jose Siri R 30 CF 358 327 50 66 14 1 14 47 23 131 12 3
Carson Benge L 23 CF 522 464 72 114 22 5 13 65 48 110 11 3
Luis Torrens R 30 C 271 249 24 62 12 1 6 30 17 60 1 1
Ji Hwan Bae L 26 CF 399 358 63 91 17 4 4 42 35 93 20 6
Chris Suero R 22 C 487 422 62 86 14 1 13 60 47 150 14 6
Jared Young L 30 LF 407 359 51 87 16 2 15 57 38 96 5 2
Ryan Clifford L 22 1B 587 511 63 109 22 1 25 79 66 174 4 2
Jackson Cluff L 29 SS 365 319 44 65 13 2 8 40 35 118 11 2
David Villar R 29 1B 401 354 48 78 15 0 13 49 39 114 2 1
Jesse Winker L 32 DH 364 307 39 72 13 1 9 39 49 77 4 1
Tyrone Taylor R 32 CF 339 312 41 72 18 2 7 33 16 76 9 2
Wyatt Young L 26 2B 439 386 48 89 11 1 3 34 43 99 7 3
Yonny Hernández B 28 2B 400 353 47 85 10 2 2 32 33 61 9 6
A.J. Ewing L 21 CF 592 537 81 135 23 8 4 57 47 127 36 8
Chris Williams R 29 C 321 283 35 55 11 0 11 37 32 116 1 0
Kevin Parada R 24 C 440 399 41 87 18 1 12 51 30 140 2 1
Jose Rojas L 33 DH 434 389 48 85 20 2 18 60 39 106 5 1
Gilberto Celestino R 27 RF 385 347 42 82 12 1 4 35 35 90 6 2
Starling Marte R 37 DH 321 292 38 76 12 1 7 34 19 69 10 2
Christian Arroyo R 31 1B 236 219 26 54 11 0 5 24 12 53 2 1
Luis De Los Santos R 28 3B 365 337 38 73 12 1 7 35 21 103 2 1
Rafael Ortega L 35 RF 326 285 36 60 12 1 6 30 35 75 10 5
Nick Morabito R 23 CF 499 454 59 109 18 2 4 47 36 123 27 9
Tsung-Che Cheng L 24 SS 482 427 52 91 16 3 6 45 40 126 13 7
Cristian Pache R 27 RF 286 257 27 54 9 1 4 26 24 91 4 2
Niko Goodrum B 34 SS 247 211 27 46 8 1 4 23 33 74 5 3
Jose Ramos R 25 RF 467 425 51 91 14 2 15 50 34 175 3 4
D’Andre Smith R 25 LF 369 344 39 84 15 2 6 41 17 85 12 2
Hayden Senger R 29 C 268 244 26 50 8 1 4 24 14 82 1 1
Travis Swaggerty L 28 LF 215 193 23 38 7 2 2 18 20 69 4 2
JT Schwartz L 26 1B 385 345 36 77 16 1 5 39 30 77 1 2
Travis Jankowski L 35 CF 193 170 24 37 5 0 1 14 19 39 9 1
Estarling Mercado L 23 1B 207 186 21 36 6 1 6 24 16 65 2 1
Nick Lorusso R 25 3B 436 399 39 85 23 0 6 41 29 121 5 2
Marco Vargas L 21 2B 448 404 52 83 9 2 2 32 39 103 18 5
Eli Serrano III L 23 CF 380 341 42 68 17 2 7 38 31 89 4 2
Onix Vega R 27 C 203 183 18 37 5 1 1 16 16 45 1 2
Troy Schreffler Jr. R 25 LF 218 199 27 39 5 2 4 21 13 78 6 2
Omar De Los Santos R 26 RF 324 303 40 60 8 3 9 35 14 135 21 7
Trace Willhoite R 25 1B 428 381 55 71 13 1 14 52 31 136 7 1
Yohairo Cuevas L 22 RF 424 376 40 74 19 1 2 33 39 121 10 3
William Lugo R 24 SS 438 398 39 78 14 1 8 41 32 128 3 1
Yonatan Henriquez B 21 CF 423 385 49 77 15 2 6 37 34 100 15 5
Ronald Hernandez B 22 C 422 385 41 76 12 2 5 38 30 114 10 2
Diego Mosquera R 22 LF 253 229 15 46 5 1 0 17 16 56 3 3
Boston Baro L 21 SS 451 420 45 88 16 4 4 37 25 104 13 1
Alex Ramirez R 23 RF 441 406 46 81 14 1 4 33 32 117 19 6
Corey Collins L 24 DH 271 230 19 33 4 1 5 24 29 92 2 1
Vincent Perozo L 23 C 313 283 29 53 11 1 3 29 19 98 2 2
Colin Houck R 21 3B 502 460 55 84 17 4 8 44 33 204 6 3
Jefrey De Los Santos L 23 RF 308 281 26 52 10 3 4 26 20 104 4 2
Nick Roselli L 23 2B 344 312 33 56 13 1 7 34 21 117 2 1

Batters – Advanced
Player PA BA OBP SLG OPS+ ISO BABIP Def WAR wOBA 3YOPS+ RC
Juan Soto 670 .271 .408 .524 163 .253 .283 -7 5.6 .398 162 121
Francisco Lindor 672 .263 .338 .453 123 .190 .290 6 5.4 .342 116 98
Bo Bichette 598 .294 .339 .445 121 .151 .331 5 3.8 .339 118 87
Marcus Semien 581 .244 .315 .390 100 .146 .268 8 2.8 .309 93 67
Brett Baty 471 .251 .318 .427 110 .176 .301 2 2.3 .324 111 59
Francisco Alvarez 441 .235 .315 .439 112 .204 .281 -2 2.3 .326 114 54
Jorge Polanco 473 .253 .327 .446 118 .193 .279 6 2.1 .334 112 63
Luis Robert Jr. 470 .238 .302 .409 100 .171 .297 4 2.1 .307 101 60
Mark Vientos 527 .252 .311 .444 112 .192 .308 -3 2.0 .326 114 66
Jacob Reimer 518 .234 .313 .403 102 .169 .288 1 1.9 .312 105 60
Ronny Mauricio 460 .242 .291 .394 93 .152 .300 8 1.8 .296 95 53
Jose Siri 358 .202 .261 .379 79 .177 .286 9 1.3 .277 76 36
Carson Benge 522 .246 .326 .399 105 .153 .296 -9 1.2 .317 109 64
Luis Torrens 271 .249 .300 .378 92 .129 .306 4 1.2 .296 91 29
Ji Hwan Bae 399 .254 .324 .358 94 .104 .333 -1 1.1 .301 95 48
Chris Suero 487 .204 .304 .334 82 .130 .282 -3 1.0 .287 89 48
Jared Young 407 .242 .325 .423 111 .181 .290 -3 0.9 .327 106 51
Ryan Clifford 587 .213 .308 .407 102 .194 .269 0 0.9 .312 109 66
Jackson Cluff 365 .204 .289 .332 77 .129 .295 2 0.8 .277 75 34
David Villar 401 .220 .304 .373 92 .153 .286 7 0.8 .299 90 41
Jesse Winker 364 .235 .347 .371 105 .136 .285 0 0.8 .321 103 41
Tyrone Taylor 339 .231 .282 .369 84 .138 .284 3 0.8 .283 82 35
Wyatt Young 439 .231 .310 .288 72 .057 .303 7 0.8 .273 72 37
Yonny Hernández 400 .241 .316 .297 76 .056 .286 5 0.7 .278 76 37
A.J. Ewing 592 .251 .314 .346 88 .095 .323 -7 0.7 .291 89 69
Chris Williams 321 .194 .280 .350 78 .156 .282 -1 0.5 .279 75 28
Kevin Parada 440 .218 .280 .358 81 .140 .304 -4 0.5 .280 85 41
Jose Rojas 434 .219 .293 .419 100 .201 .253 0 0.5 .307 94 49
Gilberto Celestino 385 .236 .312 .311 79 .075 .308 6 0.4 .282 79 36
Starling Marte 321 .260 .319 .380 98 .120 .319 0 0.4 .308 93 38
Christian Arroyo 236 .247 .292 .365 86 .119 .304 5 0.4 .288 82 24
Luis De Los Santos 365 .217 .269 .320 67 .103 .291 6 0.3 .261 67 30
Rafael Ortega 326 .211 .295 .323 76 .112 .265 7 0.3 .277 71 31
Nick Morabito 499 .240 .305 .315 77 .075 .321 -3 0.2 .278 81 53
Tsung-Che Cheng 482 .213 .283 .307 68 .094 .288 1 0.2 .264 70 43
Cristian Pache 286 .210 .282 .300 66 .089 .309 8 0.1 .262 67 23
Niko Goodrum 247 .218 .328 .322 87 .104 .316 -6 0.1 .296 81 25
Jose Ramos 467 .214 .276 .362 80 .148 .323 6 0.1 .280 85 45
D’Andre Smith 369 .244 .293 .352 83 .108 .308 1 0.0 .284 86 39
Hayden Senger 268 .205 .260 .295 58 .090 .291 3 0.0 .248 58 19
Travis Swaggerty 215 .197 .274 .285 60 .088 .295 3 -0.3 .253 61 17
JT Schwartz 385 .223 .297 .319 76 .096 .274 3 -0.4 .276 80 34
Travis Jankowski 193 .218 .302 .265 64 .047 .277 -3 -0.4 .262 62 16
Estarling Mercado 207 .194 .271 .333 71 .139 .261 0 -0.5 .268 75 18
Nick Lorusso 436 .213 .268 .316 66 .103 .290 0 -0.5 .258 69 36
Marco Vargas 448 .205 .277 .252 53 .047 .271 3 -0.5 .243 57 34
Eli Serrano III 380 .199 .274 .323 69 .124 .249 -4 -0.6 .265 76 32
Onix Vega 203 .202 .271 .257 52 .055 .263 -3 -0.6 .241 59 14
Troy Schreffler Jr. 218 .196 .253 .302 58 .106 .299 2 -0.6 .246 61 17
Omar De Los Santos 324 .198 .242 .333 62 .135 .321 0 -0.9 .251 66 32
Trace Willhoite 428 .186 .266 .336 70 .150 .247 1 -0.9 .266 75 36
Yohairo Cuevas 424 .197 .283 .269 59 .072 .285 2 -1.1 .252 61 32
William Lugo 438 .196 .263 .296 59 .100 .267 -7 -1.1 .250 63 32
Yonatan Henriquez 423 .200 .268 .296 61 .096 .254 -6 -1.2 .253 67 36
Ronald Hernandez 422 .197 .263 .278 55 .081 .267 -8 -1.2 .244 61 31
Diego Mosquera 253 .201 .268 .231 44 .030 .266 1 -1.2 .231 45 16
Boston Baro 451 .210 .255 .295 56 .086 .269 -8 -1.4 .242 61 35
Alex Ramirez 441 .200 .261 .268 52 .068 .270 4 -1.4 .239 56 35
Corey Collins 271 .143 .262 .235 43 .092 .211 0 -1.4 .235 46 15
Vincent Perozo 313 .187 .259 .265 50 .078 .275 -10 -1.5 .238 56 21
Colin Houck 502 .183 .243 .289 51 .106 .306 -2 -1.7 .237 60 35
Jefrey De Los Santos 308 .185 .245 .285 51 .100 .277 -3 -1.8 .235 57 21
Nick Roselli 344 .179 .245 .295 53 .116 .261 -13 -2.1 .241 59 23

Batters – Top Near-Age Offensive Comps
Player Hit Comp 1 Hit Comp 2 Hit Comp 3
Juan Soto Rusty Staub Carl Yastrzemski Barry Bonds
Francisco Lindor Marcus Semien Charlie Gehringer Carlos Guillén
Bo Bichette Carney Lansford Cecil Travis Martín Prado
Marcus Semien Eddie Mayo Jimmy Rollins Ian Kinsler
Brett Baty Ryan Rua Doug DeCinces Ken Macha
Francisco Alvarez Earl Williams Todd Zeile Derek Parks
Jorge Polanco Greg Brock Richie Hebner Joe Collins
Luis Robert Jr. Carl Everett Bill Barrett Jake Marisnick
Mark Vientos Kevin Mitchell Jeff Kent Tony Perez
Jacob Reimer Carlos Asuaje Scott Romano Bill Melton
Ronny Mauricio Gene Freese Tom Brookens J.P. Roberge
Jose Siri Billy Cowan Corey Brown Hiram Bocachica
Carson Benge George Vukovich Andrew McCutchen Bernie Williams
Luis Torrens Robert Machado Tony Tornay Shawn McGill
Ji Hwan Bae Dave Collins Mallex Smith Joe Christopher
Chris Suero Kurt Kingsolver Jayson Werth Ben Petrick
Jared Young Armando Rios Mike Yastrzemski Jeffrey Hammonds
Ryan Clifford Jon Singleton Randy Schwartz Cody Bellinger
Jackson Cluff Anthony Granato Joe Koppe Jimmy Sexton
David Villar Brad Nelson Matt Skole Mike Reddish
Jesse Winker Norm Siebern Lee Mazzilli Steve Braun
Tyrone Taylor Fehlandt Lentini Jonny Kaplan Joe Simpson
Wyatt Young Derek Mann Elio Chacon Nick Shaw
Yonny Hernández John Finn Justin Henry Christian Stringer
A.J. Ewing Tyson Gillies Lonnie Smith Mallex Smith
Chris Williams Jerry Goff Arlo Brunsberg Jayhawk Owens
Kevin Parada Alfredo Torres Bob Schmidt Jack Fimple
Jose Rojas Franklin Stubbs Leon Durham Chris Young
Gilberto Celestino Trey Beamon Neil Martin L.J. Hoes
Starling Marte Skeeter Barnes George Metkovich Bert Haas
Christian Arroyo Ray Hamrick Jay Ragni Mark DeRosa
Luis De Los Santos Dick Canan Jim Gruber Julio Cordido
Rafael Ortega Cliff Heathcote Sam Fuld Willie Harris
Nick Morabito Don White Alejandro De Aza Leo Sutherland
Tsung-Che Cheng Hak-Ju Lee Matt Smith Juan Gonzalez
Cristian Pache Mike Sullivan Victor LaRose Mark Doran
Niko Goodrum Oscar Grimes Anthony Seratelli Drew Maggi
Jose Ramos Marvin Stendel Joe Gaetti Bob Prentice
D’Andre Smith D’Arby Myers Hal Jeffcoat Willie Romero
Hayden Senger Otis Thornton Tony DeFrancesco Scott Knazek
Travis Swaggerty Don Frailey Zach Collier Mark Thomas
JT Schwartz Kevin Burford Andy Barkett Austin Davidson
Travis Jankowski Jarrod Dyson Jim Busby Tack Wilson
Estarling Mercado Daniel Berg Jacob Julius Ed Hartman
Nick Lorusso Robert Mills Sean Walsh Bob Gergen
Marco Vargas Elvis Pena Larry Eckenrode Forrest Wall
Eli Serrano III Roger McSwain Bob Wolenski Jabari Henry
Onix Vega Kevin Davidson Jeremy Dowdy Brent Mayne
Troy Schreffler Jr. Kent Gerst Brian Gump Cristian Paulino
Omar De Los Santos Dennis Hood Tim Battle Dorian Speed
Trace Willhoite Garrick Haltiwanger Curtis Suchan Jim O’Rourke
Yohairo Cuevas Adam Bonner Michael Strickland James Broughton
William Lugo Ryan Stegall Brett Elam Jake Wald
Yonatan Henriquez George Wright Roberto Kelly Jerry Bartee
Ronald Hernandez Harry Billie John Antonelli Jim Lawrence
Diego Mosquera Jerald Cain Mark Miller Earl Agnoly
Boston Baro Ivan Castillo Nick Allen Gavin Lux
Alex Ramirez Jay Johnson Brandon Bridgers Ossie Garcia
Corey Collins Bill Brown Samuel Antcliffe De Jon Watson
Vincent Perozo Parker Morin Dallas Jones Ray Bond
Colin Houck Ron Dunn Alex Liddi Tony Taylor
Jefrey De Los Santos Randy Black Peter Fatse Tim Curley
Nick Roselli Chris Brown Scott Clemo Ryan Schimpf

Batters – 80th/20th Percentiles
Player 80th BA 80th OBP 80th SLG 80th OPS+ 80th WAR 20th BA 20th OBP 20th SLG 20th OPS+ 20th WAR
Juan Soto .296 .436 .594 187 7.3 .248 .382 .473 145 4.1
Francisco Lindor .286 .361 .507 143 7.0 .240 .314 .409 102 3.8
Bo Bichette .319 .366 .499 142 5.2 .263 .310 .405 101 2.3
Marcus Semien .268 .338 .432 117 4.0 .219 .286 .343 79 1.3
Brett Baty .276 .348 .482 131 3.6 .222 .294 .371 89 1.1
Francisco Alvarez .263 .343 .502 137 3.6 .208 .285 .382 91 1.3
Jorge Polanco .280 .354 .494 138 3.2 .225 .300 .399 99 1.0
Luis Robert Jr. .264 .326 .464 122 3.4 .212 .277 .364 82 1.0
Mark Vientos .277 .338 .503 134 3.4 .225 .281 .387 90 0.6
Jacob Reimer .263 .337 .458 124 3.2 .212 .288 .355 84 0.8
Ronny Mauricio .267 .319 .446 114 3.1 .216 .265 .350 75 0.8
Jose Siri .229 .293 .437 104 2.4 .176 .234 .319 59 0.3
Carson Benge .273 .351 .456 127 2.6 .219 .300 .344 85 0.0
Luis Torrens .282 .336 .434 115 2.0 .221 .276 .333 74 0.6
Ji Hwan Bae .281 .348 .404 112 2.0 .225 .293 .317 76 0.2
Chris Suero .236 .328 .392 103 2.2 .176 .275 .284 62 -0.2
Jared Young .267 .349 .473 131 1.8 .216 .299 .370 92 0.0
Ryan Clifford .241 .339 .464 123 2.3 .186 .281 .355 79 -0.7
Jackson Cluff .232 .320 .389 100 1.8 .176 .261 .291 58 0.0
David Villar .245 .331 .425 112 1.9 .192 .274 .324 71 -0.2
Jesse Winker .265 .376 .420 126 1.7 .206 .316 .315 81 -0.2
Tyrone Taylor .259 .313 .426 108 1.8 .202 .253 .322 65 0.0
Wyatt Young .261 .339 .316 87 1.7 .205 .284 .249 55 -0.1
Yonny Hernández .269 .341 .332 93 1.5 .216 .289 .265 60 -0.1
A.J. Ewing .280 .342 .389 108 2.1 .221 .289 .303 70 -0.7
Chris Williams .225 .308 .412 100 1.4 .170 .253 .299 58 -0.3
Kevin Parada .244 .304 .406 98 1.4 .190 .251 .313 59 -0.7
Jose Rojas .242 .315 .476 120 1.5 .196 .269 .375 83 -0.5
Gilberto Celestino .262 .341 .354 97 1.2 .208 .282 .272 60 -0.5
Starling Marte .289 .348 .424 118 1.3 .229 .291 .339 80 -0.3
Christian Arroyo .277 .326 .416 107 1.0 .218 .266 .320 65 -0.2
Luis De Los Santos .243 .299 .368 89 1.2 .191 .242 .280 49 -0.5
Rafael Ortega .240 .325 .380 97 1.2 .181 .266 .275 55 -0.5
Nick Morabito .264 .328 .352 92 1.1 .214 .282 .283 63 -0.7
Tsung-Che Cheng .239 .309 .346 87 1.2 .187 .261 .270 54 -0.8
Cristian Pache .242 .307 .341 84 0.8 .181 .250 .260 47 -0.5
Niko Goodrum .250 .355 .372 109 0.7 .190 .294 .271 68 -0.5
Jose Ramos .240 .303 .410 99 1.1 .186 .249 .308 59 -1.2
D’Andre Smith .266 .316 .395 98 0.7 .218 .267 .314 66 -0.7
Hayden Senger .239 .293 .347 83 0.9 .176 .231 .255 40 -0.6
Travis Swaggerty .225 .307 .330 80 0.2 .172 .249 .246 43 -0.8
JT Schwartz .254 .324 .371 96 0.5 .200 .273 .283 60 -1.2
Travis Jankowski .253 .332 .302 83 0.1 .190 .275 .228 49 -0.7
Estarling Mercado .223 .300 .386 90 0.0 .170 .245 .286 52 -1.0
Nick Lorusso .240 .292 .351 81 0.4 .192 .242 .284 49 -1.4
Marco Vargas .236 .305 .290 71 0.5 .179 .252 .221 39 -1.3
Eli Serrano III .224 .296 .370 86 0.2 .175 .247 .279 50 -1.5
Onix Vega .234 .304 .299 73 0.0 .170 .241 .220 32 -1.1
Troy Schreffler Jr. .227 .282 .352 80 0.0 .171 .229 .261 42 -1.0
Omar De Los Santos .227 .267 .391 84 0.0 .173 .215 .288 44 -1.7
Trace Willhoite .211 .292 .393 89 0.1 .159 .240 .291 50 -2.0
Yohairo Cuevas .226 .312 .308 77 -0.1 .175 .258 .233 43 -1.9
William Lugo .224 .290 .341 77 -0.1 .171 .234 .258 41 -2.1
Yonatan Henriquez .226 .298 .339 78 -0.2 .172 .242 .258 42 -2.1
Ronald Hernandez .230 .293 .326 76 0.0 .165 .232 .239 38 -2.1
Diego Mosquera .232 .296 .266 61 -0.8 .175 .239 .198 27 -1.8
Boston Baro .239 .285 .351 79 -0.1 .188 .232 .263 40 -2.4
Alex Ramirez .227 .286 .301 68 -0.5 .178 .236 .235 37 -2.2
Corey Collins .169 .289 .278 60 -0.8 .123 .240 .198 28 -1.9
Vincent Perozo .222 .295 .315 73 -0.7 .160 .235 .229 35 -2.1
Colin Houck .212 .271 .330 70 -0.6 .155 .215 .246 32 -2.9
Jefrey De Los Santos .209 .272 .325 68 -1.1 .161 .220 .241 33 -2.4
Nick Roselli .209 .269 .350 75 -1.2 .157 .219 .257 36 -2.8

Batters – Platoon Splits
Player BA vs. L OBP vs. L SLG vs. L BA vs. R OBP vs. R SLG vs. R
Juan Soto .260 .383 .468 .277 .420 .551
Francisco Lindor .268 .337 .448 .262 .338 .455
Bo Bichette .297 .351 .464 .293 .336 .439
Marcus Semien .250 .325 .405 .241 .311 .383
Brett Baty .240 .303 .395 .256 .325 .441
Francisco Alvarez .239 .331 .451 .232 .306 .432
Jorge Polanco .258 .314 .445 .251 .332 .447
Luis Robert Jr. .254 .323 .430 .232 .294 .401
Mark Vientos .266 .323 .468 .244 .305 .430
Jacob Reimer .241 .320 .406 .232 .310 .402
Ronny Mauricio .241 .286 .399 .244 .295 .391
Jose Siri .206 .271 .393 .200 .255 .373
Carson Benge .232 .317 .360 .251 .329 .413
Luis Torrens .253 .303 .407 .247 .298 .361
Ji Hwan Bae .246 .308 .331 .258 .332 .371
Chris Suero .202 .304 .336 .205 .304 .333
Jared Young .231 .311 .398 .247 .331 .434
Ryan Clifford .203 .293 .366 .216 .313 .420
Jackson Cluff .193 .273 .295 .208 .295 .346
David Villar .226 .316 .383 .217 .297 .367
Jesse Winker .219 .337 .342 .239 .350 .380
Tyrone Taylor .233 .286 .369 .230 .280 .368
Wyatt Young .226 .303 .283 .232 .313 .289
Yonny Hernández .245 .320 .318 .239 .314 .288
A.J. Ewing .247 .306 .329 .253 .317 .353
Chris Williams .204 .297 .359 .189 .271 .344
Kevin Parada .223 .290 .375 .216 .276 .352
Jose Rojas .214 .285 .368 .221 .296 .441
Gilberto Celestino .239 .323 .301 .235 .306 .316
Starling Marte .266 .322 .380 .258 .318 .380
Christian Arroyo .247 .291 .384 .247 .293 .356
Luis De Los Santos .224 .278 .345 .213 .265 .308
Rafael Ortega .200 .274 .277 .214 .302 .336
Nick Morabito .228 .294 .293 .245 .309 .323
Tsung-Che Cheng .211 .274 .293 .214 .287 .313
Cristian Pache .224 .303 .318 .200 .267 .287
Niko Goodrum .233 .333 .317 .212 .326 .325
Jose Ramos .218 .282 .394 .212 .273 .346
D’Andre Smith .245 .294 .373 .244 .292 .343
Hayden Senger .203 .256 .278 .206 .263 .303
Travis Swaggerty .194 .260 .299 .198 .282 .278
JT Schwartz .212 .288 .283 .228 .300 .333
Travis Jankowski .195 .283 .220 .225 .308 .279
Estarling Mercado .184 .259 .265 .197 .275 .358
Nick Lorusso .211 .272 .325 .214 .267 .312
Marco Vargas .202 .267 .239 .207 .280 .258
Eli Serrano III .188 .255 .313 .204 .281 .327
Onix Vega .206 .271 .238 .200 .271 .267
Troy Schreffler Jr. .203 .273 .322 .193 .245 .293
Omar De Los Santos .194 .240 .337 .200 .243 .332
Trace Willhoite .188 .273 .350 .186 .264 .330
Yohairo Cuevas .186 .270 .235 .201 .288 .281
William Lugo .200 .268 .304 .194 .260 .293
Yonatan Henriquez .198 .261 .292 .201 .270 .297
Ronald Hernandez .200 .258 .255 .196 .265 .287
Diego Mosquera .194 .260 .224 .204 .271 .235
Boston Baro .198 .244 .279 .214 .259 .301
Alex Ramirez .206 .273 .260 .196 .255 .273
Corey Collins .138 .260 .200 .145 .263 .248
Vincent Perozo .184 .259 .263 .188 .259 .266
Colin Houck .189 .255 .311 .180 .238 .280
Jefrey De Los Santos .187 .244 .280 .184 .246 .286
Nick Roselli .165 .228 .271 .185 .251 .304

Pitchers – Standard
Player T Age W L ERA G GS IP H ER HR BB SO
Freddy Peralta R 30 12 9 3.87 30 30 160.7 133 69 21 61 174
Clay Holmes R 33 10 8 3.90 28 24 136.0 137 59 11 47 109
Nolan McLean R 24 10 8 3.94 28 26 144.0 128 63 15 56 142
Kodai Senga R 33 8 7 3.82 25 25 127.3 110 54 15 58 125
David Peterson L 30 7 7 4.07 28 27 146.0 140 66 13 58 133
Jonah Tong R 23 9 8 4.07 26 25 117.3 103 53 15 48 132
Tylor Megill R 30 6 6 4.00 21 21 96.0 87 45 11 41 105
Devin Williams R 31 6 4 3.14 61 0 57.3 39 20 5 23 79
Tobias Myers R 27 6 6 4.38 29 20 111.0 113 54 15 36 89
Jonathan Pintaro R 28 4 3 4.10 26 15 74.7 70 34 8 30 71
Jonathan Santucci L 23 6 6 4.70 24 22 105.3 103 55 15 39 91
Jack Wenninger R 24 7 8 4.71 24 22 116.7 118 61 17 40 95
Sean Manaea L 34 5 5 4.51 22 18 101.7 94 51 16 31 104
Joander Suarez R 26 5 7 4.57 21 17 90.7 94 46 13 25 72
Justin Hagenman R 29 3 4 4.46 30 12 84.7 85 42 13 20 74
R.J. Gordon R 24 6 7 4.84 24 19 113.3 113 61 17 41 95
Griffin Canning R 30 6 6 4.76 20 20 102.0 100 54 17 40 92
A.J. Minter L 32 5 3 3.53 56 0 51.0 43 20 6 17 56
Cooper Criswell R 29 4 5 4.67 24 16 90.7 92 47 12 29 71
Brandon Waddell L 32 5 5 4.67 24 14 86.7 89 45 12 29 68
Christian Scott R 27 3 3 4.55 14 14 63.3 62 32 9 18 55
Luke Weaver R 32 4 4 4.30 47 5 69.0 64 33 10 24 76
Zach Thornton L 24 4 5 4.65 16 15 69.7 71 36 9 22 53
Felipe De La Cruz L 25 4 5 4.66 27 12 75.3 75 39 10 34 70
Will Watson R 23 5 6 4.98 26 21 103.0 100 57 14 49 90
Robert Stock R 36 3 5 4.86 18 13 70.3 70 38 10 31 64
Brooks Raley L 38 2 2 3.79 41 1 35.7 30 15 3 12 35
Carl Edwards Jr. R 34 2 3 4.44 25 6 52.7 52 26 7 23 45
Kevin Herget R 35 2 2 4.28 35 4 54.7 56 26 7 15 44
Joey Gerber R 29 1 1 4.43 32 8 42.7 41 21 6 14 40
Huascar Brazobán R 36 3 3 4.26 50 2 61.3 56 29 6 29 58
Luis García R 39 2 2 4.10 51 1 48.3 48 22 4 20 43
Dylan Ross R 25 1 1 4.12 53 0 54.7 47 25 7 26 58
Brendan Girton R 24 3 4 5.03 24 20 78.7 76 44 10 38 66
Reed Garrett R 33 4 3 3.99 37 0 38.3 35 17 4 19 41
Max Kranick R 28 2 1 4.46 26 4 40.3 41 20 6 11 31
Richard Lovelady L 30 2 2 4.27 43 1 46.3 44 22 5 15 43
Aaron Rozek L 30 3 4 5.05 26 11 92.7 100 52 14 30 66
Adbert Alzolay R 31 2 3 4.25 31 1 36.0 34 17 5 11 32
Luis Moreno R 27 5 7 5.08 31 12 85.0 88 48 11 40 64
Jordan Geber R 26 3 3 4.97 20 8 54.3 59 30 8 20 35
Dedniel Núñez R 30 2 2 4.17 28 0 36.7 34 17 5 15 38
Austin Warren R 30 5 5 4.53 35 3 51.7 49 26 7 20 47
Joe Jacques L 31 2 2 4.35 43 1 49.7 49 24 5 18 42
Douglas Orellana R 24 2 3 4.82 32 6 52.3 50 28 8 28 51
Colin Poche L 32 3 3 4.46 45 0 40.3 37 20 6 17 37
Nate Lavender L 26 3 2 4.37 25 0 35.0 30 17 4 18 38
José Castillo L 30 2 3 4.32 39 0 41.7 39 20 5 18 43
Brian Metoyer R 29 1 1 4.50 33 0 36.0 31 18 4 19 40
Ryan Lambert R 23 1 2 4.53 47 0 47.7 41 24 6 25 53
Nick Burdi R 33 2 1 4.50 33 0 36.0 31 18 4 19 39
Alex Carrillo R 29 3 4 4.57 37 0 43.3 39 22 6 20 45
Saul Garcia R 23 3 5 5.12 31 4 51.0 47 29 7 29 51
Frankie Montas R 33 4 7 5.44 18 17 86.0 90 52 14 38 71
Carlos Guzman R 28 3 5 5.07 34 4 55.0 55 31 8 25 46
Jefry Yan L 29 2 3 4.75 29 1 36.0 31 19 4 23 40
Drew Smith R 32 2 3 4.79 37 0 35.7 34 19 6 17 36
Matt Turner L 26 1 2 5.08 36 3 51.3 51 29 7 25 42
Hunter Parsons R 29 2 3 4.98 24 0 34.3 32 19 5 17 34
Joshua Cornielly R 25 3 4 4.97 34 1 50.7 50 28 8 20 44
Robinson Martínez R 28 1 1 4.94 26 0 31.0 30 17 4 17 29
Zach Peek R 28 5 6 4.85 35 1 55.7 56 30 8 26 48
Trey McGough L 28 2 3 5.02 24 1 43.0 43 24 6 22 35
Ben Simon R 24 2 4 4.96 33 0 45.3 46 25 6 17 35
Daniel Juarez L 25 2 2 5.05 27 0 35.7 36 20 5 17 28
Justin Garza R 32 2 4 5.40 38 1 43.3 46 26 7 17 34

Pitchers – Advanced
Player IP K/9 BB/9 HR/9 BB% K% BABIP ERA+ 3ERA+ FIP ERA- WAR
Freddy Peralta 160.7 9.7 3.4 1.2 9.1% 25.9% .273 108 106 3.97 93 2.5
Clay Holmes 136.0 7.2 3.1 0.7 8.0% 18.5% .304 107 103 3.83 94 2.4
Nolan McLean 144.0 8.9 3.5 0.9 9.2% 23.2% .288 106 107 3.98 94 2.3
Kodai Senga 127.3 8.8 4.1 1.1 10.5% 22.7% .277 109 105 4.19 92 2.1
David Peterson 146.0 8.2 3.6 0.8 9.2% 21.1% .301 103 100 3.83 97 2.0
Jonah Tong 117.3 10.1 3.7 1.2 9.6% 26.3% .293 103 107 3.85 97 1.7
Tylor Megill 96.0 9.8 3.8 1.0 9.9% 25.3% .300 99 97 3.93 101 1.2
Devin Williams 57.3 12.4 3.6 0.8 9.8% 33.8% .274 133 126 2.90 75 1.1
Tobias Myers 111.0 7.2 2.9 1.2 7.5% 18.6% .293 95 97 4.40 105 1.0
Jonathan Pintaro 74.7 8.6 3.6 1.0 9.3% 22.0% .295 102 101 4.14 98 0.9
Jonathan Santucci 105.3 7.8 3.3 1.3 8.5% 19.9% .289 89 94 4.48 112 0.8
Jack Wenninger 116.7 7.3 3.1 1.3 7.8% 18.6% .291 89 94 4.59 112 0.8
Sean Manaea 101.7 9.2 2.7 1.4 7.3% 24.5% .287 92 86 4.26 109 0.8
Joander Suarez 90.7 7.1 2.5 1.3 6.4% 18.6% .296 91 95 4.40 110 0.8
Justin Hagenman 84.7 7.9 2.1 1.4 5.6% 20.9% .293 93 94 4.23 108 0.7
R.J. Gordon 113.3 7.5 3.3 1.4 8.4% 19.3% .288 86 91 4.60 116 0.6
Griffin Canning 102.0 8.1 3.5 1.5 9.0% 20.8% .286 88 87 4.79 114 0.6
A.J. Minter 51.0 9.9 3.0 1.1 8.0% 26.4% .282 118 112 3.56 85 0.6
Cooper Criswell 90.7 7.0 2.9 1.2 7.5% 18.3% .292 89 89 4.54 112 0.6
Brandon Waddell 86.7 7.1 3.0 1.2 7.8% 18.2% .294 89 86 4.67 112 0.5
Christian Scott 63.3 7.8 2.6 1.3 6.8% 20.8% .290 92 94 4.32 109 0.5
Luke Weaver 69.0 9.9 3.1 1.3 8.2% 25.9% .298 97 94 3.98 103 0.5
Zach Thornton 69.7 6.8 2.8 1.2 7.4% 17.7% .291 90 95 4.48 111 0.5
Felipe De La Cruz 75.3 8.4 4.1 1.2 10.1% 20.8% .301 90 93 4.54 112 0.4
Will Watson 103.0 7.9 4.3 1.2 10.7% 19.7% .289 84 90 4.76 119 0.4
Robert Stock 70.3 8.2 4.0 1.3 10.0% 20.6% .297 86 78 4.90 117 0.3
Brooks Raley 35.7 8.8 3.0 0.8 8.2% 23.8% .278 110 97 3.64 91 0.3
Carl Edwards Jr. 52.7 7.7 3.9 1.2 10.0% 19.5% .292 94 87 4.55 107 0.3
Kevin Herget 54.7 7.2 2.5 1.2 6.4% 18.9% .297 97 90 4.15 103 0.3
Joey Gerber 42.7 8.4 3.0 1.3 7.7% 21.9% .292 94 95 4.24 106 0.3
Huascar Brazobán 61.3 8.5 4.3 0.9 10.7% 21.5% .291 98 89 4.16 102 0.3
Luis García 48.3 8.0 3.7 0.7 9.3% 20.0% .308 102 98 3.89 98 0.3
Dylan Ross 54.7 9.5 4.3 1.2 10.9% 24.4% .282 101 108 4.19 99 0.2
Brendan Girton 78.7 7.5 4.3 1.1 10.9% 19.0% .287 83 87 4.85 120 0.2
Reed Garrett 38.3 9.6 4.5 0.9 11.2% 24.3% .304 105 97 3.95 95 0.2
Max Kranick 40.3 6.9 2.5 1.3 6.4% 18.1% .287 93 94 4.45 107 0.2
Richard Lovelady 46.3 8.4 2.9 1.0 7.7% 21.9% .295 98 98 4.01 102 0.2
Aaron Rozek 92.7 6.4 2.9 1.4 7.4% 16.3% .296 83 82 4.84 121 0.1
Adbert Alzolay 36.0 8.0 2.8 1.3 7.3% 21.2% .284 98 95 4.36 102 0.1
Luis Moreno 85.0 6.8 4.2 1.2 10.4% 16.7% .294 82 84 4.96 122 0.1
Jordan Geber 54.3 5.8 3.3 1.3 8.3% 14.5% .291 84 87 5.00 119 0.1
Dedniel Núñez 36.7 9.3 3.7 1.2 9.4% 23.9% .293 100 100 4.09 100 0.1
Austin Warren 51.7 8.2 3.5 1.2 9.0% 21.2% .288 92 92 4.50 109 0.1
Joe Jacques 49.7 7.6 3.3 0.9 8.4% 19.5% .299 96 92 4.23 104 0.1
Douglas Orellana 52.3 8.8 4.8 1.4 11.9% 21.6% .292 87 93 4.92 115 0.1
Colin Poche 40.3 8.3 3.8 1.3 9.8% 21.3% .277 93 92 4.53 107 0.0
Nate Lavender 35.0 9.8 4.6 1.0 11.8% 24.8% .286 95 98 4.28 105 0.0
José Castillo 41.7 9.3 3.9 1.1 10.0% 23.9% .301 97 93 4.24 103 0.0
Brian Metoyer 36.0 10.0 4.8 1.0 11.6% 24.4% .290 93 93 4.39 108 0.0
Ryan Lambert 47.7 10.0 4.7 1.1 11.8% 25.1% .287 92 100 4.34 109 0.0
Nick Burdi 36.0 9.8 4.8 1.0 11.8% 24.2% .287 93 88 4.36 108 0.0
Alex Carrillo 43.3 9.3 4.2 1.2 10.4% 23.3% .287 91 90 4.48 110 -0.1
Saul Garcia 51.0 9.0 5.1 1.2 12.6% 22.1% .288 82 88 4.95 122 -0.1
Frankie Montas 86.0 7.4 4.0 1.5 9.9% 18.5% .296 77 73 5.09 130 -0.1
Carlos Guzman 55.0 7.5 4.1 1.3 10.2% 18.8% .290 82 84 4.96 122 -0.1
Jefry Yan 36.0 10.0 5.8 1.0 13.7% 23.8% .290 88 86 4.64 114 -0.1
Drew Smith 35.7 9.1 4.3 1.5 10.8% 22.8% .289 87 85 4.85 115 -0.1
Matt Turner 51.3 7.4 4.4 1.2 10.9% 18.3% .289 82 86 5.05 122 -0.2
Hunter Parsons 34.3 8.9 4.5 1.3 11.1% 22.2% .287 84 85 4.82 119 -0.2
Joshua Cornielly 50.7 7.8 3.6 1.4 9.0% 19.7% .288 84 90 4.96 119 -0.2
Robinson Martínez 31.0 8.4 4.9 1.2 12.1% 20.7% .295 85 84 4.91 118 -0.2
Zach Peek 55.7 7.8 4.2 1.3 10.4% 19.1% .294 86 87 4.87 116 -0.2
Trey McGough 43.0 7.3 4.6 1.3 11.4% 18.1% .289 83 84 4.88 120 -0.2
Ben Simon 45.3 7.0 3.4 1.2 8.5% 17.5% .292 84 88 4.80 119 -0.3
Daniel Juarez 35.7 7.1 4.3 1.3 10.7% 17.6% .290 83 87 5.10 120 -0.3
Justin Garza 43.3 7.1 3.5 1.5 8.8% 17.5% .295 77 75 5.01 130 -0.4

Pitchers – Top Near-Age Comps
Player Pit Comp 1 Pit Comp 2 Pit Comp 3
Freddy Peralta Jack Morris Bob Lemon Chan Ho Park
Clay Holmes Brad Penny Bob Lemon Jake Arrieta
Nolan McLean Sonny Gray Floyd Wooldridge Freddy Garcia
Kodai Senga Bullet Joe Bush Doug McWeeny Rick Sutcliffe
David Peterson Andy Pettitte Wade Miley Mike Hampton
Jonah Tong Alex Fernandez Cal Eldred Kurt Ainsworth
Tylor Megill Larry Carter Bob Bruce Darren Dreifort
Devin Williams Joe Nathan Fernando Rodney Felix Rodriguez
Tobias Myers David Cyrus Bernard Rossman Ray Semproch
Jonathan Pintaro Rich Loiselle Roy Lee Jackson Mike Oquist
Jonathan Santucci Jack Kralick Paul Mildren James Gillheeney
Jack Wenninger Cal Quantrill Tyler Mahle Sal Romano
Sean Manaea Rudy May Floyd Bannister Frank Tanana
Joander Suarez Mark Bauer Bear Bay Joe Wieland
Justin Hagenman Rollie Sheldon Tom Parsons Nelson Briles
R.J. Gordon Floyd Shiver Jackson Stephens Nabil Crismatt
Griffin Canning Ray Benge Larry Dierker Todd Wellemeyer
A.J. Minter Tug McGraw Jake McGee Joe Hoerner
Cooper Criswell Wayne Garland Babe Birrer Shairon Martis
Brandon Waddell Bill Smith Derek Lee Atlee Hammaker
Christian Scott Tim Hallgren Sean Snedeker Dave Therneau
Luke Weaver Dave Giusti Scott Sanders Lynn McGlothen
Zach Thornton Steve Garrison Adam Morgan Ray Harris
Felipe De La Cruz Arthur Siefert Bobby Bramhall Jose Caldera
Will Watson Mike Costello Shawn Boskie Dave Veres
Robert Stock Dick Starr Early Wynn Jose Mercedes
Brooks Raley Bob McClure Bobby Shantz Brian Fuentes
Carl Edwards Jr. Joe Coleman Johnny Miljus Willie Banks
Kevin Herget Galen Cisco Juan Eichelberger John DeSilva
Joey Gerber Trystan Magnuson Josh Perrault Ron Hill
Huascar Brazobán Diego Segui Marv Grissom Al Worthington
Luis García Jim Johnson Blaine Boyer LaTroy Hawkins
Dylan Ross Ryan Perry Jake Barrett Jack Lamabe
Brendan Girton Paul Demny Ryan Tucker John Glass
Reed Garrett Don McMahon Hector Navarro Dane Johnson
Max Kranick Matt Capps Chris Smith Edgmer Escalona
Richard Lovelady Bryan Eversgerd Craig Skok Joe Grzenda
Aaron Rozek Logan Darnell Allan Anderson Ryan Feierabend
Adbert Alzolay Claude Raymond Luis Aloma Mike Schooler
Luis Moreno Tim Crabbe Steven Wright Warwick Saupold
Jordan Geber Mike Martinez Henry Villar Chris Bennett
Dedniel Núñez Dave Wallace Johnny Murphy Jon Hunton
Austin Warren Howie Judson Randall Delgado Edwin Moreno
Joe Jacques Francisley Bueno Ron Meridith Will Brunson
Douglas Orellana Chris Freeman Robert Hinton Abel De Los Santos
Colin Poche Fernando Abad Rich Rodriguez Pat Perry
Nate Lavender Tyler Johnson John Morris Bobby Burke
José Castillo Jeff Kaiser Fred Scherman Dennis Kinney
Brian Metoyer Anthony Chavez Jim Duffalo Brad Clontz
Ryan Lambert Joe Valentine Victor Garcia Wayne Kirby
Nick Burdi Bill Campbell Jim Hughes Dave Baldwin
Alex Carrillo John Costello Juan Salas Dave Tobik
Saul Garcia Rich Henning Adrian Rosario Jeff Harrell
Frankie Montas Erik Hanson David Lutz Edwin Jackson
Carlos Guzman Steve Shea Matt Langwell Luis Perdomo
Jefry Yan David Rosario Dustin Richardson Atahualpa Severino
Drew Smith Ernie Johnson Lerrin LaGrow Emil Kush
Matt Turner Anthony Ferrari Bob Buchanan Dick McCoy
Hunter Parsons Eddie Gaillard Art Herring Dave Gerard
Joshua Cornielly Ronny Morla Lloyd Gladden Ryan Kohlmeier
Robinson Martínez Duane Shaffer Pete Appleton Bradley Meyring
Zach Peek Kenny Greer B.J. Rosenberg Dick Hyde
Trey McGough Colin Young Homero Rivera Frankie Reed
Ben Simon Jay Aldrich Rolando Valdez Steven Fair
Daniel Juarez Dave Leiper William McLaurine Dick Cooke
Justin Garza J.C. Gutierrez Brandon Morrow Jeff Gray

Pitchers – Splits and Percentiles
Player BA vs. L OBP vs. L SLG vs. L BA vs. R OBP vs. R SLG vs. R 80th WAR 20th WAR 80th ERA 20th ERA
Freddy Peralta .216 .306 .353 .227 .292 .406 3.6 1.3 3.32 4.50
Clay Holmes .262 .339 .403 .248 .306 .355 3.3 1.5 3.47 4.46
Nolan McLean .243 .335 .393 .221 .294 .349 3.1 1.0 3.51 4.64
Kodai Senga .233 .330 .377 .226 .301 .379 2.9 1.3 3.33 4.42
David Peterson .226 .288 .329 .252 .331 .388 3.1 0.8 3.44 4.82
Jonah Tong .214 .292 .405 .241 .313 .363 2.7 0.7 3.43 4.80
Tylor Megill .243 .340 .403 .226 .297 .363 1.8 0.3 3.63 4.99
Devin Williams .194 .301 .337 .187 .261 .280 1.9 0.1 2.28 4.64
Tobias Myers .259 .326 .412 .256 .309 .430 1.8 0.2 3.82 4.97
Jonathan Pintaro .268 .354 .391 .214 .295 .364 1.5 0.4 3.57 4.72
Jonathan Santucci .255 .331 .391 .247 .310 .428 1.5 0.0 4.14 5.34
Jack Wenninger .241 .314 .398 .267 .322 .449 1.5 0.0 4.18 5.29
Sean Manaea .216 .271 .352 .248 .313 .442 1.5 -0.1 3.90 5.49
Joander Suarez .284 .340 .481 .236 .285 .382 1.4 0.1 4.03 5.28
Justin Hagenman .255 .307 .451 .256 .295 .422 1.3 0.0 3.79 5.24
R.J. Gordon .235 .307 .417 .266 .325 .434 1.3 -0.2 4.38 5.51
Griffin Canning .253 .336 .454 .252 .311 .431 1.3 -0.2 4.20 5.51
A.J. Minter .206 .265 .286 .236 .305 .417 1.1 0.0 2.77 4.55
Cooper Criswell .266 .342 .456 .249 .308 .392 1.1 0.0 4.13 5.35
Brandon Waddell .273 .341 .400 .253 .323 .442 1.1 -0.1 4.13 5.32
Christian Scott .246 .301 .434 .256 .319 .408 1.1 0.1 3.88 5.19
Luke Weaver .240 .313 .403 .237 .296 .410 1.3 -0.2 3.42 5.34
Zach Thornton .232 .297 .305 .267 .330 .462 1.0 0.0 4.09 5.27
Felipe De La Cruz .253 .330 .407 .250 .335 .418 1.1 -0.2 4.02 5.34
Will Watson .238 .335 .386 .256 .333 .437 1.1 -0.4 4.53 5.65
Robert Stock .271 .362 .450 .236 .329 .392 0.8 -0.2 4.24 5.68
Brooks Raley .195 .267 .293 .244 .330 .389 0.7 -0.2 2.85 5.07
Carl Edwards Jr. .264 .340 .396 .243 .318 .435 0.7 -0.1 3.85 5.29
Kevin Herget .253 .308 .421 .264 .313 .413 0.7 -0.2 3.59 5.30
Joey Gerber .244 .319 .402 .244 .298 .419 0.7 -0.1 3.66 5.37
Huascar Brazobán .248 .344 .381 .231 .318 .362 0.9 -0.5 3.46 5.41
Luis García .277 .362 .410 .231 .306 .352 0.7 -0.2 3.30 5.26
Dylan Ross .238 .330 .386 .217 .300 .377 0.8 -0.4 3.43 5.11
Brendan Girton .258 .351 .437 .237 .333 .385 0.7 -0.3 4.55 5.64
Reed Garrett .239 .338 .403 .229 .309 .349 0.6 -0.3 3.24 4.97
Max Kranick .273 .325 .468 .241 .289 .398 0.5 -0.2 3.87 5.30
Richard Lovelady .219 .306 .313 .256 .323 .427 0.6 -0.3 3.44 5.15
Aaron Rozek .239 .302 .359 .281 .340 .488 0.7 -0.6 4.52 5.80
Adbert Alzolay .273 .342 .470 .222 .288 .375 0.5 -0.3 3.55 5.25
Luis Moreno .275 .364 .438 .249 .332 .411 0.7 -0.5 4.55 5.75
Jordan Geber .262 .333 .458 .274 .331 .425 0.4 -0.3 4.45 5.51
Dedniel Núñez .262 .342 .446 .224 .286 .382 0.5 -0.2 3.32 5.17
Austin Warren .225 .314 .393 .264 .333 .427 0.5 -0.4 3.87 5.45
Joe Jacques .221 .299 .309 .266 .345 .430 0.5 -0.4 3.62 5.12
Douglas Orellana .253 .342 .414 .236 .333 .425 0.5 -0.4 4.17 5.57
Colin Poche .229 .315 .438 .250 .319 .413 0.5 -0.4 3.68 5.47
Nate Lavender .250 .365 .386 .213 .311 .371 0.4 -0.3 3.58 5.29
José Castillo .231 .333 .327 .241 .323 .420 0.4 -0.4 3.61 5.34
Brian Metoyer .222 .347 .397 .233 .337 .356 0.4 -0.4 3.69 5.42
Ryan Lambert .244 .350 .453 .208 .306 .313 0.4 -0.5 3.89 5.36
Nick Burdi .234 .355 .406 .222 .321 .347 0.3 -0.5 3.64 5.80
Alex Carrillo .250 .348 .475 .218 .303 .333 0.3 -0.6 3.85 5.73
Saul Garcia .240 .354 .417 .233 .339 .388 0.3 -0.6 4.46 5.96
Frankie Montas .279 .365 .497 .246 .315 .408 0.4 -0.7 4.89 6.12
Carlos Guzman .263 .357 .455 .248 .326 .402 0.3 -0.6 4.39 6.00
Jefry Yan .200 .345 .289 .239 .355 .413 0.3 -0.6 3.93 5.95
Drew Smith .250 .348 .450 .244 .318 .436 0.2 -0.6 4.03 6.01
Matt Turner .234 .333 .375 .261 .352 .442 0.3 -0.6 4.42 5.82
Hunter Parsons .263 .373 .439 .227 .314 .413 0.1 -0.6 4.28 5.99
Joshua Cornielly .260 .345 .458 .243 .319 .408 0.2 -0.5 4.26 5.55
Robinson Martínez .232 .348 .411 .262 .355 .415 0.0 -0.5 4.31 5.78
Zach Peek .240 .333 .423 .267 .344 .431 0.3 -0.8 4.19 5.70
Trey McGough .241 .323 .328 .261 .346 .477 0.1 -0.6 4.42 5.82
Ben Simon .256 .337 .427 .253 .330 .414 0.0 -0.7 4.42 5.62
Daniel Juarez .240 .333 .400 .267 .356 .444 0.0 -0.5 4.45 5.55
Justin Garza .270 .357 .473 .260 .318 .440 0.0 -0.8 4.70 6.42

Players are listed with their most recent teams wherever possible. This includes players who are unsigned or have retired, players who will miss 2026 due to injury, and players who were released in 2025. So yes, if you see Joe Schmoe, who quit baseball back in August to form a Ambient Math-Rock Trip-Hop Yacht Metal band that only performs in abandoned malls, he’s still listed here intentionally. ZiPS is assuming a league with an ERA of 4.16.

Hitters are ranked by zWAR, which is to say, WAR values as calculated by me, Dan Szymborski, whose surname is spelled with a z. WAR values might differ slightly from those that appear in the full release of ZiPS. Finally, I will advise anyone against — and might karate chop anyone guilty of — merely adding up WAR totals on a depth chart to produce projected team WAR. It is important to remember that ZiPS is agnostic about playing time, and has no information about, for example, how quickly a team will call up a prospect or what veteran has fallen into disfavor.

As always, incorrect projections are either caused by misinformation, a non-pragmatic reality, or by the skillful sabotage of our friend and former editor. You can, however, still get mad at me on Twitter or on Bluesky. This last is, however, not an actual requirement.