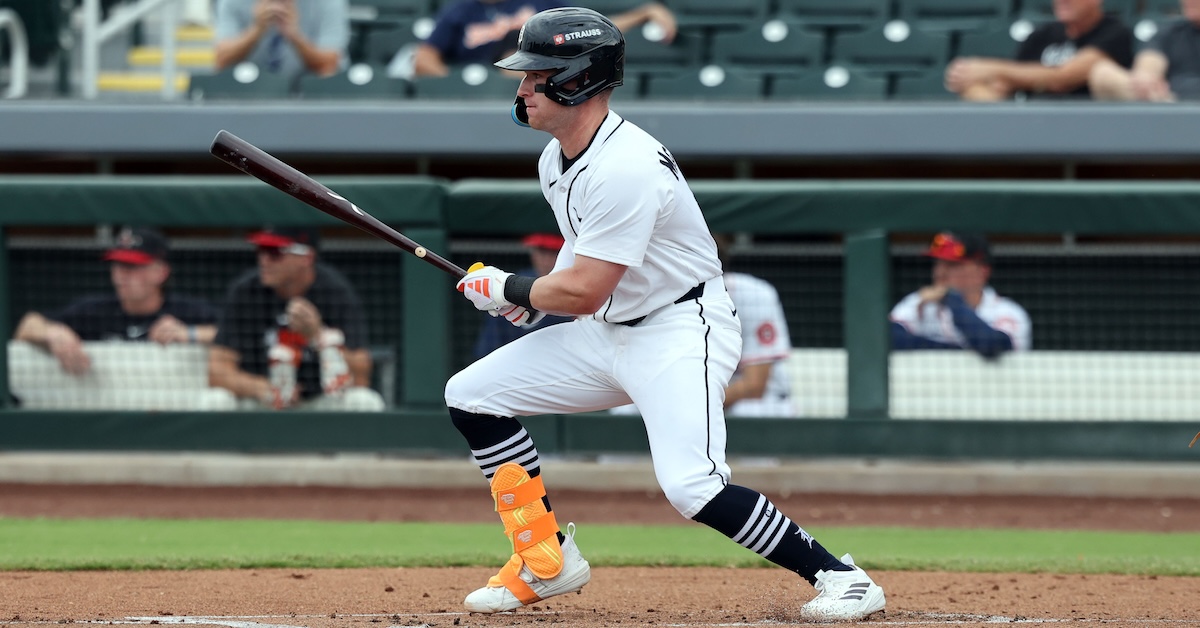
Quinn Priester is poised to take that next step and live up to his first-round pedigree. Opportunity paired with increased octane are among the reasons why. Drafted 18th overall by the Pittsburgh Pirates in 2019 out of Cary-Grove High School, the erstwhile Illinois prep stands a good chance of breaking camp in the Red Sox starting rotation. With Brayan Bello (shoulder) and Kutter Crawford (knee) likely to begin the season the injured list, Priester is well positioned to help fill the void.
The enhanced heater factors heavily into his hoped-for emergence as an established big-league hurler. The 24-year-old right-hander’s two-seamer averaged 93.1 mph last year, and this spring it has consistently been a few ticks higher. In his last outing, Priester topped out at 97.
“The cutter is getting better, but more than anything it’s been the velocity piece,” Priester said of his recent developmental strides. “We’re trying to see that trend upwards, and hold throughout games. I want to be 96-plus with the sinker, and then let everything else complement that pitch.”
Added muscle has contributed to the additional oomph. Acquired by Boston at last summer’s trade deadline in exchange for Nick Yorke, Priester currently carries 220 pounds on his 6-foot-3 frame, 10 more than a year ago. He’s evolving in other ways, as well. Increasingly mature, he’s learning the nuances of his craft. Read the rest of this entry »
Below is an analysis of the prospects in the farm system of the Atlanta Braves. Scouting reports were compiled with information provided by industry sources as well as my own observations. This is the fifth year we’re delineating between two anticipated relief roles, the abbreviations for which you’ll see in the “position” column below: MIRP for multi-inning relief pitchers, and SIRP for single-inning relief pitchers. The ETAs listed generally correspond to the year a player has to be added to the 40-man roster to avoid being made eligible for the Rule 5 draft. Manual adjustments are made where they seem appropriate, but we use that as a rule of thumb.
A quick overview of what FV (Future Value) means can be found here. A much deeper overview can be found here.
All of the ranked prospects below also appear on The Board, a resource the site offers featuring sortable scouting information for every organization. It has more details (and updated TrackMan data from various sources) than this article and integrates every team’s list so readers can compare prospects across farm systems. It can be found here. Read the rest of this entry »
As I write this, the winter free agency period has essentially drawn to a close. Out of the top 50 free agents I highlighted before the offseason began, 48 have found homes — sorry, David Robertson and Kyle Gibson. Per RosterResource, only five free agents – including the two holdovers from the top 50 – accrued 1 WAR or more in 2024 and haven’t yet signed new deals. In other words, all the signing that is going to happen basically has, so it’s time to look back and see how you and I did at predicting the deals players would sign.
I like to evaluate my own predictions in service of making better ones in the future, dividing them up into a few categories. First, I break signings down by position, because the market for relievers and second basemen is different. Second, I look at both average annual value and total guarantee. There’s no set ratio for how to relate those two, so looking at each independently seems best to me. Finally, I look at both the individual predictions (how close to the actual contract that a player signed my predictions came), as well as the overall trend (how my aggregate predictions for each position group did compared to the total amount they received).
This year, I made all of that back-checking more rigorous. I put all of my predictions, as well as every crowdsourced one, into a giant spreadsheet. I noted all the contracts that were signed, made adjustments for deferrals, and ignored non-guaranteed money. I compared each actual contract to our predictions. I also gathered some of the best non-FanGraphs predictions I could find, looking to outlets like ESPN, The Athletic, and MLB Trade Rumors. Below, you’ll find how both the crowd (you) and I did, as well as the best non-FanGraphs entrant in each category. Read the rest of this entry »
When David Appelman announced on Monday that we were adding college stats to our player pages and leaderboards, more than one person reached out to congratulate me personally. I had nothing to do with the conception or implementation of this blessed happening, but it is true: FanGraphs having college stats could not be more up my alley.
I wanted to play around with the new leaderboard, but this early in the season, there’s little to be gleaned. No pitcher has made more than four starts; no team has played more than 14 games. And most of the action we’ve seen so far has been nonconference throat-clearing, mismatches between blue bloods and mid-majors. The numbers will tell, but not for another few weeks.
So I decided to go back to the roots of the sabermetrics movement. Our college leaderboards might not have all the latest fancy Statcast stuff, but we’ve got FIP and K% and all sorts of things you wouldn’t take for granted if you’ve ever had to calculate a pitcher’s WHIP by hand on the back of a box score in a MAC press box. When we got all that stuff in the pro game, what did we do with it?
I got my start in baseball writing as a Cardinals blogger. That’s only natural – I’m a Cardinals fan. My dad grew up in St. Louis and passed it on to me. I’m still a fan, though certainly less than I was before I started writing about the sport as my full-time job. But whether you’re looking at it through the lens of a fan or just as an analyst, the trajectory of this always-competing, never-quite-dominant team has been fascinating to watch.
I had a strange feeling while watching the Redbirds last year. I kept wondering, “Why is this team full of old guys?” Ever since the 2011 World Series win, Albert Pujols’ first finale in St. Louis, the team always seemed full of young, devil-magicky contributors. An average Cards roster had a few recognizable stars plus a bunch of young guys you’d never heard of who were way better than you initially realized. Matt Carpenter and Michael Wacha were unexpected stars in 2013. Carlos Martínez and Kolten Wong came on strong. After a few years of missing the playoffs despite interesting young contributors (Tommy Pham, Randal Grichuk, Luke Weaver), the 2019 Cards coalesced around Jack Flaherty, Tommy Edman, and Paul DeJong.
You’ve heard of all of those players, of course, but at the time, they were young up-and-comers. The Cardinals never seemed to be old despite running out Yadier Molina and Adam Wainwright year after year. Those guys were a key veteran core, helping to spread the team gospel to the young horde backing them up. But even with those old hands running things, my view of the Cards as a youthful outfit was correct. From 2013 through 2018, St. Louis’ roster was younger than average every year. Then they were ever so slightly older than league average in 2019 and again in 2020. Read the rest of this entry »
Sorry, I’ve just always wanted to write that. I’ll tell you later on why I gasped. Let’s start here. Last Tuesday, while making his Grapefruit League debut with the Blue Jays, Max Scherzer challenged a pitch. Then he challenged the challenge system. Scherzer’s start against the Cardinals marked his first experience with the automated ball-strike system, which is being rolled out in some spring training facilities this year, continuing its inexorable, years-long creep toward implementation in regular season games. Scherzer, for one, does not welcome our new robot overlords.
On his 11th pitch, Scherzer fired a 1-0 fastball to Lars Nootbaar, just clipping the outside corner, at least according to home plate umpire Roberto Ortiz, an organic life form who uses an inefficient pair of weird, goo-filled orbs to assess pitches. Nootbaar – who, we should note, played some rehab games in Triple-A last season, and so was at least somewhat familiar with the challenge system – immediately patted his head. That’s the official way to request a challenge (though I would strongly encourage the league to require the player to rub their stomach with their other hand too). Scherzer, never a fan of waiting around when there’s pitching to do, canted his head from side to side like a racehorse in the starting gate. The machines spoke: The pitch was 2.3 inches off the plate, or as the humanoid Buck Martinez put it, “way outside.”
Just like Scherzer, this was my first experience with the challenge system, and I found the graphic adorable. That’s the point, I guess: implement an all-seeing eye that judges everything and everyone with detached, ruthless precision, then soften it with a lovable cartoon face. Scherzer recovered to strike out Nootbaar, then made his own challenge in the second inning. The right-hander, who tracks his pitches using the same goo-based technology as Ortiz, didn’t agree that he’d missed low with a 1-0 curveball to JJ Wetherholt, and he pounded the top of his cap like a bongo drum.
Reader, that’s when I gasped. Then I laughed. I gasp-laughed. According to the delightful ABS graphic, the pitch was hilariously low. It was nowhere near the strike zone. This pitch was in the Cactus League. It was so far away that Social Distortion wrote a song about it called “So Far Away.”
In fairness, we should acknowledge a few things. First, one of the consensuses that emerged during last year’s test of the challenge system was that team’s should disempower the pitcher from making them. Catchers are right there, and they have a much better sense of the actual location of the pitch. Second, Scherzer indicated after the game that the challenge was more an experiment than an expression of his certainty that the pitch had clipped the zone. “That was a rare occurrence for me, with a curveball down, to actually see if that’s actually a strike or not,” he said. You’re allowed to take that notion with a grain of salt. Part of me believes Scherzer, but, uh, he was bopping himself on the head with a lot of conviction.
We should also note that the steep shape of a curveball makes it hard for the pitcher in particular to judge the exact spot where it crosses the plate. The really interesting thing is that curveballs are actually relatively easy for umpires to judge. That’s not necessarily intuitive. Curveballs approach the plate at such a steep angle that they hit the catcher’s glove (or the dirt) far lower than they cross the plate, which might fool the umpire into thinking a pitch was lower than it was. And curveballs that come in at the very top of the zone leave the pitcher’s hand so high and possess such a loopy shape that they also might be hard to recognize as strikes. Where a fastball or cutter pushes straight through the zone cleanly, a breaking ball slices through it at an oblique angle, and it just seems logical that the more of the zone a pitch catches, the more likely it is that it will be recognized for doing so. But apparently that’s wrong. I broke down the 2024 stats for curveballs and fastballs (four-seamers, sinkers, and cutters) in three areas of the zone: the heart, the top and bottom of the shadow zone down the middle, and the top and bottom thirds of the zone down the middle. I’ve highlighted those areas in pink.
In all three areas, Curveballs had higher strike rates than fastballs. On pitches over the heart of the plate, it was a matter of a few tenths of a percent, but in the middle graph, curveballs were ahead 83% to 80%, and on the right it was 83% to 81%. Maybe it’s just that curveballs are easier to judge because they’re slower, but umpires are better at recognizing when they’re strikes, so in that sense Scherzer picked a bad pitch to challenge. However, much like Scherzer’s curveball, we’re drifting away from our main objective here. We’re focusing on how far the pitch was from the zone, and just to reiterate: It was far.
However, you might notice something about that graphic: There’s no distance measurement. When Nootbaar challenged in the first inning and earned his Nootbaal, the graphic zoomed way in to show us the exact size of the miss down to a tenth of an inch.
When Scherzer challenged, no measurement popped up, and I suspect that I know why. I think this is a deliberate decision made to avoid embarrassing a player who challenges a pitch that’s not particularly close. Nearly all challenges that end up as balls will show the miss distance. But if the pitch doesn’t even touch the shadow zone – that is, if it’s not even within one baseball-width of the strike zone – the graphic leaves off the exact distance so as to avoid blowing up the pitcher’s spot. Max Scherzer, trailblazer that he is, has showed us that although robots don’t feel, they can still be programmed to blush.
Don’t worry. We’re still going to blow up Scherzer’s spot. Because of all the cool graphics, it’s still really easy to get an exact measurement for pitches that land in the Zone of Embarrassment. We know the measurements of just about everything else on the screen. We know the strike zone is exactly 17 inches wide and the ball is approximately 2.9 inches wide, and through the magic of Statcast, we know that because Wetherholt is 5-foot-10, his strike zone is roughly 18.55 inches tall. I threw a screengrab into Photoshop, measured each of those constants, then used the ratio of pixels to inches to calculate the distance. The ball was 3.98 inches from the strike zone. It missed the shadow zone by more than an inch. It crossed the plate just over a foot off the ground.
That looks pretty damning, but allow me to blow your mind for a moment. If we’re being fair to Scherzer, we need to acknowledge that the pitch was actually much closer to the rulebook strike zone than Statcast makes it look. Let’s think about it under the rules of the current, non-computerized strike zone. Keep in mind that this was a curveball breaking downward. Now let’s look at the way that the Hawkeye cameras measure a pitch, courtesy of an MLB.com explainer by Anthony Castrovince.
Keep your eye on the diagram on the right. Statcast’s strike zone is two-dimensional, and it’s measured from the very center of home plate. That’s a perfectly reasonable way to design an ABS system – an earlier version was 3-D, so it seems safe to assume that this 2-D version is, for some tangible reason, an improvement upon it – but it’s not the way the strike zone has worked for the entirety of baseball history, including right now. The rulebook definition starts like this: “The STRIKE ZONE is that area over home plate…” and that’s really all we need to know. The strike zone is three-dimensional. It’s seven-sided, a pentagonal prism, and the ball just needs to clip any part of it in order to be a strike.
At The Athletic, Jayson Stark had the good fortune to be present in the clubhouse after the game, when Scherzer found out that the robo-zone didn’t match the rulebook zone: “Wait, I thought it was the whole plate,” he said. “So now we have to redefine what the strike zone is? You said it was a 3-D zone. Now we’ve got a 2-D zone? Hasn’t it always been a 3-D zone?” The answer to that question is yes. It has always been a 3-D zone and it still is, but now there’s also a 2-D zone. There are two strike zones. We’ll dig into the philosophical implications of this dichotomy later, but for now, that’s how umpires are judging pitches, so why don’t we try measuring things that way?
Let’s start with how curveballs work. Their path gets steeper and steeper as they approach the plate. There are plenty of reasons for this. Curveballs actually leave the pitcher’s hand traveling slightly upward; the classic way to recognize a curveball is seeing it jump up out of the pitcher’s hand. The magnus force created by the ball’s topspin pulls it downward, and that force compounds upon itself over the length of the pitch. Here’s where it starts. The baseball is traveling horizontally, and the topspin interacts with the air to start pulling it down.
Now it’s traveling at a steeper angle, but guess what? The topspin is still pulling it downward, so its angle is going to keep getting steeper and steeper as it goes.
Moreover, gravity amplifies this effect for a pitch that’s always breaking downward. Air resistance slows the pitch down as it nears the plate, but gravity is pulling the pitch downward at a constant rate. So say it takes a tenth of a second for the ball to travel the first 10 feet toward home plate, and in that time, gravity pulls it down five centimeters. By the time it reaches the plate, it’s going slower, so over the last tenth of a second, it only travels eight feet, but gravity is still pulling it down five centimeters. All the numbers in this example were completely made up, but you get the point; the ratio of downward movement to horizontal movement is increasing. A curveball’s approach angle keeps getting steeper. You can see it in Statcast’s 3-D pitch visualizations.
These are two actual Scherzer curveballs from last year. We’re going to focus on the bottom one, which came in a bit below the plate. The red line shows a straight line between the position of the ball when it crosses home plate and the position when it’s 50 feet away.
Now, let’s zoom in and look at the path of the pitch over the last few feet of its journey. As you can see, our new purple line is significantly steeper.
None of this should be particularly surprising if you’re familiar with Alex Chamberlain’s primer on vertical approach angle, but the point is that curveballs, with their sharp downward movement compounded by gravity, are the steepest pitches of all. According to Alex’s pitch leaderboard, Scherzer’s curveball averaged a vertical approach angle of -9.9 degrees last season. For now, let’s assume this pitch had the same VAA. With help from our friend Pythagoras, we can calculate that a pitch traveling at an angle of -9.9 degrees would be 1.48 inches higher when it crossed the front of the plate than when it crossed the middle of the plate. Here’s how that works.
OK, so measuring at the front of the plate, the pitch comes in 1.48 inches higher. It’s now missing the zone by just 2.50 inches. It’s well within the shadow zone. That certainly makes it sound a little closer, don’t you think? Here’s what that looks like in our original diagram.
You know what? It’s still pretty far away from the strike zone. Stark’s article mentioned that after the game, reporters told Scherzer that his pitch would have been a strike according to a 3-D zone. They were way off base. In order to do so, the pitch would have had to arrive at the plate with an absurd VAA of 25 degrees. That ain’t happening. This pitch is still unequivocally a ball. There’s no system – goo-based, camera-based, vibes-based, none – in which this pitch hits in the strike zone. It was so far away that Carole King wrote a different song about it, also called “So Far Away.”
That said, I do suspect that this particular curveball actually had a steeper VAA than -9.9 degrees, making it a bit closer than the graphic above indicates. Just using the old-fashioned goo-orb test, it looked sharper than the typical Scherzer curveball. Second, I was talking things over with Michael Rosen, our resident pitching genius, and he got curious and pulled data for a Scherzer curveball, just one random curve from 2023. That pitch had a VAA of -10.1 degrees over the last 10 feet.
That VAA would move Scherzer’s pitch a few hundredths of an inch closer to the zone, and this one solitary, particularly sharp curve could’ve been even closer. It’s still not a strike according to any definition of the strike zone, but it highlights the disconnect between the two current competing versions.
So far we’ve only been talking about the front of the plate, but this would also be true of both the back and the sides. A pitch with a steep horizontal approach angle can clip the corner of the plate before it reaches the midpoint. The back gets tricky because of the plate’s pentagonal shape, but it’s still possible; the closer to the center a high pitch is located, the better a chance it will have of dropping down and catching a piece of the rulebook zone. ABS would tell you that every one of the pitches illustrated below is a ball. But according to a normal three-dimensional strike zone – which is what umpires are calling – that’s not actually true. It’s smaller than the rulebook zone.
As things stand, when the league does implement an ABS challenge system for regular season play – and at this point, that seems like a virtual certainty, though which regular season is still undecided – then the game will officially have two different strike zones. It’s possible that the league could change the rulebook definition for umpires so that it matches the Statcast zone, but that strikes me as unlikely for many reasons, chief among them it would essentially turn the iconic shape of home plate into a vestigial appendage. In the two-zone world – the world that Triple-A players have been living in for a while now – a pitcher would be able to throw a strike, get robbed by the umpire, challenge that incorrect call, and lose the challenge because according to the robot umpire, the pitch really was a ball. Even crazier, the pitcher will throw a strike, the umpire will get the call right, and then the batter will challenge it and that correct call will get overturned! The umpire and the computer will make two different calls, and both will be correct because they’ll have two different zones.
As the numbers from our curveball example show, we’re not talking about a couple of unlikely edge cases. The differences in movement from the front and back of the plate to the middle aren’t minuscule. Some pitchers’ curves average above 11 degrees of VAA, and the sweepiest sweepers average more than six degrees of horizontal approach angle. We’re often going to be talking about well over an inch of difference. This is going to happen all the time. I’m not the first person to notice this. On Wednesday, Baseball Savant’s Tom Tango crunched the numbers and announced that in 2024, one percent of all takes would have fallen into this category, just for issues with the front and back of the plate.
As things look right now, baseball will soon officially have a human strike zone and a robot strike zone. The robot strike zone will be so thin as to be non-existent, while the human strike zone, as it always has, will be shaped like an infinite number of infinitely thin home plates. Honestly, I don’t know how any pitcher who’s had it fully explained to them will avoid succumbing to paralysis halfway through their windup and toppling off the mound simply because they’ve exhausted their ability to process the disjuncture of the situation.
I mentioned earlier that setting up the robo-zone in two dimensions rather than three was a perfectly reasonable choice. The more I think about it, however, the more I think it might be the only reasonable choice. Calling balls and strikes is incredibly difficult. I’ve had to do it before, and I’d approximate that I felt 100% certain on about 30% of the pitches I called. But even then, I doubt I was really thinking about the strike zone the way the rulebook demands. The rulebook zone doesn’t have four corners; it has 10 corners. And it doesn’t have an edge; it has 15 edges. The difference between a two-dimensional plane and a three-dimensional space is the difference between a topographical map and a mountain.
On the one hand, this makes me wish the robo-zone were three-dimensional, just because I’m imagining how much more fun the challenge graphics would be. We’d see in precise cartoon glory not just whether the ball nicked the corner of a box, but one particular corner of a 10-cornered pentagonal prism. It would rule. On the other hand, it’s absolutely preposterous that we ask human beings to process information with anything approaching this level of precision. Wherever you’re sitting right now, try to imagine a pentagonal prism floating in the air next to you. Now try to picture yourself deciding whether a Tarik Skubal fastball nicked one of its seven sides. Now do it again, but first squish your prism down a bit because Nick Madrigal is up next. So maybe it does make sense to have two zones; we’ve just got them reversed.
Scherzer was candid and engaging with reporters, and after processing all of this information, he closed with the takeaway that most of us saw in the headlines: “Can we just play baseball?” he asked. “We’re humans. Can we just be judged by humans? Do we really need to disrupt the game? I think humans are defined by humans.” When he puts it that way, it’s a pretty reasonable request. Right now, umpires and batters track pitches using the exact same equipment, and that makes plenty of sense. If the game is played by humans, it’s certainly not laughable to feel that human eyes and brains should be deciding what’s a strike and what’s a ball. I don’t mean to say that there’s wisdom in every mistake simply because it’s made by a human, but once a computer is making the decisions, the objective of the game becomes slightly less fun, for the same reason that playing chess against the computer isn’t particularly enjoyable. It becomes less of a game and more of a problem solving exercise.
These days, there’s no end to the ways that computer programs are judging us – CAPTCHA requests, Spotify recommendations, suspicious login emails, targeted advertising, personalized search results, automated insurance denials, the artificially indiscriminate firings going on throughout the federal government – and with vanishingly few exceptions, the people being judged would like nothing better than to smash all of these robot judges with a hammer.
Don’t get me wrong, I would love to smash the computers that turned Google into such a joke with a hammer, but the difference here is that many of those systems were designed as shortcuts, either to save time, to replace human workers, or to shift accountability away from the person instituting a crappy policy and onto the circuit board that implements it. On the other hand, the challenge system is a particularly elegant solution to the problem at hand. It will introduce an extra layer of accountability into umpiring without replacing the umpires or undermining their centrality to the game. It won’t obliterate the value of pitch framing, but it will hopefully reduce the amount of shouting umpires have to bear. Now that we have the ability to know the exact location of every pitch, it’s probably not completely defensible to just ignore that knowledge. Instant replay was instituted for the same reason. “I like it when somebody screws up and somebody gets screwed over” is not exactly a winning campaign pitch.
Let me hit you with one last disconnect. The really funny thing is that depending on how you look at it, Scherzer is both the best and worst messenger for this argument. He’s a sure-fire Hall of Famer and a longtime union rep. He’s not afraid of a fight, and his standing in the game ensures that when he speaks, people will listen. His comments warrant plenty of counterarguments, but “Max Scherzer doesn’t know what he’s talking about” is not among them.
On the other hand, Scherzer has never had that much use for umpires in the first place. Since Sports Info Solution started tracking pitches in 2002, 328 pitchers have thrown at least 800 innings. Scherzer’s 14% swinging strike rate ranks ninth among them and his 27% whiff rate ranks 19th. His 17% called strike rate, however, ranks all the way down at 212th. Scherzer has always succeeded by racking up whiffs, pumping his fastball by hitters and tempting them into chasing sliders and curves. Relying on the umpire for called strikes has never remotely been his game. In fact, since 2008, Statcast says he’s had 1,262 would-be strikes stolen from him, third-most in all of baseball. Few players have relied less on human umpires or accumulated more reasons to be fed up with them than Scherzer. Maybe we should tell him that after his next start. I’m sure he’ll have something interesting to say about it.
Drake Baldwin is one of baseball’s most-promising prospects. A third-round pick in 2022 out of Missouri State University, the 23-year-old catcher in the Atlanta Braves organization is No. 11 on our Top 100. His left-handed stroke is a big reason why. Flashing plus power, Baldwin bashed 16 home runs last season while logging a 119 wRC+ between Double-A Mississippi and Triple-A Gwinnett.
He could have pursued a career in another sport. All-State in hockey as a Wisconsin prep, the sturdily-built Madison West High School product potted 43 goals as a junior, then found the back of the net 46 times as a senior.
Why did he choose the diamond, and not the ice?
“Hockey recruiting is a little later, so I didn’t actually talk to many colleges,” Baldwin said of his decision. “I think I had a chance, and the [junior hockey] route was interesting too, but being able to go right from high school to college and start working on a degree was a more straightforward path to where I wanted to be. I mean, I love both sports. I wish I could play both of them. Baseball just came first.” Read the rest of this entry »
Below is an analysis of the prospects in the farm system of the Tampa Bay Rays. Scouting reports were compiled with information provided by industry sources as well as our own observations. This is the fifth year we’re delineating between two anticipated relief roles, the abbreviations for which you’ll see in the “position” column below: MIRP for multi-inning relief pitchers, and SIRP for single-inning relief pitchers. The ETAs listed generally correspond to the year a player has to be added to the 40-man roster to avoid being made eligible for the Rule 5 draft. Manual adjustments are made where they seem appropriate, but we use that as a rule of thumb.
A quick overview of what FV (Future Value) means can be found here. A much deeper overview can be found here.
All of the ranked prospects below also appear on The Board, a resource the site offers featuring sortable scouting information for every organization. It has more details (and updated TrackMan data from various sources) than this article and integrates every team’s list so readers can compare prospects across farm systems. It can be found here. Read the rest of this entry »
I haven’t been to a spring training game since 2011. I don’t remember the game as well as I remember the events that led up to it. I’d spent two years temping at a bank depository near JFK airport, tracking the transactions of gold, silver, platinum, and palladium bars. Losing track of a gold bar worth half a million dollars wasn’t really an option, so it was a pretty high-pressure job for a 25-year-old making $19 an hour. Because we had to know the market price of gold at all times, I can tell you that for each month I worked, I earned the equivalent of a single gold coin. I gave my notice in January, and in February I took my meager savings and booked a trip across the country by Greyhound bus. After I wore out my welcome with my sister in California, I visited my friend Alex in Arizona and we caught a Reds game at Goodyear Park. Yesterday, I dug up an email exchange from when I was planning my escape. Alex asked how long I expected to be gone; were we talking days or weeks? “We are talking weeks,” I wrote back. “We are talking about quitting my job and getting the f*** out of here.”
This long walk of a lede is intended to introduce two themes. The first is that most fans don’t get to see much of spring training. We’ve only got so many vacation days, and most of us don’t live near Florida or Arizona. All the games are day games, and even when they’re televised, we can’t exactly watch them in the middle of a work day. I’d venture to say that I’m a pretty big baseball person, and it took a minor existential crisis to get me to my one and only Cactus League game. As a result, spring training is both the time when we’re thirstiest for baseball news and the time when we’re most dependent on beat writers for it.
As always, beat writers are watching the games we can’t and talking to the players and coaches. They’re also getting a much more expansive view than they have during the regular season. They’re observing on the backfields during bullpen sessions, infield drills, live batting practice, and the occasional cabbage race. You might hear through a team spokesman that Rafael Devers has started taking grounders, but a beat writer like Jen McCaffrey, who covers the Red Sox for The Athletic, can put you right there, watching Devers scoop balls off a strip of turf tucked behind a metal fence, with Kristian Campbell looking on and Vaughn Grissom shooting baskets while he waits his turn.
“I knew that Devers would be doing some of his separate,” McCaffrey told me, explaining how she prepared to get that shot. She left the team’s clubhouse availability early to make sure that there was a spot from which she could film him. Given the awkward location, she couldn’t do much about the quality of the video, but she knew that any news about Devers would be welcome. “I figured people are probably interested. What’s he doing? How’s he preparing? People have a lot of questions about him.”
That brings us to our second theme, which is mission creep. I’ve been thinking about it a lot during spring training, specifically because of videos like that one. I first heard the phrase in a book about the space shuttle program – astronauts trying to keep their schedules from getting so overloaded with experiments that they wouldn’t be able to keep up – but mission creep can come in many forms. I think about it most often in a work context. You start a job with a certain set of responsibilities, but somehow, you just keep accumulating new ones until you’re completely buried. When I started at the bank depository in 2009, my job was to help out with the paperwork on trades. I was just an extra pair of hands, and not a particularly busy pair. “You should probably bring a book,” my boss told me on my first day.
Sitting at my desk – a plastic folding table that generated enough static electricity to solve the global energy crisis – I read the complete works of Shakespeare cover to cover. I read the “Iliad” and the “Odyssey” and Infinite Jest, but I also started to get busier. By the time I gave my notice, I had been told to knock it off with the reading. I was using four redundant systems to track the thousands of bars and coins that entered and exited the warehouse. I tracked them on paper, and on a creaky — literally — IBM ThinkPad from the 1990s, I tracked them in a gargantuan Excel spreadsheet, a 1970s computer program straight out of Apollo 13 mission control, and a new, web-based program that didn’t quite work yet.
For beat writers, technology and social media are huge sources of mission creep. Over the past several years, it’s become standard for writers to respond to fan questions on social media, as well as to post pictures and video from batting practice, live play-by-play of the game, and the most interesting quotes from their pre- and post-game interviews. It’s a huge amount of work, and it steals time away from the core job of writing about the team. This article is specifically about pictures and videos from spring training, which have proliferated in recent years. When Blue Jays pitchers and catchers reported to Dunedin, MLB.com’s Keegan Matheson posted long videos of bullpen sessions from directly behind the catcher. Curious how Max Scherzer would look coming off an injury-riddled 2024 season? You could judge the break on his changeup and see the life on his fastball for yourself, because Matheson was willing to stand there keeping his phone’s camera lens perfectly aligned with a hole in the chain link fence as 93-mph heaters bore down on him.
After growing in popularity of for years, this kind of video has reached critical mass. For the last two weeks, my Bluesky feed has consisted of two things and two things only: soothing videos of ballplayers beneath blue skies, tuning up for the season on quiet backfields, and frantic missives documenting the collapse of American democracy. I reached out to several writers to talk about these videos, both because I can’t get enough of them and because this is more fun to talk about than the second thing.
The first thing I learned is that this particular form of mission creep is not mandatory. Everyone told me that while finding new ways to engage with potential readers is obviously a good thing, it’s not something they’re asked to do, and several mentioned that Twitter doesn’t generate much traffic for their publications anymore. Still, the practice has become standard. Spencer Nusbaum, who covers the Nationals for the Washington Post, told me in an email that he started taking videos as a way to reinforce his handwritten notes, but “started posting (some of them) because other people were doing it.” Said McCaffrey, “When I started covering the team 10, 11 years ago, I think it was out there, but I feel like over the past decade or so, it’s definitely become a thing that beat writers have leaned into.” Andy Kostka, who covers the Orioles for The Baltimore Banner, called it “a practice I do without stopping to wonder why.”
The obvious appeal is that after a long offseason, people really want to know what’s going on with their team. “It’s mostly a spring training thing for me,” said Peter Abraham, the Boston Globe’s baseball columnist, in an email. “People seem to like seeing the players for the first time in a while, the new guys especially.” Beat writers tend to hear plenty of criticism about their coverage of the team, so the opportunity to deliver something that people are truly excited to see is gratifying. “Especially at this time of the year,” Kostka said in a DM, “the dopamine hit of sending a video and seeing fans super amped for a rudimentary task is pretty great. Video of someone lightly tossing a baseball? Some guy replies: ‘This gave me life.’ … It helps me a little remember that I’m pretty lucky to do this.” Dan Hayes, who writes about the Twins for The Athletic and has been covering spring training since 2007, reminded me in a DM that, like most baseball writers, he started out as a huge fan: “I’m afforded access that most fans will never experience. Not only does the company send me to Florida at a time where 99 percent of my followers are freezing, but I’m allowed into certain areas of the park that [are] restricted to fans. Giving them a sense of what goes on here is fun.”
As Hayes mentioned, the videos also show us a part of the game that we just don’t get to see. The jobs of players and coaches look very different during the first few weeks of spring training, and we only glimpse them through this particular form of media. “The access is great,” said Nusbaum, who noted that he’s sometimes so close to the action that he has to be careful about blocking the view of the coaching staff. “The press box at Nationals Park is a million feet in the air when the games are going on. Also, we’re typing away as the action is happening during the season. We can be a few feet away from the action here, unencumbered by laptops. We can see, for instance, what the pitching coach is trying to teach 15 feet away. It’s fun to document that visually.”
The access doesn’t always mean that the videos are easy to get, however. Sometimes phones break or run out of memory. Sometimes it’s just awkward. “Trying to record through holes in the fence from a pretty bad angle,” Nusbaum said. “Yeah, that’s absolutely the worst part.” The extra work that goes into this also presents an extra opportunity for critics. “I’ve had fans yell at me more so for quality,” said McCaffrey. “One guy was like, ‘You need to do horizontal instead of vertical video,’” she said, laughing. “I was like, ‘OK, alright. Calm down, buddy.’”
During the regular season, a player can make 600 plate appearances, but as the pictures and video demonstrate, spring training is its own kind of pressure cooker. During live BP, it’s not at all uncommon to see the entire coaching staff, prominent members of the front office, and a cadre of players posted up directly behind the catcher, watching intently through the legs of the extra-large tripod that holds the portable Trackman unit.
Said McCaffrey, “I don’t know how other teams do it, because obviously I’m following the Red Sox throughout the spring, but every time a guy pitches, pretty much the entire pitching staff comes out and watches him. It’s kind of interesting and a camaraderie thing.” At Jet Blue Park in Fort Myers, she stayed zoomed out for several videos of live BP. The skewed angle allowed her to capture the action on the field, some of the prominent spectators, and the live Trackman feed on the right field scoreboard. Not only could you watch Garrett Crochet dispose of Roman Anthony, but six days after pitchers and catchers reported, you could see that he was already in midseason form, his four-seamer hitting 97 mph with 15 inches of induced vertical break. “That’s also something I like to try to get in there too,” she said, “so fans that are into the analytics side of the game can see some of the numbers of what guys are working on in practice, and how pitches are landing or moving.”
At the same time, there’s so much going on throughout the complex that writers also have the chance to catch something no one else sees. “You never know when something is going to add some color to your story,” Nusbaum said. “In spring training, because of the access, because you can head over to a backfield that no one else is at or talk to the prospect that you might only see once during the actual season, you can get some truly unique scenes.” He often keeps those moments off social media, stashing them in his back pocket for use during the grind of a long season. “That might seem counterintuitive, vis a vis engaging with fans. But at the end of the day, my primary job is to write, and sometimes I want to save a video until the story is out. Because there’s probably context there that fits with a story rather than a tweet.”
What I personally love the most about these videos is the fact that they look like what they are: cell phone videos taken by regular people. “I don’t have the best technology,” said McCaffrey. “It’s just my iPhone, so it’s not like I can do too much about that.” I think we tend to forget about how beautifully baseball is packaged most of the time. The picture at the top of every article was selected by an editor from a dozen competing options, all of them taken by a ridiculously talented professional sports photographer with a shelf full of awards at home. The same goes for the camera operators who shoot the games for television, and they’re just part of a production team brandishing the latest technology to make the game look gorgeous. John DeMarsico, who directs Mets broadcasts for SNY, is fond of saying that baseball is cinema, and that’s never been more true. But for these few weeks during spring training, we get to see it through a less cinematic, more personal lens. We see it in 12-second clips with the wind whipping in the background, shot on whichever phone a reporter has in their pocket, from whatever odd angle they can finagle.
For a couple weeks, we get to see the game through a completely different lens, both literally and figuratively (or as the kids say, flitteratively). I don’t mean to say that the gorgeous version of baseball that we see for most of the year isn’t real, but it is undeniably stylized. Even on a quiet getaway day, it’s presented with grandeur. It feeds into the mythos of the game, the idea of baseball, the one you can’t not be romantic about. I just enjoy seeing the scruffy edges. Sure, baseball is an idea, but they make it feel more real to me, more personal.
Even when I explained it to them, people had trouble wrapping their heads around my job at the bank depository. When you think about investing in gold, you probably just imagine clicking a button on the computer or asking a financial advisor to click a button on the computer. An extra graph appears on your Charles Schwab splash page; now you’ve invested in gold. To you, it’s just the idea of gold. But it’s also real, and not particularly glamorous. You have to buy it on the commodities exchange and pay a storage fee. I sat in a gross, windowless office next to a gross, windowless warehouse stacked high with pallets of tarnished 1,000 ounce silver bars. For a couple years, when your financial advisor clicked that button, I would end up getting a fax, writing a transfer order, logging it in four separate places, and handing a carbon copy to Sylvia, who handed it to Garry, who handed it to Mike, who carried a specific gold bar from one part of the vault to another. “It’s sort of like if you traded for Derek Jeter on your fantasy team,” I’d explain, “and then a clubhouse attendant had to load him up on a cart and wheel him over to the other side of the locker room.”
“There are two types of realist,” Robert Frost wrote. “The one who offers a good deal of dirt with his potato to show that it is a real potato. And there is the one who is satisfied with the potato brushed clean. I am inclined to be the second kind. To me, the thing that art does for life is to clean it, strip it to form.” I’m inclined to be the first kind. I can’t help it. I like hearing the strings squeak as the guitarist’s fingers scramble up the fretboard. It makes me feel like I’m there in the room. I love that there’s a little window of time when baseball’s acres and acres of dirt don’t get cleaned up. “I’m certainly not a good photographer,” Abraham said. “If I like a photo I’ll post it. That’s really about it. Once the games start and people can watch NESN, I’ll dial back unless it’s something unusual.”
On my last day at work, my colleagues Chubby and Sylvia gave me a going away present: a one-ounce bar of silver. I’ve still got it. At Goodyear Field, Alex and I were excited to see Aroldis Chapman throw a ball faster than anyone else on earth could throw a ball, and, if my memory’s right, I think we did. I remember walking across the grassy parking lot. I remember eating chili dogs in the shade of the concession stand, so focused on not spilling anything on our clothes that we didn’t notice the foul ball coming until it landed right at our feet and caromed off the wall right in front of our faces.
The Blue Jays were posting live batted ball data during batting practice, and this is indeed cool. At the absolute worst, this is an interesting bit of information for anyone who happens to be hanging around. We all have varying appetites for data while consuming sports, but I don’t know anyone who sees a hitter put a ball in the seats and doesn’t immediately think, “I wonder exactly how far he hit that.” Read the rest of this entry »