Archive for Featured

Mariners Grab Luis Castillo From Reds in Five-Player Deal

Luis Castillo
The Enquirer

After a small amuse-bouche in the form of an Andrew Benintendi trade to get our deadline appetites drooling in anticipation, the Mariners have served up a mighty entrée in the form of landing Luis Castillo, arguably the best pitcher plausibly available this week, in a late Saturday trade. Heading the quartet of players heading to Cincinnati is shortstop Noelvi Marte, the No. 11 prospect both on the midseason update on The Board and in my preseason ZiPS Top 100 Prospects. Joining Marte is shortstop Edwin Arroyo, starting pitcher Levi Stoudt, and reliever Andrew Moore.

Castillo’s season got off to a rocky start thanks to lingering issues with a sore shoulder. Those are always concerning, but he was able to debut in early May after a thankfully eventless rehab stint. After some spotty command in his first game back, he’s been absolutely solid, making his second All-Star team this year; in 14 starts for the Reds, he has struck out 90 batters against 28 walks, putting up an ERA of 2.86, a FIP of 3.20, and 2.1 WAR. That’s enough for 16th in the NL despite Castillo not debuting until Cincinnati’s 29th game. While it wouldn’t impress Old Hoss Radbourn or Amos Rusie, Castillo is a workhorse by 2022’s standards, finishing the fifth inning in every start since his first one and boasting a streak of four consecutive games of at least seven innings, with three of the four opponents (Braves, Rays, Yankees) being quite dangerous.

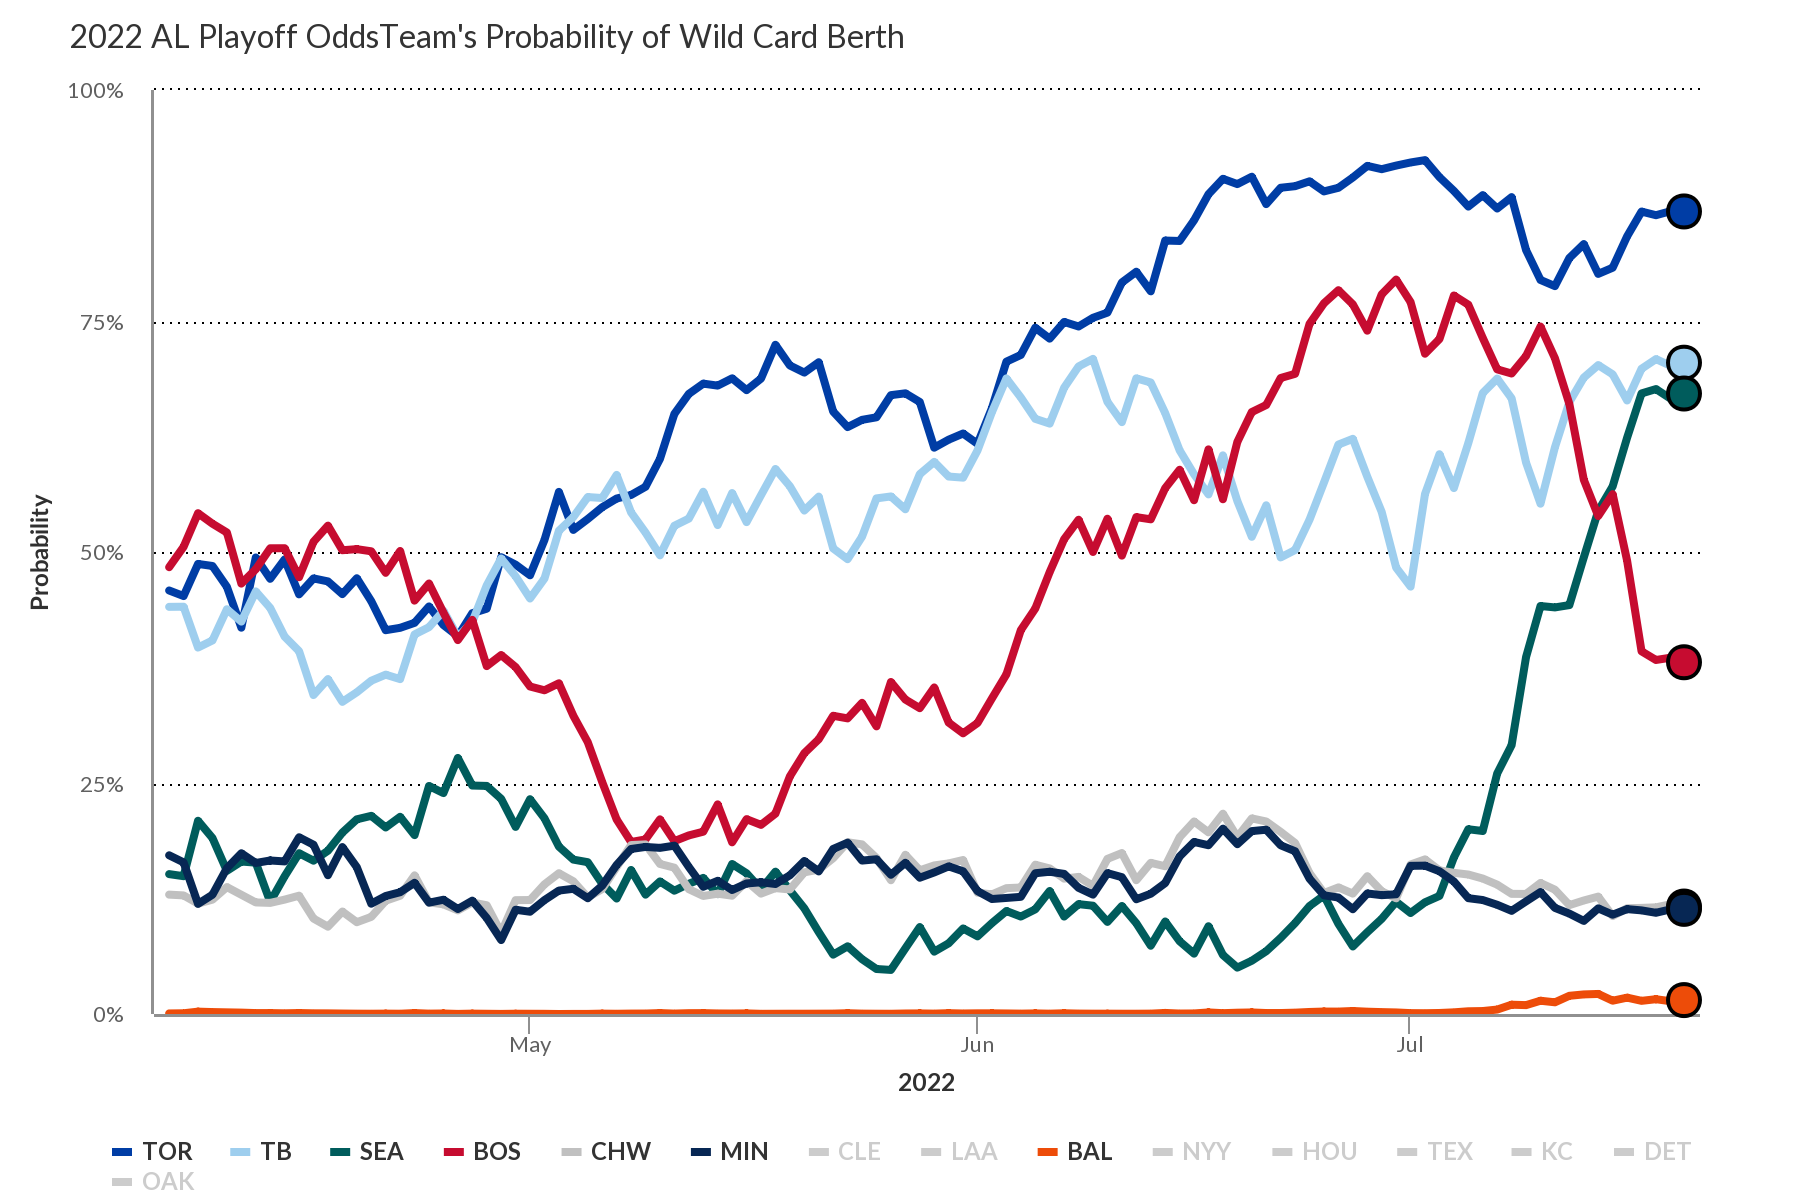
Naturally, landing Castillo makes Seattle’s rotation a considerably more dangerous unit. ZiPS gives it an even bigger boost than our depth charts do, bumping it from 18th in the league in projected rest-of-season WAR to 10th. Overall, ZiPS thought the Mariners were a .527 team going into the season, and now my projections see them as a .545 team with an 84% chance of making the playoffs, up from 76%. This move is more about making the team as dangerous in the playoffs as possible; the Mariners could add Juan Soto, too, and the math of an 11-game deficit would still make winning the AL West a tough road.

As exciting as it is to see the Mariners do whatever they can to push themselves over the top this season, this move may even be a bigger deal for the 2023 season. Pencil in $15 million for Castillo’s salary, and the M’s have a committed luxury tax number of just around $115 million, with only Adam Frazier and Mitch Haniger as significant free agents. Having a solid rotation already put together gives Seattle nearly unlimited options this winter.

ZiPS Projection – 2023 Mariners Rotation
Player W L ERA G GS IP H ER HR BB SO ERA+ WAR
Luis Castillo 13 7 3.09 28 28 163.0 133 56 13 59 177 135 4.1
Robbie Ray 12 9 3.44 31 31 183.3 141 70 28 57 230 121 3.9
Logan Gilbert 11 9 3.79 30 30 159.0 145 67 22 45 159 110 2.8
George Kirby 6 6 3.95 25 25 134.3 129 59 25 22 137 105 2.1
Chris Flexen 9 9 4.34 29 27 151.3 157 73 21 44 113 96 1.7
Marco Gonzales 10 11 4.66 27 27 148.7 152 77 26 47 101 89 1.1

Read the rest of this entry »


2022 Trade Value: #1 to #10

As is tradition at FanGraphs, we’re using the lead-up to next week’s trade deadline to take stock of the top 50 players in baseball by trade value. For a more detailed introduction to this year’s exercise, as well as a look at the players who fell just short of the top 50, be sure to read the Introduction and Honorable Mentions piece, which can be found in the widget above.

For those of you who have been reading the Trade Value Series the last few seasons, the format should look familiar. For every player, you’ll see a table with the player’s projected five-year WAR from 2023-2027, courtesy of Dan Szymborski’s ZiPS projections. The table will also include the player’s guaranteed money, if any, the year through which their team has contractual control of them, last year’s rank (if applicable), and then projections, contract status, and age for each individual season through 2027, if the player is under contract or team control for those seasons. Last year’s rank includes a link to the relevant 2021 post. Thanks are due to Sean Dolinar for his help in creating the tables in these posts. At the bottom of the page, there is a grid showing all of the players who have been ranked up to this point.

Now, let’s get to our final batch of players. Read the rest of this entry »


2022 Trade Value: #11 to #20

Design by Luke Hooper.

As is tradition at FanGraphs, we’re using the lead-up to next week’s trade deadline to take stock of the top 50 players in baseball by trade value. For a more detailed introduction to this year’s exercise, as well as a look at the players who fell just short of the top 50, be sure to read the Introduction and Honorable Mentions piece, which can be found in the widget above.

For those of you who have been reading the Trade Value Series the last few seasons, the format should look familiar. For every player, you’ll see a table with the player’s projected five-year WAR from 2023-2027, courtesy of Dan Szymborski’s ZiPS projections. The table will also include the player’s guaranteed money, if any, the year through which their team has contractual control of them, last year’s rank (if applicable), and then projections, contract status, and age for each individual season through 2027, if the player is under contract or team control for those seasons. Last year’s rank includes a link to the relevant 2021 post. Thanks are due to Sean Dolinar for his help in creating the tables in these posts. At the bottom of the page, there is a grid showing all of the players who have been ranked up to this point.

Now, let’s get to the next batch of players. Read the rest of this entry »


2022 Trade Value: #21 to #30

Design by Luke Hooper.

As is tradition at FanGraphs, we’re using the lead-up to next week’s trade deadline to take stock of the top 50 players in baseball by trade value. For a more detailed introduction to this year’s exercise, as well as a look at the players who fell just short of the top 50, be sure to read the Introduction and Honorable Mentions piece, which can be found in the widget above.

For those of you who have been reading the Trade Value Series the last few seasons, the format should look familiar. For every player, you’ll see a table with the player’s projected five-year WAR from 2023-2027, courtesy of Dan Szymborski’s ZiPS projections. The table will also include the player’s guaranteed money, if any, the year through which their team has contractual control of them, last year’s rank (if applicable), and then projections, contract status, and age for each individual season through 2027, if the player is under contract or team control for those seasons. Last year’s rank includes a link to the relevant 2021 post. Thanks are due to Sean Dolinar for his help in creating the tables in these posts. At the bottom of the page, there is a grid showing all of the players who have been ranked up to this point.

Now, let’s get to the next batch of players. Read the rest of this entry »


2022 Trade Value: #31 to #40

Design by Luke Hooper

As is tradition at FanGraphs, we’re using the lead-up to next week’s trade deadline to take stock of the top 50 players in baseball by trade value. For a more detailed introduction to this year’s exercise, as well as a look at the players who fell just short of the top 50, be sure to read the Introduction and Honorable Mentions piece, which can be found in the widget above.

For those of you who have been reading the Trade Value Series the last few seasons, the format should look familiar. For every player, you’ll see a table with the player’s projected five-year WAR from 2023-2027, courtesy of Dan Szymborski’s ZiPS projections. The table will also include the player’s guaranteed money, if any, the year through which their team has contractual control of them, last year’s rank (if applicable), and then projections, contract status, and age for each individual season through 2027, if the player is under contract or team control for those seasons. Last year’s rank includes a link to the relevant 2021 post. Thanks are due to Sean Dolinar for his help in creating the tables in these posts. At the bottom of the page, there is a grid showing all of the players who have been ranked up to this point.

One note on the rankings: particularly at the bottom of the list, there isn’t a lot of room between the players. The ordinal rankings clearly matter, and we put them there for a reason, but there’s not much of a gap between, say, the 35th ranked player and 50th. The magnitude of differences in this part of the list is quite small. Several folks I talked to might prefer a player in the honorable mentions section to one on the back end of the list, or vice versa. I think the broad strokes are correct — but with so many players carrying roughly equivalent value, disagreements abounded. Read the rest of this entry »


2022 Trade Value: #41 to #50

Design by Luke Hooper

As is tradition at FanGraphs, we’re using the lead-up to next week’s trade deadline to take stock of the top 50 players in baseball by trade value. For a more detailed introduction to this year’s exercise, as well as a look at the players who fell just short of the top 50, be sure to read the Introduction and Honorable Mentions piece, which can be found in the widget above.

For those of you who have been reading the Trade Value Series the last few seasons, the format should look familiar. For every player, you’ll see a table with the player’s projected five-year WAR from 2023-2027, courtesy of Dan Szymborski’s ZiPS projections. The table will also include the player’s guaranteed money, if any, the year through which their team has contractual control of them, last year’s rank (if applicable), and then projections, contract status, and age for each individual season through 2027, if the player is under contract or team control for those seasons. Last year’s rank includes a link to the relevant 2021 post. Thanks are due to Sean Dolinar for his help in creating the tables in these posts. At the bottom of the page, there is a grid showing all of the players who have been ranked up to this point.

One note on the rankings: particularly at the bottom of the list, there isn’t a lot of room between the players. The ordinal rankings clearly matter, and we put them there for a reason, but there’s not much of a gap between, say, the 35th ranked player and 50th. The magnitude of differences in this part of the list is quite small. Several folks I talked to might prefer a player in the honorable mentions section to one on the back end of the list, or vice versa. I think the broad strokes are correct — but with so many players carrying roughly equivalent value, disagreements abounded. Read the rest of this entry »


2022 Trade Value: Intro and Honorable Mention

Design by Luke Hooper

Baseball’s annual rituals have been around for so long that they feel like an immutable part of the fabric of life. Pitchers and catchers reporting, the All-Star break, September playoff chases and, of course, FanGraphs leaving your favorite player off of our top 50 trade value rankings, which we do to spite you (and them) specifically.

I kid, of course, but today does mark the first installment of our annual Trade Value Series. In the following days, we’ll release our list, taking performance, age, and contract into account. Dave Cameron, Kiley McDaniel, and Craig Edwards all helmed this exercise at various points in the past, and after tag-teaming with Kevin Goldstein last year, I’ve taken over on my own.

That doesn’t mean I haven’t gotten help. I considered a broad range of inputs: estimates of current value, projections of future value, age, contract status, positional scarcity, Statcast data, and anything else I could dream up. From there, I solicited feedback from the rest of the FanGraphs staff (special thanks are due to Dan Szymborski for his ZiPS assistance and Sean Dolinar for his technical wizardry) and consulted with several outside sources, both public- and team-side, to compile the final order. Make no mistake, this is still my list, and it’s an inherently subjective estimation, but I’d like to think it’s an informed one. Read the rest of this entry »


Sunday Notes: Toronto’s Hunter Mense Played Pro Ball With a Teenage Giancarlo Stanton

Hunter Mense had some talented teammates during his relatively brief playing career. None were more talented than a teenager who went by one of his middle names. Now the assistant hitting coach for the Toronto Blue Jays, Mense played alongside Giancarlo Cruz Michael Stanton during their time together as Florida Marlins farmhands.

“I knew him as Mike,” Mense said of the the 2022 All-Star Game MVP, who began going by his given first name after reaching the big leagues. “I remember reading about, and him telling me that he could have played D1 basketball or D1 football. He looked more like a D1 football player than he’s ever looked like a baseball player.”

It goes without saying that the Brobdingnagian superstar is a stupendously good baseball player. According to Mense, who doubles as Toronto’s minor-league hitting coordinator, Stanton’s work ethic was off the charts. Wanting to improve defensively, the 6-foot-6, 245-pound outfielder would often “drag a coach out to the field” and have him hit balls in his dirction before batting practice.

Not surprisingly, Stanton also went the extra mile as a hitter. Read the rest of this entry »


The 2022 Replacement-Level Killers: Introduction & First Base

© Jayne Kamin-Oncea-USA TODAY Sports

In a race for a playoff spot, every edge matters. Yet all too often, for reasons that extend beyond a player’s statistics, managers and general managers fail to make the moves that could improve their teams, allowing subpar production to fester at the risk of smothering a club’s postseason hopes. In Baseball Prospectus’ 2007 book It Ain’t Over ‘Til It’s Over, I compiled a historical All-Star squad of ignominy, identifying players at each position whose performances had dragged their teams down in tight races: the Replacement-Level Killers. I’ve revisited the concept numerous times at multiple outlets and have presented it at FanGraphs in an expanded format since 2018.

When it comes to defining replacement level play, we needn’t be slaves to exactitude. Any team that’s gotten less than 0.6 WAR from a position to this point — prorating to 1.0 over a full season — is considered fair game. Sometimes, acceptable or even above-average defense (which may depend upon which metric one uses) coupled with total ineptitude on offense is enough to flag a team. Sometimes a team may be well ahead of replacement level but has lost a key contributor to injury; sometimes the reverse is true, but the team hasn’t yet climbed above that first-cut threshold. As with Supreme Court Justice Potter Stewart’s definition of hardcore pornography, I know replacement level when I see it.

For this series, I’ll go around the diamond, pointing out the most egregious examples of potential Killers at each position among contenders, which I’ll define as teams who are above .500 or have playoff odds of at least 10.0%. That definition covers 17 teams, all of which have odds above 25% thanks to the new playoff structure (thanks for not saving me any work, Rob Manfred). And while I may mention potential trade targets, I’m less focused on these teams’ solutions than I am the problems, because hey, human nature.

This first installment will cover first basemen. All statistics within this piece are through July 20. Read the rest of this entry »


The Mariners Have Surged Into Contention

© Tim Heitman-USA TODAY Sports

After taking their quest to end their 20-year playoff drought down to the final day of the 2021 season, the Mariners had high hopes for this year, but they mostly sputtered during the first two and a half months of the season, squandering an 11-6 start with separate 1-10 and 2-8 skids. Since June 19, when they were 10 games under .500, they’ve caught fire, winning 22 out of 25 games and entering the All-Star break riding a 14-game winning streak, one that has pushed them into the second American League Wild Card slot with a 51-42 record.

The Mariners aren’t the only AL team that will start the second half with renewed optimism. The Orioles, who have lost at least 108 games in a season three times since 2016, their last season above .500, and appeared headed for another triple-digit loss total through the first quarter of the season, went on a 10-game winning streak starting on July 3, briefly nosing them above .500 for the first time this year. They entered the break 46-46, tied with the White Sox at 3.5 games out of the third Wild Card spot.

The two teams have surged while the Blue Jays and Red Sox have stumbled. While Toronto is still clinging to that last Wild Card spot, at the very least the race has become a four-team fight instead of simply a three-team one, with the AL Central’s second- and third-place teams (the Guardians are only two games behind the Twins, the White Sox three) lurking in the weeds as well, and the Orioles at least showing a pulse. A picture is worth a thousand words:

Read the rest of this entry »