The following article is part of my ongoing look at the candidates on the 2026 Contemporary Baseball Era Committee ballot. For a detailed introduction to this year’s ballot, use the navigation tool above. An introduction to JAWS can be found here.
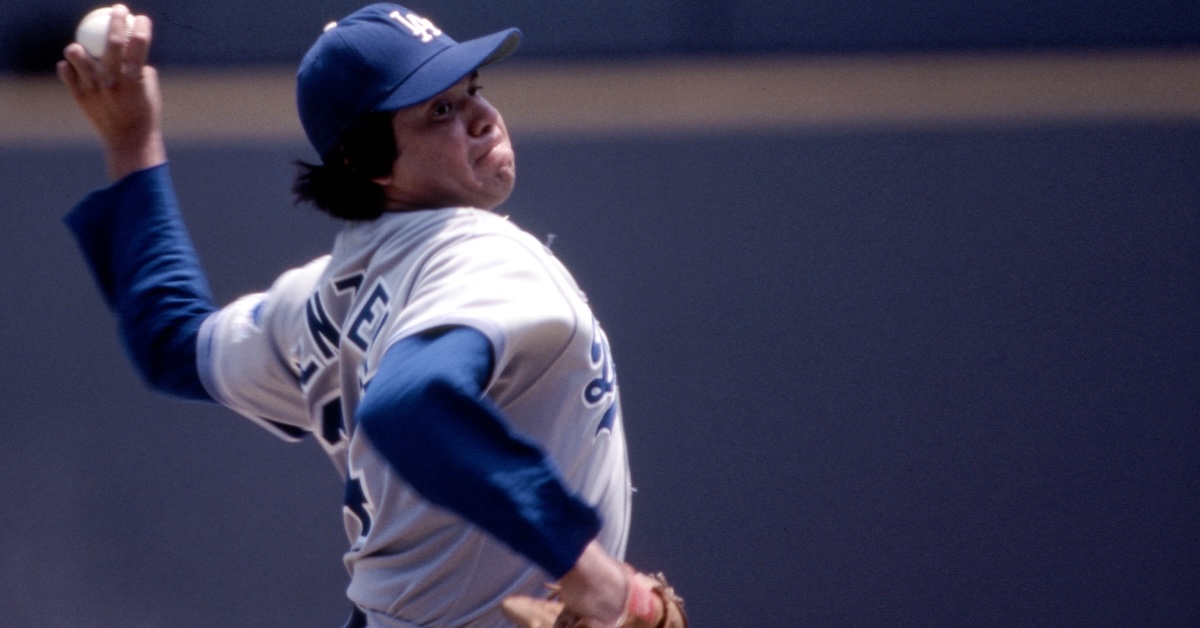
Though he won the Rookie of the Year award, a Cy Young, and a World Series all in his first full season while beginning a six-year streak of All-Star selections — the first of those as the game’s starter — Fernando Valenzuela wasn’t just a star pitcher. He was an international icon, the centerpiece of a cultural phenomenon, and a beloved global ambassador who brought generations of Mexican American and Latino fans to baseball while helping to heal the wounds caused by the building of Dodger Stadium, the very ballpark in which he starred.
“Roberto Clemente is ‘The Great One,’ but culturally, Fernando Valenzuela has been more significant in terms of bringing a fan base that didn’t exist in baseball,” José de Jesus Ortiz, the first Latino president of the BBWAA, told author Erik Sherman for Daybreak at Chavez Ravine, a 2023 biography of Valenzuela. Sherman himself described the pitcher as “like a composite of the Beatles — only in Dodger blue. His appeal was universal.”
After excelling in a relief role during a September 1980 cup of coffee with the Dodgers — as a 19-year-old in the heat of a playoff race, no less — Valenzuela took the world by storm the following spring. Pressed into service as the Opening Day starter, he threw a five-hit shutout, then reeled off four more shutouts and six more complete games within his first eight starts, a span during which he posted a 0.50 ERA. Despite speaking barely a word of English, the portly portsider (listed at 5-foot-11 and 180 pounds, but generally presumed to be at least 20 pounds heavier) charmed the baseball world with his bashful smile while bedeviling hitters with impeccable command of his screwball, delivered following a high leg kick and a skyward gaze at the peak of his windup.
For the 22nd consecutive season, the ZiPS projection system is unleashing a full set of prognostications. For more information on the ZiPS projections, please consult this year’s introduction, as well as MLB’s glossary entry. The team order is selected by lot, and the next team up is the Athletics.
Batters
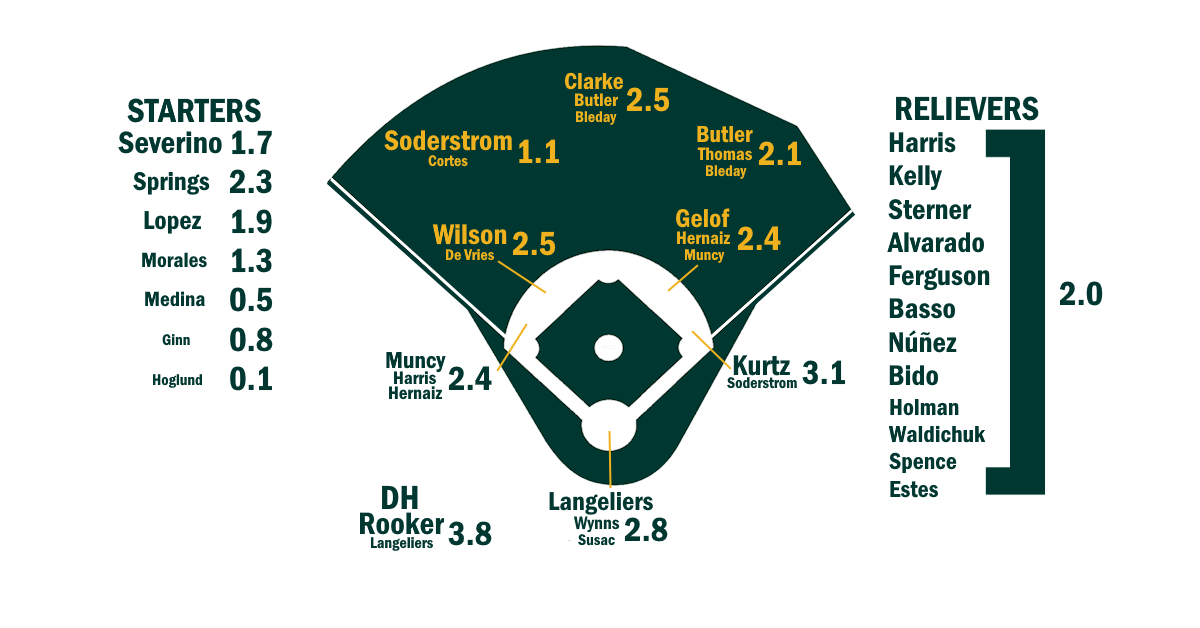
The A’s lineup has made great strides over the last few years, the difference between this graphic and the one from two years ago is nearly night and day. Now, there is no megastar at the top of the WAR stack, but the A’s are pretty solid in most places, aren’t truly abysmal anywhere, and have decent depth options all over the diamond. While this is still far from an elite run creation machine, there’s enough quality surrounding Nick Kurtz and Brent Rooker that this is the type of lineup that could pull its weight in a playoff contention scenario. Even some of the lesser positions like the Max Muncy-led third base amalgamation or the mix-and-match assortment in center field at least project to somewhere around average.
If there’s a disappointment in the projections, it might be Jacob Wilson, for whom ZiPS sees quite a bit of regression coming in 2026. A big part of it is that Wilson’s approach of excellent contact/soft hitting has a fairly poor developmental history in recent decades, and players of this type, if they become too “see ball, hit ball” can fall off quickly like David Fletcher or Luis Arraez. Just like plate discipline should be a means to an end, so should ultra-high contact.
ZiPS also remains a Tyler Soderstrom skeptic and just isn’t as in love with Lawrence Butler as other projection systems have been.
When I talk about the depth, I’m not just being nice; there are a lot of projections for players in the high minors that suggest that they could be fill-in candidates without completely embarrassing anybody. Joshua Kuroda-Grauer might be one of the most interesting. He’s hardly a household name, but the method I use to estimate defense from hit-location data absolutely loves him, and he has the makings of a really solid pairing with Wilson up the middle. The projections also think that Leo De Vries is just a year or two from being a legitimate major league starter. Also in good news for a lineup on a John Fisher-owned team, none of the key players are nearing big free agency paydays that the A’s simply would not match. These guys should be around for a while.
Pitchers
The pitching staff is considerably less impressive than the offense, but even this group has much better projections overall than it did a year ago. Before this past season, I mused that the A’s had kind of lost their knack for developing an endless stream of moderately competent, soft-tossing fourth starters, and it was hurting their chances at getting out of the bottom of the AL West. There are still no aces on the team or, really, any no. 2 starters, but ZiPS thinks the A’s now have a boatload of 90-100 ERA+ starting pitchers, and a few of them (like Luis Medina and Luis Morales) have actual fastballs that they can use to retire major league hitters. What a concept!
I’m not sure that Luis Severino will still be on the roster three months from now, let alone the beginning of August, given his feelings about the stadium situation and potential value for a contending club, but Jeffrey Springs and Jacob Lopez are acceptable mid-rotation starters, and the team has a number of useful fallback options, such as J.T. Ginn and Henry Baez. ZiPS still holds out some hope on Mitch Spence, and is really in on Gage Jump, who has a decent shot in the projections to be the best A’s pitcher 18 months from now.
A Mason Miller-less bullpen is definitely an emoji sad face. While ZiPS sees the pen as a decidedly below-average group, there are far fewer negative WAR projections here than there were last offseason, and the top four of Hogan Harris, Michael Kelly, Justin Sterner, and Elvis Alvarado projects out as…fine…ish. But the bullpen will be a larger worry when the team gets closer to contention.
So, where do the A’s look to be right now? Probably slightly better than the 76 wins they finished with in 2025. But an awful lot would have to go right with the pitching to make this team anything but the fringiest of wild card contenders in 2026. I mean, sure, the A’s could sign Dylan Cease and/or Ranger Suárez, but we all know they’re not actually going to do that. On the bright side, at least these A’s are probably going to be Sacramento’s best major league baseball team ever.
Ballpark graphic courtesy Eephus League. Depth charts constructed by way of those listed here. Size of player names is very roughly proportional to Depth Chart playing time. The final team projections may differ considerably from our Depth Chart playing time.
Players are listed with their most recent teams wherever possible. This includes players who are unsigned or have retired, players who will miss 2026 due to injury, and players who were released in 2025. So yes, if you see Joe Schmoe, who quit baseball back in August to form a Ambient Math-Rock Trip-Hop Yacht Metal band that only performs in abandoned malls, he’s still listed here intentionally. ZiPS is assuming a league with an ERA of 4.16.
Hitters are ranked by zWAR, which is to say, WAR values as calculated by me, Dan Szymborski, whose surname is spelled with a z. WAR values might differ slightly from those that appear in the full release of ZiPS. Finally, I will advise anyone against — and might karate chop anyone guilty of — merely adding up WAR totals on a depth chart to produce projected team WAR. It is important to remember that ZiPS is agnostic about playing time, and has no information about, for example, how quickly a team will call up a prospect or what veteran has fallen into disfavor.
As always, incorrect projections are either caused by misinformation, a non-pragmatic reality, or by the skillful sabotage of our friend and former editor. You can, however, still get mad at me on Twitter or on Bluesky. This last is, however, not an actual requirement.
We’re less than a month from the Winter Meetings and the Rule 5 Draft, which means it’s a good time to evaluate every team’s 40-man roster situation. This is the time of year when teams have one final chance to protect Rule 5 eligible players by placing them on the 40-man. Eligibility is determined by a mix of how long a player has been with their parent organization and how young they were when they signed: Players who signed at 18 or younger must be added to the 40-man within five seasons, while everyone else must be added within four. RosterResource monitors Rule 5 eligibility, if you’re curious to see the lay of the land.
During the season, teams can free up roster space by placing an injured player on the 60-day IL. In the offseason, teams don’t get extra slots for injured players, which tends to put pressure on the back of the roster. The Diamondbacks are a good example of how space can tighten quickly, as they’ve currently got six pitchers battling long-term injuries occupying a spot. You may have noticed a flurry of moves immediately following the World Series, with many teams outrighting players off the 40-man in order to make room for all the guys who were on the IL.
Below, I’ve assessed every National League team’s 40-man roster situation (Eric will sort through the American League tomorrow). Some teams, like the Braves, have plenty of roster space, and thus a lot of flexibility in adding whoever they like. Others, like the Cardinals and Marlins, will face some tough choices as they seek to balance protecting interesting prospects with retaining players already on the roster, as well as finding room for prospective additions via trade or free agency. Some clubs don’t have many impact players to add, while others may need to protect a half-dozen or so guys. I’ve tried to identify which players are most likely to be added, which guys on the 40-man are vulnerable to getting lopped off in a roster crunch, and who could be moved in a deal to free up roster space. Let’s dig in. Read the rest of this entry »
For the 22nd consecutive season, the ZiPS projection system is unleashing a full set of prognostications. For more information on the ZiPS projections, please consult this year’s introduction, as well as MLB’s glossary entry. The team order is selected by lot, and the first team up is the Philadelphia Phillies.
Batters
The Phillies offense kept right on rolling for another season, once again scoring nearly 800 runs, and finishing with a wRC+ of 109, the team’s best total during this era. As expected, Philadelphia’s rotation was terrific, but the offense contributed more than its fair share to the team’s 96 wins, the second most in baseball.
There are worries lurking on the horizon, however. Trea Turner had what was certainly his best season in Philadelphia, but he’s entering his mid-30s, a very dangerous time for a middle infielder. I was actually surprised to see the drop-off in the ZiPS projection for Turner, but noticed that Steamer was basically projecting the same thing. Also entering his mid-30s is Bryce Harper, who has solidified his chances of a plaque in Cooperstown, but appears to now be off his peak years. Kyle Schwarber and J.T. Realmuto are free agents, and I think both stand a real chance of returning to Philadelphia, though both are also entering the likely decline phases of their careers; indeed, Realmuto probably already has. Read the rest of this entry »
The General Managers Meetings are currently taking place in Las Vegas, and as always, FanGraphs is on hand to report on what the executives have to say. We’ll hear from a number of them this week, beginning with a trio of National League execs, Matt Arnold of the Brewers, Paul DePodesta of the Rockies, and Chaim Bloom of the Cardinals.
———
MATT ARNOLD — MILWAUKEE BREWERS
Brewers hitters had both a low strikeout rate and a relatively high walk rate this season; they ranked top five in both metrics. How was that achieved, and to what extent was it a focus?
“I think it was achieved by Murph letting people know, ‘You better put the ball in play and you better not chase,’” Arnold replied, crediting National League Manager of the Year Pat Murphy. “He’s relentless about that. Those are good things that we were able to execute this year, and it’s easier said than done. It starts with the players buying in and Murph enforcing that in the dugout, making sure our guys have that as a focus: the ball-strike, the ball in play. Having those types of skills in your pocket can lead to better at-bats and better outcomes.”
Needless to say, it’s not all Murphy. Milwaukee’s hitting coaches play a role as well.
“It’s a combination of all of them,” Arnold agreed. “Our coaches do a really good job of that. They want our guys to focus on getting a good pitch to hit, and again, while it’s easier said than done, we’ve done a good job of that. We try to focus on it as much as we can in our [minor league system] Marrying your scouting and player development is also super important. We try to communicate it with both of them.”
Jackson Chourio had a perfectly acceptable 20.5% strikeout rate, but also a 5.1% walk rate that ranked lowest on the team. How does he take the next steps to better fit that mold?
“He’s so young, and so athletic, and so talented,” Arnold said of the team’s 21-year-old phenom. “He’s got every ingredient to do it. He’s already doing it at a pretty high level. Whatever he does beyond this is even more special. The sky is the limit for this kid.”
———
PAUL DEPODESTA — COLORADO ROCKIES
Colorado’s new top executive is inheriting a team whose hitters had both a high strikeout rate (second-worst in the majors) and a low slugging percentage (tied for sixth worst). If he had to pick one or the other, which is more in need of improvement?
“I would say it’s not the combo we want,” said DePodesta, stating the obvious. “And it won’t ultimately be one or the other. I said earlier what we want our identity to be, in Colorado especially, but… put it this way: If that’s a dial from one to the other, it’s not necessarily going to be one or the other. We need to find the right combination for us.”
Following up, I asked the well-traveled exec if he has an idea of which direction that combination might trend.
“I do, but I probably won’t share it,” he replied. “For us, it’s how we go about scouting and developing, or even setting up a major league roster. So yeah, ultimately it will be proprietary, what we feel is going to work well for us.”
And then there is the organization’s longest-standing question: What is the best way to pitch effectively in Colorado? Is there an actual answer to be found?
“We’ll find out,” DePodesta said. “I’m encouraged. There have been plenty of successful teams in Colorado. When I was in San Diego in 2007, 2008, 2009, and obviously the teams that Buddy [Black] had in 2017 and 2018, those teams were very successful. There were teams that had winning records on the road.
“My approach, at least as of today, is that I know it’s not impossible,” he added. “It’s been done. Are there things we have to consider that other teams don’t? Probably so. Are there adjustments we’re going to have to make that will look a little different than everybody else? Probably yes, but I’m confident that it’s not impossible. We’re going to figure something out.”
One more follow-up seemed in order. Given the Rockies’ reputation of lagging behind other organizations in terms of analytics, are there maybe things that have been overlooked?
“That I don’t know,” said DePodesta, who has spent the last decade working in the NFL as the chief strategy officer of the Cleveland Browns. “I’m looking forward to diving in deeper to the organization and figuring out all the things they have tried. I have a handful of ideas right now, but I would imagine they’re pretty naïve. Coors Field has been around since 1995 [and] they’ve tried a lot of things. I don’t have to reinvent the wheel. I want to understand what all of those things were and what they felt worked, and what didn’t. I don’t want to try things a second time if they’ve already tried them.”
———
CHAIM BLOOM — ST. LOUIS CARDINALS
Cardinals pitchers didn’t strike out a lot of batters this year; they were second worst in the majors. How much of a concern is that?
“It’s definitely a concern,” replied Bloom, who succeeded John Mozeliak as St. Louis’ president of baseball operations at the conclusion of the regular season. “It’s not the only thing that matters, but it does matter. Having stuff that can beat people in the strike zone, that can miss bats — both in and out of the strike zone — is really important. It’s hard to have an elite staff without being able to do that. It’s not something you want to chase at the expense of throwing strikes — you’re not trying to put people in positions where they can’t succeed, or stay healthy — but it’s super important.”
How close is Liam Doyle to helping out in that respect?
“He’ll tell us that as the season unfolds,” Bloom said of the 21-year-old southpaw whom the Cardinals drafted fifth overall this year out of the University of Tennessee. “We gave him a little taste of [pro ball] at the end; he got his feet wet a little bit. Obviously, a first full season will tell you a lot. A first full season in and of itself is a big developmental step for guys, because they haven’t been asked to pitch that regularly for that long. But he came in and showed everything you want to see. He got after his work. He showed openness, a desire to get better, a willingness to listen. There is obviously some work to do before we can call him a big leaguer, but we’re really happy with the pitcher we got.
“The player will move himself,” added Bloom. “The player tells you where he should be. If you try to force something that’s not there, you usually end up paying a price. You might end up picking the pieces up from that for quite some time. When a player is ready and you give him that opportunity, he can carry it. It’s really just what the game is telling us, letting the player’s performance and his progress on the mound carry the day.”
Balls in play are less of an issue when you have a strong defense, which St. Louis largely had in 2025. Just how strong depends on the numbers you favor. I asked Bloom if he could explain how the Cardinals led all teams in Outs Above Average, yet were well below average in Defensive Runs Saved.
“That is a bigger conversation than one we could have here today,” Bloom said. “There are some differences between those metrics, some differences in [how they] get calculated that might disproportionally help or hurt certain types of players. Sometimes those things… they usually will even out year over year. I’ve seen specific players where that might not be the case, because of certain things that the player does or doesn’t do well that some metrics favor — or don’t — but typically over the course of time, they tend to [even out].”
What does it say about the 2025 Cardinals specifically?
“I’d be hesitant to draw too much of a big picture about specific players or player seasons,” Bloom responded. “If it persists over two or three years, then we can look at it as a trend and see if there is something underlying.”
In just about any sport you can name, offense is king. If you’re the one who scores the goals, the points, the runs, the whatever they call it in polo – the biscuits, maybe? – you’re going to get the plaudits. Who’s the greatest defenseman in the history of hockey? It’s Bobby Orr, of course, because he was the first great offensive defenseman. This pattern very much holds when it comes to baseball.
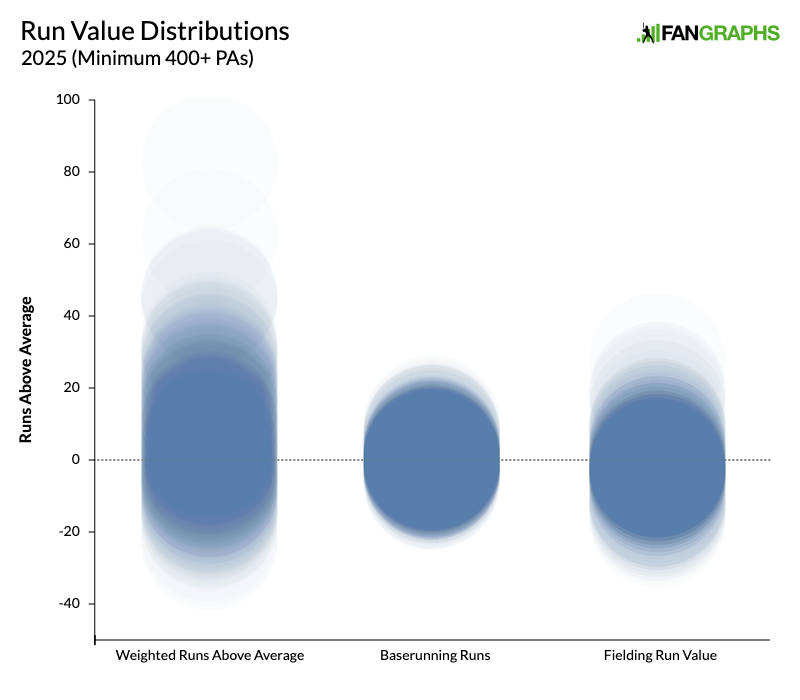
Among other things, the sabermetric revolution helped us codify the value of hitting relative to the other facets of the game. To wit, according to weighted runs above average – and we’re using that particular stat because, like standard baserunning and defensive metrics, it’s a counting stat that compares a player to the performance of an average player – the most valuable hitter during the 2025 season was one Aaron Judge. Judge created 82.5 more runs than the average hitter. That’s 21 runs more than any other player, and an astonishing 36 more than any other player not named Shohei Ohtani. Judge was the best offensive performer in the game by a mile, which makes him the frontrunner for the American League MVP award, even though he put up negative value as a baserunner and, depending on which metric you trust, his defense graded out somewhere between pretty good (DRS, FRV) and really bad (DRP). The best defender was Patrick Bailey, who put up 30 fielding runs, and the best baserunner was Corbin Carroll, who finished with a measly 10.3 baserunning runs. Offense is just more valuable than defense and baserunning. Here’s the distribution of values for the three portions of the game:
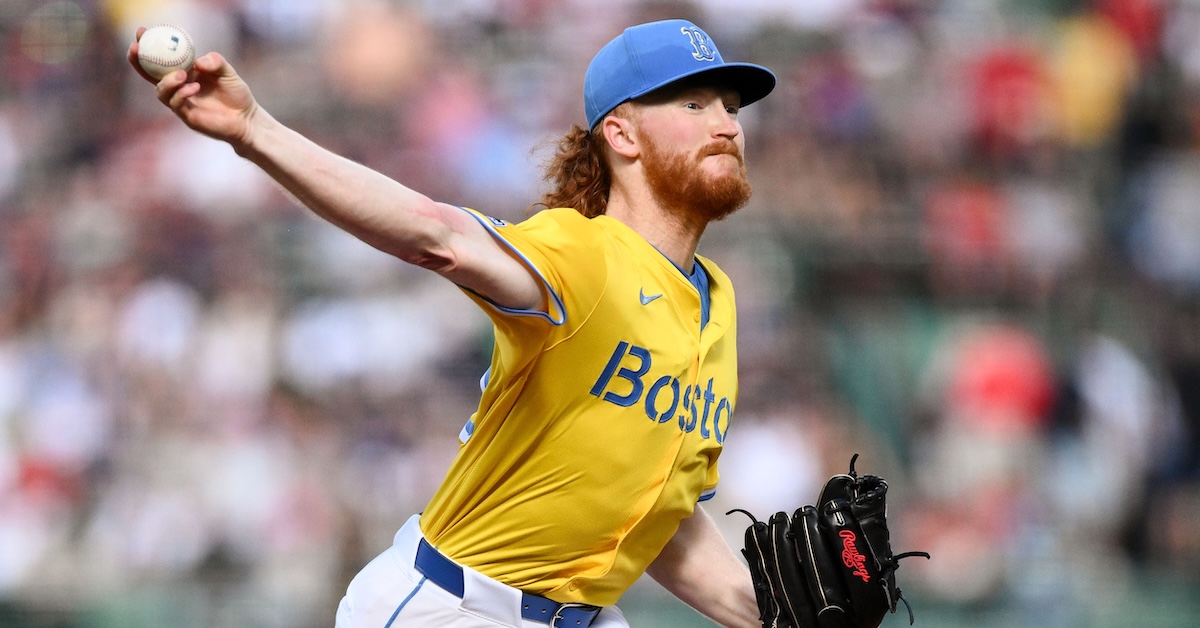
Dustin May is a free agent. And not because he got non-tendered; he’s passed six years of service this season, and hits the open market at the tender age of 28.
I admit this one snuck up on me. May, a highly touted Dodgers prospect, stormed into prominence when he joined the L.A. pitching staff in 2019 at the age of 21. He pitched for the Dodgers in the playoffs that October and started 2020 as the no. 14 prospect in all of baseball, and spent most of the year in the rotation, garnering a few Rookie of the Year votes and making seven appearances during the Dodgers’ run to the World Series. Read the rest of this entry »
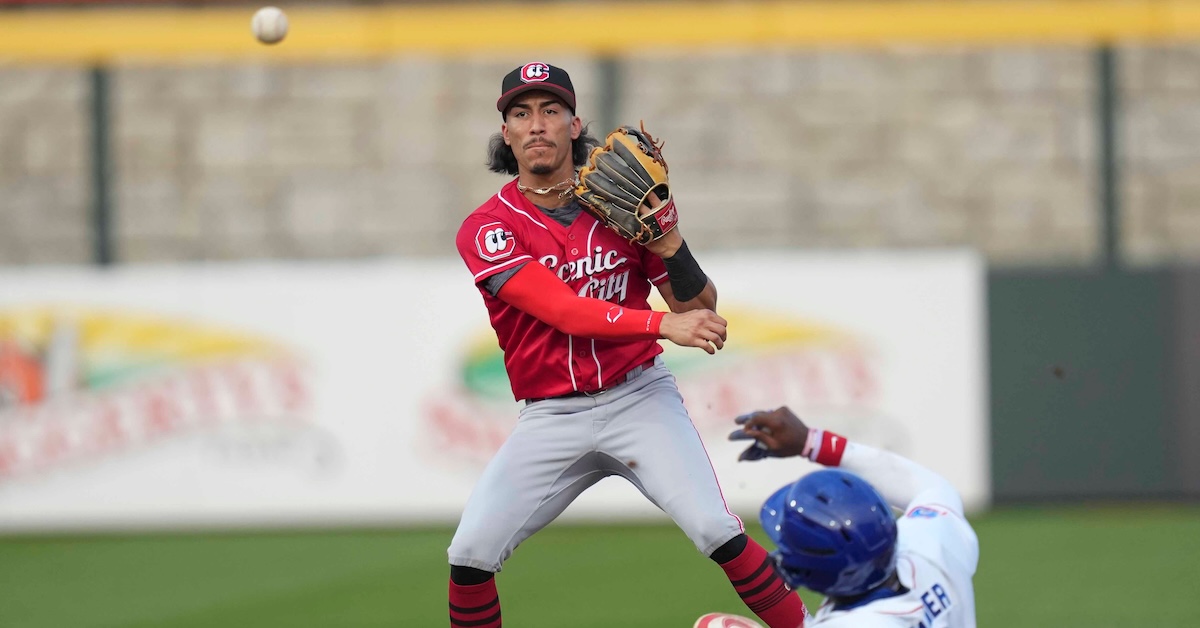
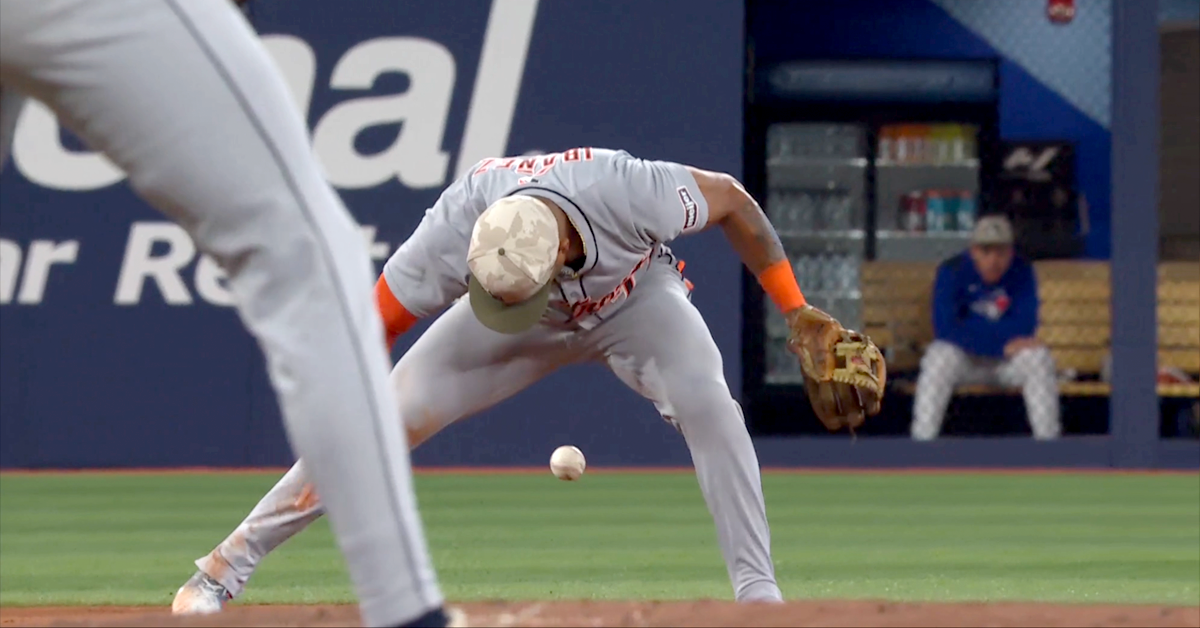
I found this in my notes last week. I have no idea how long it’s been there. It says: “How many times this season has an infielder let the ball go right between their legs?” I had no idea whatsoever. I couldn’t recall the last time I’d seen it. Probably in a highlight from the 1986 World Series.
Baseball is the ultimate scorekeeping sport, and thanks to sites like ours, when you ask how many times any particular event has happened, the answer is usually easy to find. How often does a righty hit a home run off a lefty in the top of the eighth inning with the tying run in the on-deck circle? It took me twice as long to type that question out as it did to look up the answer: It has happened five times in each of the last three years. Easy. But so far as I know, nobody keeps a count of grounders that go right through the wickets.
Errors get classified in certain ways. Our leaderboard tracks fielding and throwing errors. The play-by-play notes on Baseball Savant add in missed-catch errors. Other sources differentiate between reached-on-error errors and runner-advanced errors. But that’s about it. Because they represent arguably the most embarrassing way to commit an error, between-the-legs errors are special in a human sense, but nobody splits them out into their own column because there’s nothing particularly special about them in a baseball sense. At least, you wouldn’t think so initially. Read the rest of this entry »
Just in time to push back the withdrawal symptoms from the lack of baseball, it’s awards week! We started, as usual, with the Rookie of the Year awards, and in the National League, Drake Baldwin earned the hardware, finishing with 21 first-place votes to Cade Horton’s total of nine. Baldwin was the only candidate to appear on all 30 ballots. Horton finished second, followed by Caleb Durbin, Isaac Collins, and Daylen Lile.
Did the BBWAA members entrusted with this task make good picks? That’s for you to decide. I’m here for my usual task of explaining/justifying/defending how I voted in my award this year, the NL Rookie of the Year award. I like to think I do a pretty good job, but I personally feel my responsibility for addressing my vote ought to go beyond the confidence I may have in my own competence. This is ostensibly an expert panel, not a federal election, so a vote here isn’t a question of my right to have one but my duty to exercise it thoroughly. People in the baseball community, from the most casual fans to the players themselves, ought to know why I voted for someone and not others. This is especially true when many disagree with me, such as my past first-place votes for Jackson Merrill last year and Trevor Rogers in 2021. Read the rest of this entry »