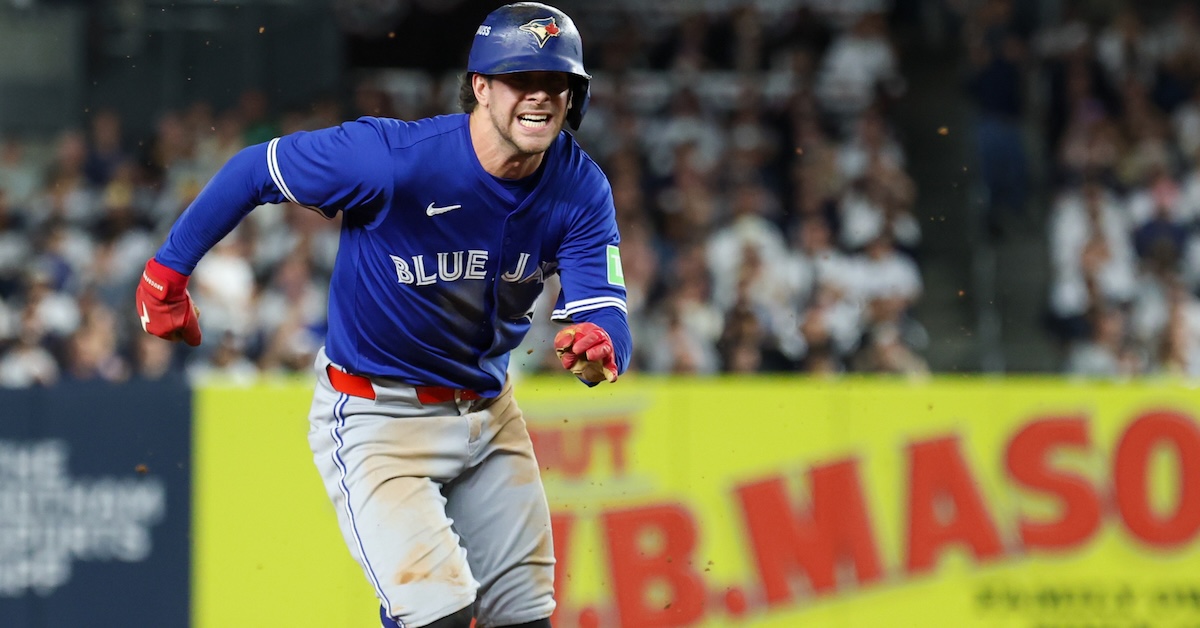
NEW YORK — Ernie Clement simply wore out Yankees pitchers during the Division Series. After collecting three hits in Game 2 — including a two-run homer off Max Fried that opened the scoring — in a Blue Jays win, then four more hits in their Game 3 defeat, the 29-year-old infielder sparked rallies in Game 4 with a pair of singles that led to the go-ahead run in the fifth inning and then two more runs in the seventh, helping Toronto break the game open. Backed by opener Louis Varland and seven other relievers who combined to hold the Yankees to six hits and two runs, the Blue Jays bounced their AL East rivals with a 5-2 victory in Game 4.
While Vladimir Guerrero Jr. (.529/.550/1.059) and Daulton Varsho (.438/.471/1.000) were the Blue Jays’ heaviest hitters in the series, combining for five homers and 13 RBI, Clement — who spent time at all four infield positions this year and started games at both second and third base in this series — hit .643/.625/.929 himself while scoring and driving in five runs apiece. Though he showed a wide platoon split during the regular season, producing a 146 wRC+ (.326/.351/.549) against lefties and 75 wRC+ (.254/.295/.327) against righties, both of his Game 4 singles were off fireballing righty Cam Schlittler, who was very good if not nearly as dominant as he had been against the Red Sox in the Wild Card Series finale.
“I think Ernie Clement has made everyone aware of how good he is,” said manager John Schneider after the game. “It’s been like that the whole year for the bottom part of our lineup. You try to navigate it to where guys can put the ball in play, guys can get on base for guys at the top. Read the rest of this entry »
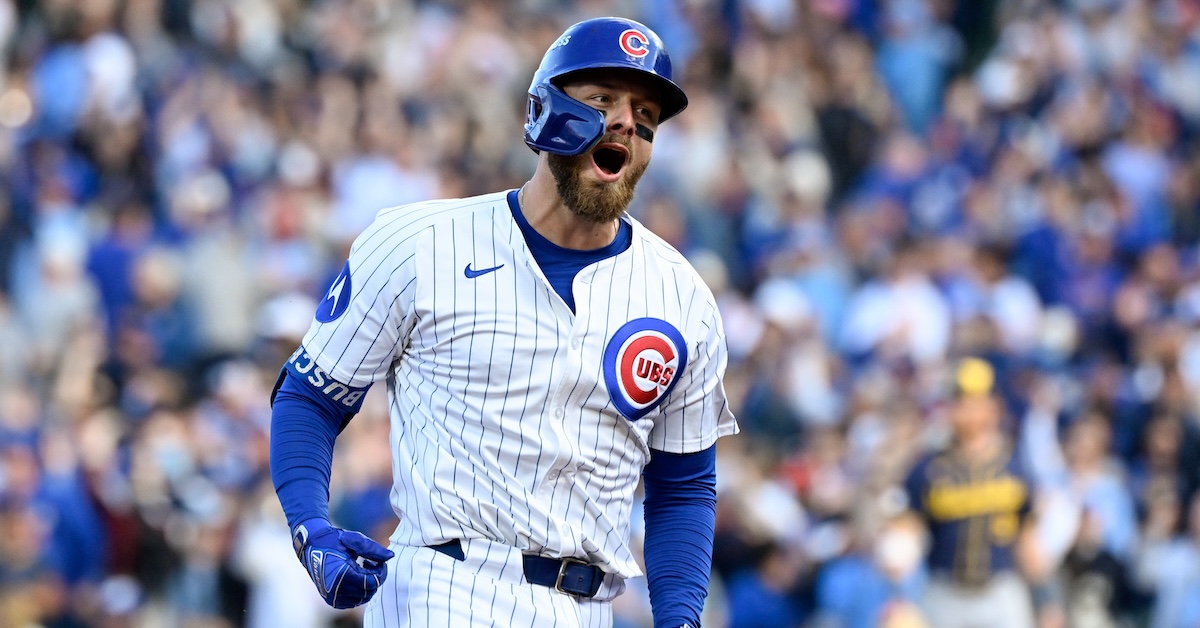
The Cubs stayed alive in the National League Division Series on Wednesday, narrowly beating the Brewers in a 4-3 Game 3 squeaker. Neither starting pitcher went long, with both teams needing to go relatively deep into their bullpens to finish out the contest; a combined 10 relievers were used.
Carlos Zambrano threw out the ceremonial first pitch, 13 years after his final game in the majors — Big Z’s former teammate, Rich Hill, appeared for the Royals in 2025 and is older than him — but things got off to an inauspicious start for the Cubs after that, as a lazy curve from starter Jameson Taillon was far less lazily lashed down the first base line into right field for a Christian Yelich double. After a Jackson Chourio groundout, Taillon lost the strike zone a bit, walking Brice Turang to put runners on first and second for William Contreras. Contreras hit an infield single to load the bases. Of course, that’s burying the lede a bit, but you couldn’t see that I was making the air quotes gesture with my fingers while I was writing that sentence. The “infield single” was anything but; it was a popup on the infield that Michael Busch lost in the sun while his sunglasses remained unused on his cap. Both Carson Kelly and Nico Hoerner ran over, but they weren’t in time to salvage the play. Dansby Swanson ran over as well, which became a problem when Kelly picked up the ball but had nobody to actually throw to for an attempted forceout of Turang. Read the rest of this entry »
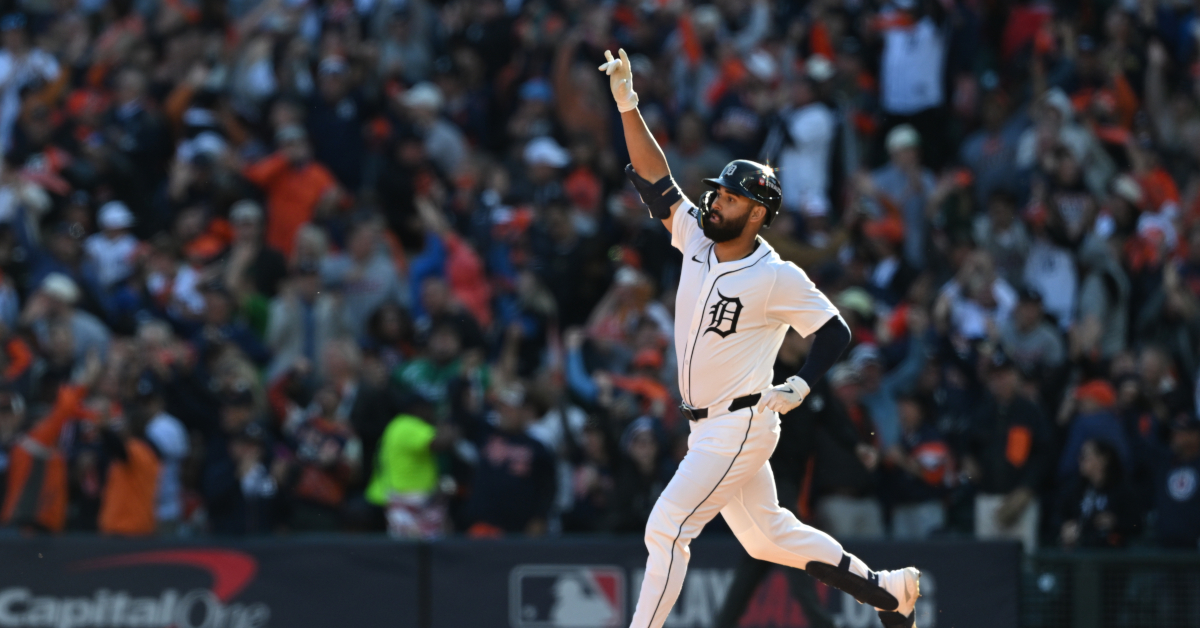
Maybe the three runs the Tigers scored in the ninth inning of their Game 3 blowout loss weren’t so inconsequential after all. Maybe they were a sign of better things to come on Wednesday. Facing elimination, Detroit’s bats woke up in a big way in Game 4 en route to a 9-3 victory. That sends the American League Division Series back to Seattle on Friday for a decisive Game 5, allowing Tarik Skubal one more chance to beat the Mariners for good.
Consider this: Through the first three games of the ALDS, the Mariners had hit more home runs than the Tigers had extra-base hits. Kerry Carpenter hit a home run in Game 1, the team’s lone long ball to that point, and Spencer Torkelson and Gleyber Torres each had a pair of doubles, but that was it. Granted, three of those extra-base hits drove in runs, and two of them tied the game — the Tigers made the most of their limited opportunities — but Seattle had been absolutely outslugging Detroit:
Tigers Hitters, Through ALDS Game 3
Player
H
RBI
WPA
wOBA
xwOBA
wRC+
Gleyber Torres
4
0
0.03
0.382
0.372
147
Spencer Torkelson
2
4
0.39
0.299
0.337
90
Colt Keith
1
0
-0.05
0.225
0.370
39
Kerry Carpenter
1
3
0.00
0.210
0.405
29
Riley Greene
2
0
-0.15
0.147
0.117
-14
Zach McKinstry
1
1
0.10
0.131
0.145
-25
Indeed, outside of Carpenter’s clutch home run, a pair of two-run doubles from Torkelson, and four hits off the bat of Torres, the Tigers offense had been conspicuously absent during the series. Even after their mini-rally in the ninth on Tuesday, Detroit was batting .165 and slugging .233 as a team entering Game 4. On the other hand, Seattle was slugging .423 even while batting just .212 through three games. That narrative completely flipped on Wednesday. The Tigers collected seven extra-base hits (three home runs and four doubles), while the Mariners could only muster one. Torkelson, Torres, Zach McKinstry, and Javier Báez each had multiple hits, and Jahmai Jones had a huge pinch-hit double in the decisive fifth inning.
And as they have all series long, home runs defined the shape of Game 4. Riley Greene had been mostly bottled up during the ALDS; he had collected just two hits through the first three games of the series. His first extra-base hit against Seattle was a 454-foot blast to give the Tigers a 4-3 lead in the sixth inning. After hitting 36 homers during the regular season, his go-ahead home run was the first of his postseason career and broke open the floodgates for the Tigers. For his part, Báez hit his first postseason home run since the 2017 NLCS, a two-run shot, later in the inning. Then in the seventh, Torres continued his hot hitting by launching an opposite field solo shot to extend the Tigers’ lead, making it 8-3.
The game hadn’t started off so lopsided. As they have in each game of the series, the Mariners got on the board first, scoring a run in each of the second, fourth, and fifth innings. With a 3-0 lead halfway through the ballgame, things were looking pretty encouraging for the Mariners. They’ll likely look back on Wednesday and be haunted by some pretty big missed opportunities to put the game away early. In the fourth, Seattle loaded the bases with no outs, but wound up pushing just one run across after a double play and a pop out squelched the threat. The next inning, the first two batters reached, earning the team another run, but the Mariners couldn’t keep the rally going.
Things turned in the bottom half of that inning. Torkelson led off with a single, and after a fielder’s choice, Dillon Dingler drove in the Tigers’ first run with a double. That chased Bryce Miller from the game, and Mariners manager Dan Wilson went with trustworthy lefty Gabe Speier to face the bottom of Detroit’s lineup. Jones, pinch-hitting for Parker Meadows, ripped the first pitch he saw down the left field line to drive in Dingler, and Báez tied the game with a single up the middle in the next at-bat. Speier came back out in the sixth inning to face Greene, but the Tigers left fielder turned on a hanging slider and deposited it in the right field stands. From there, the flood gates opened. The Tigers scored three more in the sixth, capped off by Báez’s home run off Eduard Bazardo, and they added insurance runs in the seventh and eighth.
For Seattle, it’s a pretty concerning shift from what had been a fairly dominant bullpen through three games. Even when you include the three runs allowed by Caleb Ferguson in the ninth inning of Game 3, Mariners relievers had put up a 3.38 ERA and a 1.71 FIP in 13.1 innings during the ALDS — their ERA drops to 1.35 if you ignore those garbage time runs. The Tigers have also scored all of their runs in this series in the fifth inning or later, putting even more pressure on the Mariners’ relief corps.
The runs Speier and Bazardo allowed in Game 4 were their first of the series, and you have to wonder if familiarity is starting to work against Seattle’s ‘pen. Bazardo has appeared in all four games, while Speier has now gotten some high-leverage work in three of the four games, including facing Carpenter and Greene three times apiece. Because Detroit’s most dangerous hitters are left-handed, Speier will almost certainly be called on to work in Game 5 on Friday, and thanks to Ferguson’s struggles on Tuesday — he’s the only other lefty in Seattle’s bullpen — Speier seems like the most critical piece of the pitching puzzle for Wilson and the Mariners.
The Tigers turned to Game 1 starter Troy Melton to shut down the Mariners bats once they had tied it up in the fifth. Melton worked around some trouble in the sixth, getting Randy Arozarena to fly out to center after allowing two two-out baserunners. The right-hander carved through the heart of the Mariners order on seven pitches in the seventh, then erased a leadoff baserunner in the eighth with a made-to-order double play, again only needing seven pitches to set the M’s down in order; he has to have Tigers manager A.J. Hinch feeling really good should the team need a fireman to quell a late rally from the Mariners on Friday. Will Vest closed the door with a 1-2-3 ninth.
While Detroit’s starter for the decisive Game 5 isn’t in question, Seattle’s is still unsettled. Both George Kirby and Luis Castillo could start Friday’s game on normal rest, and both looked pretty good in their earlier starts this series. Ultimately, it’ll come down to who Wilson trusts more to work through the Tigers’ lineup twice, with whoever doesn’t make the start likely available out of the bullpen anyway. I should mention that between the two, Kirby is the only one who has made a relief appearance during his big league career, closing out Game 2 of the 2022 Wild Card series against the Blue Jays.
No matter who starts for the Mariners on Friday, this was the exact scenario they were hoping to avoid. Allowing Skubal two opportunities to affect the outcome of the series is a very dangerous proposition, even if Seattle has beaten him three times this year. Tempting fate a fourth time tips the scales toward Detroit; our ZiPS game-by-game odds currently give the Tigers a 54% chance of advancing to the ALCS (assuming a Kirby start for Seattle). That’s a percentage Mariners fans are well acquainted with.
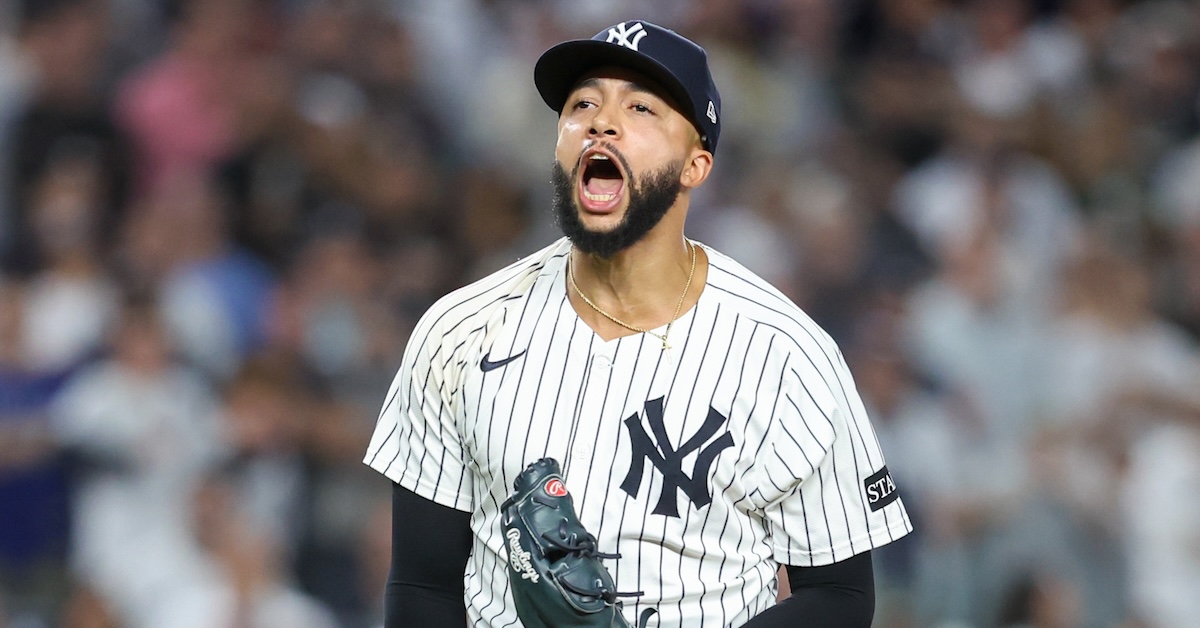
NEW YORK — The ovation that Devin Williams received from the crowd of 47,399 at Yankee Stadium as he departed in the eighth inning on Tuesday night after recording five crucial outs — his longest outing in more than two years — did not go unnoticed. “It’s nice to feel appreciated sometimes. It was definitely a lot better than what I’ve heard for much of the year,” said the 31-year-old righty in the wake of the Yankees’ dramatic 9-6 comeback victory over the Blue Jays in Game 3 of the American League Division Series. Acquired from Milwaukee last December, the two-time All-Star was supposed to serve as the closer of the defending AL champions, but early struggles bumped him out of that role, and he was booed vociferously. Over the past month, he’s tried to salvage his season, and with the Yankees in danger of being swept by their division rivals, he was one of five relievers who held the Blue Jays scoreless over the final 6 2/3 innings while the Bronx Bombers bashed out eight unanswered runs, six of them against Toronto’s bullpen.
When starter Carlos Rodón left Game 3 with one out in the third inning, the Yankees trailed 6-1 and appeared perilously close to being eliminated. They quickly clawed their way back against a wobbly Shane Bieber, however, chasing the Blue Jays’ starter with two outs in the third with the score 6-3. From there, a unit that was torched for 14 runs in 10 1/3 innings in Games 1 and 2 in Toronto won the battle of the bullpens. While Fernando Cruz, Camilo Doval, Tim Hill, Williams, and David Bednar quieted an offense that had been humming on all cylinders, four straight Blue Jays relievers allowed runs, with Louis Varland serving up both Aaron Judge’s game-tying three-run homer in the fourth inning and Jazz Chisholm Jr.’s go-ahead solo shot in the fifth. Now, while the Yankees will call upon Wild Card Series hero Cam Schlittler to start Thursday’s Game 4, the Blue Jays — gulp — counter with a bullpen game started by Varland, a development that could help send this series back to Toronto.
“That’s just what’s on the table,” said Williams of the bullpen’s collective mindset given the situation when Rodón departed. “We really don’t have any other option but to put up zeros and give our guys a chance to take the lead.” Read the rest of this entry »
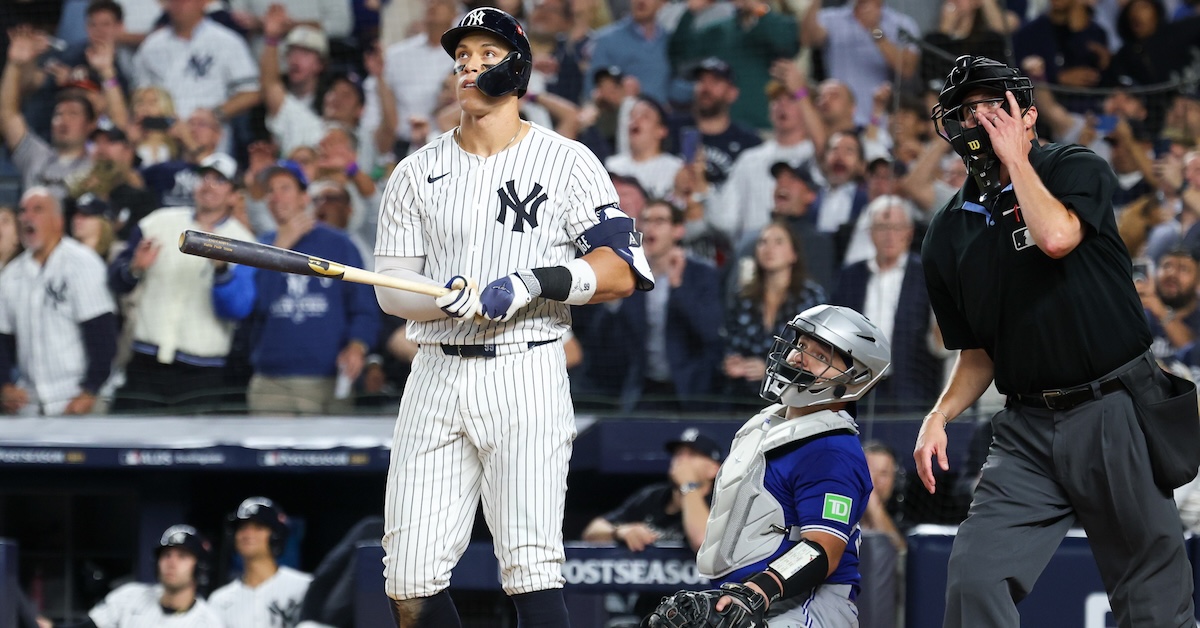
NEW YORK — Aaron Judge didn’t deserve the rumblings. After he struck out with the bases loaded on Saturday in Game 1 of the ALDS against the Blue Jays, Yankee fans started to grumble that maybe he just didn’t have it in the postseason. It’s true that he’d struggled in 2020 and 2022, but Judge had excelled in the playoffs earlier in his career, and he came into Game 3 of the ALDS on Tuesday night with a career postseason wRC+ of 116. He hit three home runs during the Yankees’ World Series run just last year, including a game-tying shot in Game 3 of the ALCS.
On Tuesday night, with a performance that would be eye-opening if it had come from just about any other player in baseball, Judge pushed his batting average in the 2025 postseason to an even .500. He went 3-for-4 with an intentional walk and a couple of great plays in right field, and for the rumblers and grumblers with short memories, he launched a mammoth, game-tying, season-saving, signature home run, pulling the Yankees back from the abyss and into Game 4 with a 9-6 victory over the Blue Jays. Read the rest of this entry »
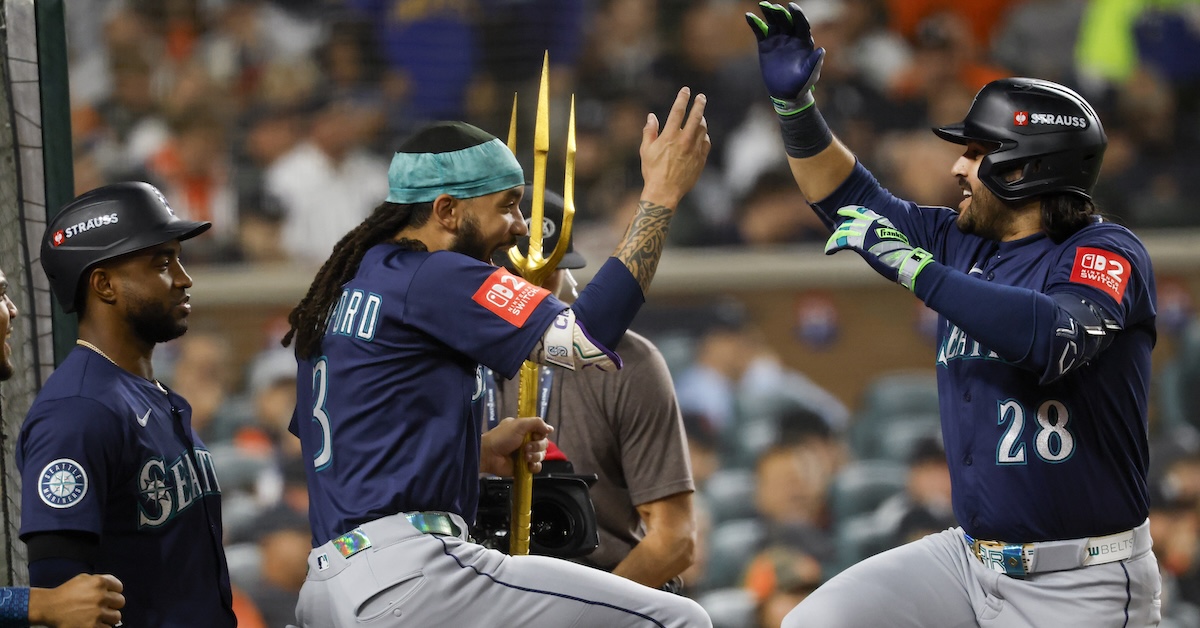
Water falling from the skies over Comerica Park delayed the start of a pivotal ALDS Game 3 between the Tigers and the Mariners by close to three hours. Once things dried out, Seattle’s batters rained on Detroit’s parade. Eugenio Suárez, J.P. Crawford, and Cal Raleigh all homered, and that was more than enough to support the pitching of Logan Gilbert and four Mariners relievers. When all was said and done, Seattle had an 8-4 win and a 2-1 edge in the best-of-five series.
The game started with a successful challenge. Randy Arozarena was initially ruled safe after Gleyber Torres threw to first to field a comebacker that glanced off of Jack Flaherty’s glove, but replay review reversed the call. Seattle’s leadoff hitter was out by an eyelash. A few swings later, Detroit’s starter had retired the side on just eight pitches. It was to be his only easy inning.
The Mariners made the right-hander work in the second. Josh Naylor had an 11-pitch at-bat, finally grounding out on Flaherty’s first changeup of the evening. Three other batters saw six pitches apiece. Suárez walked, Jorge Polanco and Dominic Canzone fanned, and Flaherty walked off the mound having thrown 29 in the frame, and 37 overall. It was apparent early that the Tigers bullpen would be well-worked by game’s end.
A Dillon Dingler single gave Detroit a runner in the bottom half, but as had happened in the first, Gilbert ended the mini-threat with a strikeout, leaving a Tiger stranded. Never really in trouble over the course of his outing, the tall right-hander nonetheless squelched every semblance of a Detroit rally. Read the rest of this entry »
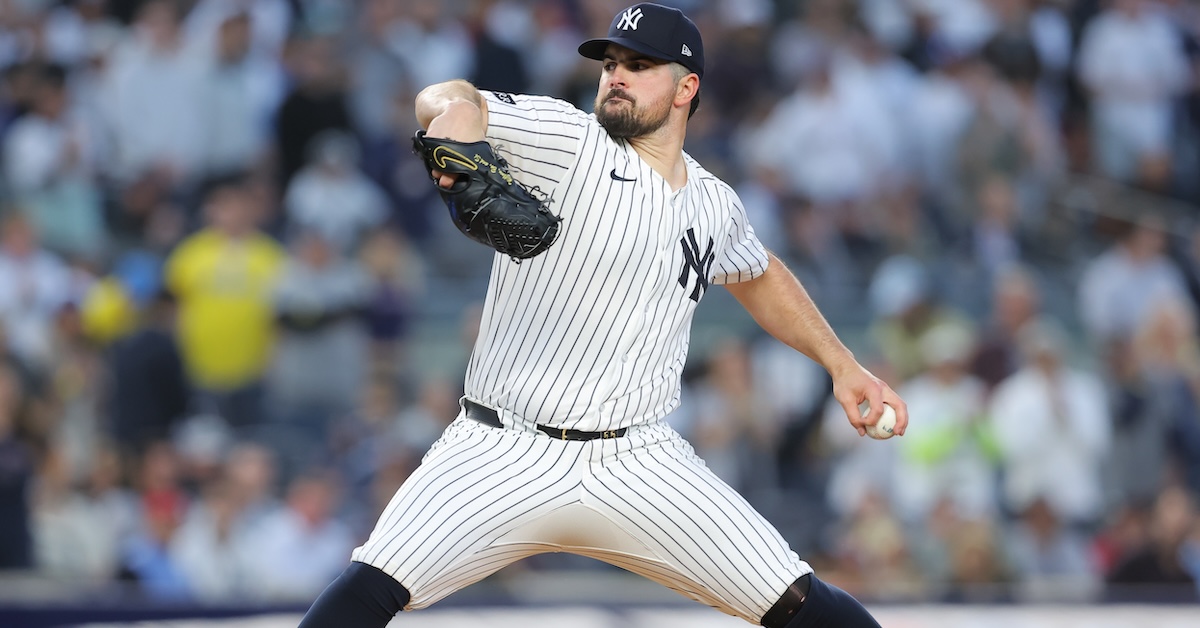
The Yankees got absolutely thrashed by the Blue Jays during the first two games of the Division Series, losing Saturday’s opener 10-1 and then again on Sunday, 13-7. To be fair, the first game was tight right up to the seventh-inning stretch, after which the Blue Jays expanded their 2-1 lead with four runs apiece in the seventh and eighth innings, but by the same token, Game 2 wasn’t even as close as that six-run margin suggests. The Yankees not only trailed 12-0 through five innings, but also were no-hit by Trey Yesavage through 5 1/3 innings before breaking through against reliever Justin Bruihl in the sixth. Now, for the second time in less than a week, they’ll turn to Carlos Rodón to face an AL East rival with their season on the line.
The 32-year-old Rodón started Game 2 of the Wild Card Series against the Red Sox, one night after Garrett Crochet and Aroldis Chapmanstifled the Yankees in the opener. Rodón held the Red Sox to three runs in six-plus innings, getting by with more than a little help from his friends. He retired the first six batters he faced before running into trouble in the third inning. Jarren Duran, the lone lefty in the lineup, singled, then Ceddanne Rafaela worked a walk, with Rodón exacerbating the situation with a throwing error on switch-hitter Nick Sogard’s sacrifice bunt. Though he recovered to strike out lefty-masher Rob Refsnyder, both runners scored on a sharp single by Trevor Story. Rodón escaped further damage when he induced Alex Bregman to ground into a double play that began with an acrobatic spin move by second baseman Jazz Chisholm Jr.
After a clean top of the fifth, Rodón was briefly staked to a 3-2 lead thanks to Aaron Judge’s RBI single, but it proved short-lived. Rodón fell behind Story 2-0 to lead off the fifth, then threw him a meatball, a 95.2-mph four-seamer that ended up in the middle of the strike zone and was hammered 381 feet to left field for a game-tying home run. A four-pitch walk to Bregman put him on the ropes, but he recovered by retiring Romy Gonzalez on a popout, then getting Carlos Narváez to ground into an around-the-horn double play. With his pitch count at a reasonable 82, manager Aaron Boone sent Rodón back out to start the seventh, but he walked Nate Eaton on four pitches, threw a wild pitch that sent him to second, then grazed Duran with a 3-0 pitch. Reliever Fernando Cruz managed to clean up the mess without further damage, aided by a stellar diving stop by Chisholm on a Masataka Yoshida infield single that, had it not been stopped, probably would have plated both Duran and Eaton. The Yankees scored what proved to be the decisive run in the eighth, when Chisholm worked a walk against Garrett Whitlock, then raced home on a long single into the right field corner by Austin Wells. Read the rest of this entry »
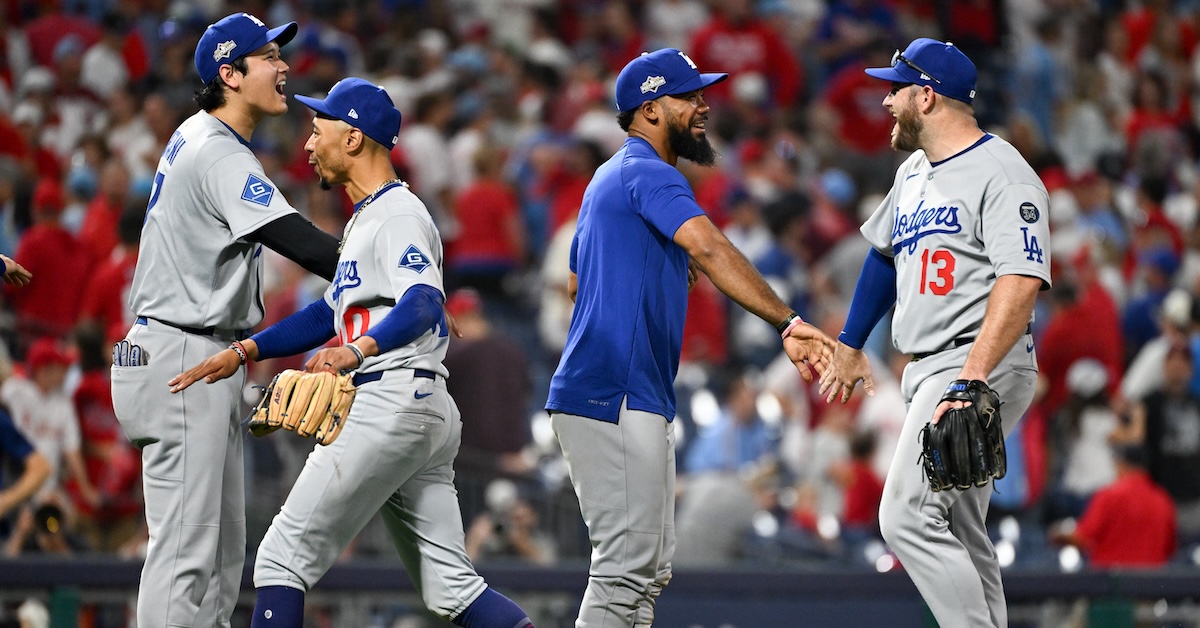
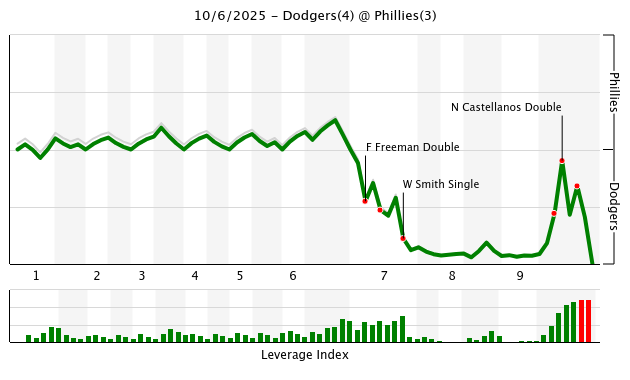
PHILADELPHIA – If the lesson to learn from Game 1 of the NLDS is that nobody’s perfect, the lesson to learn from Game 2 is that some pitchers come close. Blake Snell and Jesús Luzardo delivered the kind of pitchers’ duel to warm the hearts of dyspeptic ex-pros who should have to drop a quarter in the swear jar whenever they start a sentence with, “Back in my day…” Snell allowed only a single hit against four walks and nine strikeouts in six innings of work; Luzardo, after a tricky first inning, recorded 17 straight outs.
After watching a blank scoreboard for the first two-thirds of the game, both teams cracked under the strain in the endgame. The two clubs followed this pair of near-perfect pitching performances with a manifestly imperfect bottom of the ninth, as both teams committed blunders in tactics and execution that threw a settled game into chaos.
The final score: Dodgers 4, Phillies 3. In this heavyweight bout, the Dodgers are one win away from a knockout victory. Read the rest of this entry »
The key decision point in Saturday night’s Mariners-Tigers game came in the fifth inning, when manager Dan Wilson left righty George Kirby in the game to face a dangerous lefty, a third time through, with a runner on base. Kerry Carpenter smacked a 400-foot homer, erasing a Seattle lead, and the Tigers won 3-2 in 11 innings. So on Sunday, when righty Luis Castillo found himself in a similar pickle, Wilson found himself in a bind of his own.
The situation: a Gleyber Torres single put runners on first and third with two outs in the fifth inning. The next batter? None other than Carpenter. For the second straight day, the Mariners held a 1-0 lead, and this time, further runs didn’t feel likely, not with Tarik Skubal on the mound. Castillo had bobbed and weaved his way through the Tigers lineup two straight times, but he’d thrown 85 pitches to do so, scattering four walks and that Torres hit through his 4 2/3 innings.
This was no easy decision. Each choice had several points in its favor, but several downsides as well. Why pull Castillo? The situation greatly disfavored him. He’s far better against righties than lefties, and his platoon splits have only increased since he moved to Seattle and started weaning the changeup out of his arsenal. Even worse, Carpenter was up for a third time and had already seen 10 pitches from Castillo, including everything in his arsenal. Carpenter himself has huge platoon splits; in his career, he’s faced righties six times as often as lefties, with a 138 wRC+ against righties and a 69 wRC+ against lefties. Gabe Speier, Seattle’s middle-inning lefty of choice, is outstanding against lefties, and generally just outstanding overall. Finally, Castillo didn’t have his best stuff, and certainly didn’t have his best command. A change would meaningfully improve the matchup for Seattle, in the biggest spot of the game. Read the rest of this entry »
The pitching matchup favored the Yankees. With all due respect to one of baseball’s best young arms, Toronto’s Trey Yesavage came into the contest having thrown just 14 big league innings. Conversely, New York starter Max Fried is a three-time All-Star who finished the season 19-5 with a 2.86 ERA. While Yesavage has a bright future — he’s currently the Blue Jays’ top prospect — his mound opponent seemed a better bet to perform under the pressure-packed lights of the postseason.
That didn’t happen. Yesavage, who began the year in Low-A and didn’t make his major league debut until September 15, not only kept the Yankees off the scoreboard, but he did so in spectacular fashion. As for Fried — ditto his teammates who followed him on the bump — it was a veritable horror show. He got rocked. When all was said and done, Toronto had bombarded the Bronx Bombers to the tune of a 13-7 rout that wasn’t as close as the final score suggested. The win gave the Blue Jays a 2-0 lead in the best-of-five Division Series.
That Canada’s team launched four home runs and took a 12-0 lead before the Yankees recorded their first hit — a sixth-inning single after Yesavage had left to a huge ovation — isn’t exactly a footnote to what transpired at Rogers Centre. It was an impressive onslaught. Even so, what the 22-year-old right-hander with the power arsenal did was the story of the day. Read the rest of this entry »