Archive for Featured

Cavan Biggio Talks Hitting

Cavan Biggio has turned yet another corner this season. One year after blasting 26 home runs in Double-A New Hampshire, the 2016 fifth-round pick has ridden a torrid start at Triple-A Buffalo to a spot in the Toronto Blue Jays lineup. And while he remains an unfinished product, the early returns have been promising. Since debuting on May 24, the son of Hall of Famer Craig Biggio has a 114 wRC+, and he’s gone deep five times.

What type of hitter is the 24-year-old infielder? Part of that answer can found within our Blue Jays Top Prospects writeup, which dropped prior to spring training. A more recent, and much more comprehensive look, went up just one week ago, courtesy of my colleague Devan Fink.

And then there is Biggio’s own take. The young Blue Jays basher broke down his mechanics, as well as his power-and-patience approach, in a wide-ranging conversation that took place last weekend.

———

David Laurila: What is your hitting philosophy?

Cavan Biggio: “My goal is to get a pitch I can square up, and drive. Hitting the ball hard is my No. 1 goal. If I don’t get the pitch I want in the first couple of strikes, I’m going to take. Once I get to two strikes, I’m going to battle and just try to get on base.”

Laurila: Are you basically looking fastball middle?

Biggio: I’d say I’m pretty traditional in trying to hunt the heater. I look for a heater in the middle thirds: middle-in, middle, and middle-away. Those are the parts of the strike zone where I can do the most damage. I’ve also gotten better at recognizing offspeed while looking for the fastball, so if it’s a mistake— if it’s a hung breaking ball — hopefully I’m able to hold off a little bit, put a good swing on it, and barrel it up. So I’m basically trying to hit the heater, but if a guy makes a mistake with a breaking ball, I’m ready for that as well.”

Laurila: What is the key to recognizing an off-speed pitch, particularly one you can handle? Read the rest of this entry »


Edgar: An Autobiography is Yet Another Hit for Martinez

Edgar Martinez’s story — at least as recounted in Edgar: An Autobiography, written with veteran Seattle sports scribe Larry Stone and published by Triumph Books earlier this month — reads like something of a fairy tale. Born in New York City in 1963, he moved to Puerto Rico when his parents split, and was raised in the Maguayo neighborhood of Dorado by his maternal grandparents, whom he chose to stay with at age 11, even after his parents reconciled and returned to New York. Though his love for the game was kindled by the heroics of Roberto Clemente in the 1971 World Series, and his development stoked by his relationship with cousin Carmelo Martinez, who spent nine years in the majors (1983-91), he didn’t sign a professional contract until just before his 20th birthday; putting aside $4-an-hour work on an assembly line, he received just a $4,000 bonus from the Mariners. Despite hitting a homerless .173 in his first professional season (1983), and battling an eye condition called strabismus, in which his right eye drifted out of alignment, the Mariners stuck with him.

While Martinez debuted in the majors in 1987, he spent three seasons trying to surmount the Mariners’ internal competition at third base, wound up shuttling back and forth to Triple-A Calgary, and didn’t secure a full-time job until 1990, his age-27 season. Though he won a batting title in 1992, a slew of injuries — shoulder, hamstring, wrist — threatened to derail his career until the Mariners convinced him to become a full-time designated hitter. Once he did, he became one of the AL’s most dominant players; from 1995-2001, he hit .329/.446/.574 for a 162 wRC+ (third in the majors) and 39.9 WAR (seventh, less than one win behind teammate Ken Griffey Jr.).

His heroics not only helped the Mariners reach the playoffs for the first time in 1995 (a year in which he also won his second batting title), but he became a one-man wrecking crew in that year’s Division Series against the Yankees, capping his .571/.667/1.000 performance with a series-winning double in Game 5 that basically saved baseball in Seattle. Remaining with the team for the duration of his career, which lasted through 2004 and included three other postseason appearances, further endeared him to a city that watched Griffey and fellow Mariners Randy Johnson and Alex Rodriguez depart for greener pastures. When he retired, Major League Baseball renamed its annual award for the best designated hitter in his honor. Earlier this year, in his 10th and final cycle of eligibility, he was elected to the Hall of Fame, that after more than tripling his support from just four years earlier.

Martinez’s arc seems so improbable, and yet it’s all true. Over the course of Edgar’s 352 pages, Martinez candidly details the highlights and lowlights of his career, the big decisions, unlikely events, and tactics that helped him surmount so many obstacles. Stone provides testimony from his former managers, coaches, and teammates in the form of sidebars that offer additional perspectives and enhance the narrative.

Read the rest of this entry »


Brandon Woodruff Rebuilt Himself as a Starter

Brandon Woodruff did everything he could for the Brewers in 2017 and 2018. When the rotation needed reinforcements at the end of 2017, he started eight games. When the team needed relief arms in 2018, he filled whatever innings they needed — 10 of his 15 relief appearances went more than an inning, and he contributed four spot starts when the Brewers needed an occasional extra starter. This year, the team needs a starter again, and Woodruff has outdone himself. In 16 starts, he’s gone from solid bullpen arm to the best starter on a playoff team. If the team needs a pitcher to start an elimination game, Woodruff is probably the man for the job.

If I had been asked to make a prediction about Woodruff before the season, I think I would have landed somewhere near our Depth Charts projections — 23 starts, a 4.30 ERA and FIP, and peripherals that looked worse than his 2018 relief turn, when he struck out 26.7% of batters he faced and walked 8%. Pitchers who switch from relieving to starting tend to have worse rate stats across the board, and nothing about Woodruff screamed exception. Instead, he’s improved in essentially every category. He’s striking out 29.6% of the batters he faces, and walking only 6.5%. His FIP is 0.23 lower than it was last year. Heck, he’s gained fastball velocity, something you’re not supposed to do when throwing more pitches per game.

Luckily for the purposes of our analysis, however, he’s also made some changes in approach that we can pore over. If all there was to Woodruff’s improvement was a tick on his fastball, there wouldn’t be much to say. But that’s not how Brandon Woodruff’s season has gone. He has overhauled his arsenal and approach in ways that look well thought-out and sustainable to me. Read the rest of this entry »


The ZiPS (Almost) Midseason Update – National League

Welcome to the more interesting league. Back in 2015, ZiPS saw two very different leagues — an American League in which most of the teams were competitive, and a bifurcated National League that featured a stronger line between the haves and the have-nots than 1780s France. By mid-September of that year, just one team in the the American League (the Oakland A’s) was positioned to finish with a sub-.500 record; only two were on track to reach the 90-win mark. As for the Senior Circuit, ZiPS thought that six of baseball’s best eight teams resided there, as well as five of the six worst.

In four years, these positions have done a Freaky Friday switcheroo. The AL is now home to six of the eight teams with the best projected rosters and six of the eight with the worst, with only three AL West teams (the A’s, Rangers, and Mariners, in that order) representing the middle class. The average NL trailer is 9 1/2 games back in the division and 3 1/2 back of a wild card berth compared to the AL’s 14 games and 8 1/2 games respectively.

So how do the ZiPS in-season projections work? For the Big, Official projections, I use the full ZiPS model rather than the comparatively simple in-season version in an effort to get the best estimates possible. Each player receives a percentile projection, with ZiPS randomly selecting from each player’s distribution to get a range of the expected roster strength for each individual team. Then each team is projected against every other team in their schedule a million times for the rest of the year. All this has the benefit of getting more accurate tails, as opposed to the binomial distribution you get when you’re working with an assumed roster strength; one of the most important things about ZiPS is that on all layers, it’s designed to be skeptical about its own accuracy.

ZiPS Playoff Matrix – 6/21
To Win 10th 20th 30th 40th 50th 60th 70th 80th 90th
NL East 88.6 90.2 91.4 92.5 93.6 94.6 95.8 97.2 99.0
NL Central 86.3 87.7 88.7 89.7 90.5 91.4 92.5 93.6 95.3
NL West 97.7 99.7 101.1 102.4 103.5 104.6 105.8 107.2 109.2
NL Wild Card 1 85.4 86.4 87.2 87.9 88.5 89.2 89.9 90.7 91.9
NL Wild Card 2 83.3 84.2 84.9 85.5 86.0 86.6 87.2 87.9 88.8

According to projections, the eventual NL Central winner will be under 95.3 wins 90% of time, assuming a strange world in which we can play out the final three months of the season a million times. That barely gets you the home field-advantaged wild card spot in the American League half the time. If the National League doesn’t have an exciting trade deadline, maybe we should start to think that something’s up, given that mid-to-upper 80s in wins makes you a serious wild card contender. Only two teams in the league ought to actually be sure about throwing in the towel right now: the Marlins and the Giants.

ZiPS Mean Projected Standings – NL East – 6/24
Team W L GB PCT Div % WC % Playoff % WS Win % No. 1 Pick Avg Draft Pos
Atlanta Braves 93 69 .574 86.2% 10.7% 96.9% 8.4% 0.0% 24.5
Washington Nationals 86 76 7 .531 11.0% 45.8% 56.8% 1.9% 0.0% 19.1
Philadelphia Phillies 81 81 12 .500 1.5% 14.2% 15.7% 0.4% 0.0% 14.8
New York Mets 81 81 12 .500 1.3% 12.9% 14.3% 0.3% 0.0% 14.5
Miami Marlins 59 103 34 .364 0.0% 0.0% 0.0% 0.0% 7.1% 3.0

Back in April, this race projected to be the second most exciting in baseball after the NL Central, with four teams projected between 87 and 93 wins and the fifth projected to, well, complete the 2019 season without folding (I’ll leave the identities of these teams for you to figure out). Instead, with a 16-5 record in June, the Atlanta Braves have put some real daylight between themselves and their rivals. Dallas Keuchel is not a superstar, but he also represents the biggest addition to an NL East team so far, one which addressed a significant team worry. With the deepest farm system in the division and a likely willingness to add salary for the right player, the “intangible” projections may be even better than what my computer spits out.

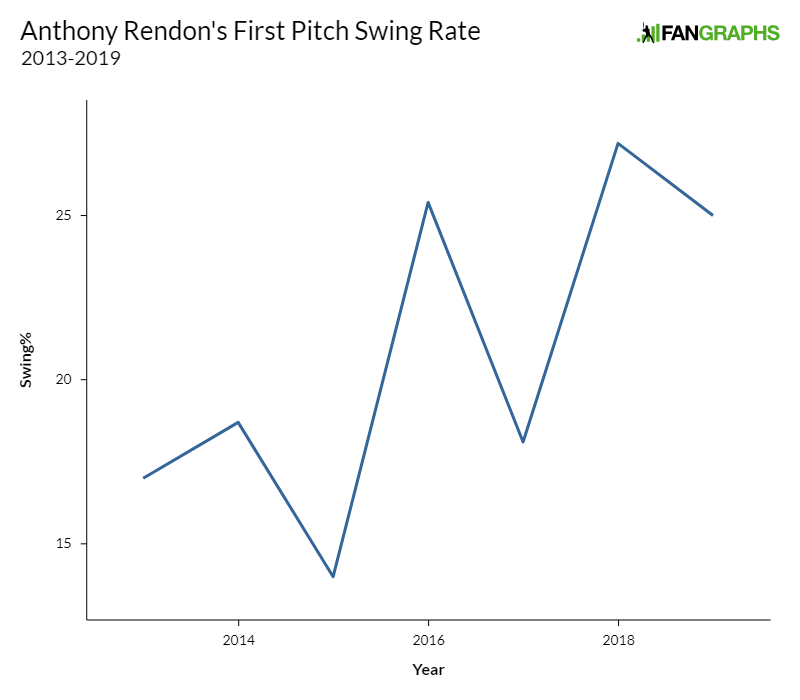
The Nationals have shown a pulse in June, enough to get them within a couple games of second place in the division. ZiPS still sees Washington as the team with the strongest overall 2019 roster in the East, with an 11-point edge in winning percentage over the Braves in a theoretical world in which the teams played identical schedules. But that margin is smaller than it was at the start of the season and it’s simply preferable to be the team with the 8 1/2 game advantage than the one that’s slightly better on paper. Start the grandmaster out without a couple of pawns, and a highly-skilled amateur chess player will probably win. If anything, it makes the decision to make trades in July a little trickier; it’s easier psychologically to shop Anthony Rendon or Max Scherzer if you’re not competitive. And with a weak farm system, the Nats don’t have a lot of ammo. Perhaps they’d be well-served to stop giving away interesting relievers.

I’m Just Saying…
Player WAR
Austin Adams 0.5
All Nationals Relievers 0.1

As of this morning, the Mets were closer to the Marlins than the Braves in the division. The team made significant improvements in the offseason, but those moves also had the feeling of being half-measures, with team ownership still not wanting to spend money at the level you would expect from a team in a massive market (even if they do play second fiddle). The rotation’s 4.64 ERA left pitching coach Dave Eiland as the team’s designated scapegoat for its failings, but the real culprit here is the team defense. At -55 runs (if you believe the numbers from Baseball Info Solutions), a league-average defense would have the Mets at a 3.92 ERA, fourth in the National League. Even UZR’s less depressing estimates would place the Mets with a 4.27 ERA, better than the NL’s current 4.37 average. I’m sure threatening two or three more journalists will fix that right up.

I’m not going to fault the Phillies for Bryce Harper’s rather pedestrian offense. But I will fault them for their apparent disinterest in either Dallas Keuchel or Craig Kimbrel. While only one team could sign each player, none of the usual sources buzzing around the Phillies suggested that they ever had more serious interest than their public demeanor reflected. Losing Andrew McCutchen — even a post-star McCutchen — was a blow the team is ill-positioned to handle and one it can’t wait to address.

Caleb Smith is likely a real find, certainly more of one than I envisioned when the Marlins picked him up from the Yankees in 2017. Garrett Cooper is likely the only interesting player on the team’s offense (he’s 28, but a long way from free agency), which makes one ask the very real question of how Miami managed to get more for Mike King than for Chris Paddack, Josh Naylor, and Luis Castillo combined. Perhaps the Marlins tanking is somehow less depressing than the Marlins trying to contend?

ZiPS Mean Projected Standings – NL Central – 6/24
Team W L GB PCT Div % WC % Playoff % WS Win % No. 1 Pick Avg Draft Pos
Chicago Cubs 89 73 .549 56.2% 24.5% 80.8% 4.6% 0.0% 21.4
Milwaukee Brewers 87 75 2 .537 31.5% 32.9% 64.4% 2.8% 0.0% 19.7
St. Louis Cardinals 83 79 6 .512 10.7% 22.6% 33.4% 1.1% 0.0% 16.9
Cincinnati Reds 78 84 11 .481 1.5% 5.5% 7.0% 0.2% 0.0% 12.8
Pittsburgh Pirates 74 88 15 .457 0.1% 0.5% 0.6% 0.0% 0.0% 9.2

The Central feels a lot like the division that nobody wants to win. Four of the five teams have held first place for multiple consecutive days, and not just at the start of the season when you have a bunch of 2-0 and 1-1 records floating around the league. While nobody has achieved any permanent daylight, I still think the Cubs have the best chance of doing so. Kimbrel may not be at his peak, but his signing and the theoretical return of Brandon Morrow would address what has been the team’s largest hole.

While the Brewers aren’t a depressing franchise, their use of Keston Hiura and Travis Shaw is a real head-scratcher. At the start of the season, I felt the team’s best use of Hiura would be to start him in the minors and have him bash his way into the majors, allowing them not to worry about having to make a difficult decision. The first part of that plan seemed to work out, but even with Shaw struggling and Hiura slugging .531, the Brewers haven’t been able to make the hard choice to turn Shaw into a reserve and make the team better right now. Yes, Hiura’s strikeout-to-walk ratio in the majors didn’t exactly scream Joey Votto, but he’s actually hitting the ball once in a while. ZiPS estimates that starting Shaw instead of Hiura over the rest of the season costs the Brewers about a tenth of a playoff appearance. That’s not negligible.

Who would’ve thought the bullpen would be the best part of the Cardinals? Yes, Paul Goldschmidt should be hitting better and Matt Carpenter should be hitting better and most of the rotation should be pitching better, but there’s no such thing as a Should NL Central winner. The Cards are a hard team to upgrade, simply because there aren’t many obvious places to give out pink slips. ZiPS is down to believing the Cards are a .510 team.

The Reds are a better team than their record, but the math remains daunting. How damaging was the team’s 1-8 start? They’ve gone 35-32 since, have a 43-33 Pythagorean record overall, and their 7.0% projected playoff chance is still behind their preseason projection of 11.5%. But at least they’re actually putting their best possible lineup on the field, with Jesse Winker, Nick Senzel, and Yasiel Puig as a fairly stable outfield. It would have been nice if they had just committed to this group from the start rather than trying to get Matt Kemp at-bats and seeing more in Scott Schebler than a fourth outfielder. Derek Dietrich’s offense has been encouraging, but it’s perhaps his defense that’s been the bigger surprise. He could always hit, but his defensive numbers at second are much more adequate than they were in his Marlins days. Small sample size, of course.

As for Pittsburgh, I don’t think they have the arms to peek back over the .500 mark for any extended period of time this year. With a healthy Jameson Taillon, and Chris Archer looking more like the Cy Young threat he once was, the division’s middle-heavy enough that the Pirates could be a contender. I don’t think they are, though.

ZiPS Mean Projected Standings – NL West – 6/24
Team W L GB PCT Div % WC % Playoff % WS Win % No. 1 Pick Avg Draft Pos
Los Angeles Dodgers 104 58 .642 100.0% 0.0% 100.0% 19.6% 0.0% 29.0
Arizona Diamondbacks 80 82 24 .494 0.0% 12.3% 12.3% 0.3% 0.0% 14.2
Colorado Rockies 80 82 24 .494 0.0% 11.7% 11.7% 0.2% 0.0% 14.1
San Diego Padres 78 84 26 .481 0.0% 6.2% 6.2% 0.1% 0.0% 12.7
San Francisco Giants 69 93 35 .426 0.0% 0.0% 0.0% 0.0% 0.0% 6.4

It’s only really a 100.0% chance to win the NL West because of rounding, but it’s hard to envision a scenario in which the Dodgers blow a 13-game lead. Maybe, if there was another top team in the division that was simply underperforming, you could squint your way to seeing some type of apocalyptic scenario in which a second place team goes 55-25 in the second-half while Cody Bellinger and Hyun-Jin Ryu are captured by brigands in a forest. You can’t even “But ’69 Mets!” here — that team maxed out at a ten-game deficit. Okay, the Bucky Dent Yankees, but who in the division has a Goose Gossage or a Reggie Jackson?

Suffice it to say, Goose Gossage might actually upgrade the Colorado Rockies bullpen. I don’t mean 1978 Gossage — I mean Gossage now. In truth, Colorado’s bullpen hasn’t really been that mad, but they tend to fail in the most spectacular ways possible, as seen in their three straight walk-off losses against the Dodgers. In typical Colorado fashion, the team ranks 22nd in position player WAR and 22nd in wRC+ and I’m not sure anyone in the front office realizes this.

The Padres are obviously not as good a team as the Dodgers, but they’re the most fascinating team to watch, simply because of the young talent that will inevitably reach the majors in the next few years. I remain at a loss as to why they’ve been so conservative with Luis Urias, who is likely to be part of the best possible lineup right now (and I say this as someone who is a fan of Ian Kinsler as a player). It’s hard to blame any fiduciary shenanigans given that the team pointedly decided to not play those sorts of games with Paddack or Fernando Tatis Jr. The team is obviously pleased to be wild card-relevant, though I don’t think they’ll do anything to jeopardize the real show, which should start as soon as next year.

The Diamondbacks continues to accidentally contend, but I still think they’re more likely to trade off the reasons for that contention rather than make any additions. I still don’t believe Zack Greinke finishes his contract in Arizona, and I wouldn’t be surprised to see Robbie Ray go. I think either Greinke or Ray are potentially more impactful pickups than Madison Bumgarner would be and there’s an actual Bumgarner market. It’s hard to see the Diamondbacks as a good enough team to be able to turn down solid offers should they materialize.

Every year, there’s a team that’s rebuilding that doesn’t quite realize it. Right now, that’s the San Francisco Giants. Other teams have come back from deeper pits than 33-43, but most of those other teams were more talented. The Giants have already played 13 different players in the outfield and just claimed Joey Rickard on waivers. By comparison, the Yankees have had most of their desired starting lineup on the IL but have only used nine.


Justin Verlander Is Dominating Despite All of the Dingers

It’s been a weird season thus far for Justin Verlander. On the one hand, the 36-year-old righty has enjoyed dominant stretches and generally pitched well enough to put himself in the conversation for another All-Star appearance (perhaps even a start) and that elusive second Cy Young Award, all while advancing his case for eventual election to the Hall of Fame. On the other hand, he’s struggling to keep the ball in the park like never before — but then, that describes most pitchers in a year of record-setting home run rates. The combination has created some very unusual, extreme statistics

On Sunday, Verlander threw seven strong innings against the Yankees in the Bronx, allowing just four hits, two walks, and three runs while striking out nine. The runs all came via a three-run homer by DJ LeMahieu, but the blast was of trivial importance, hit at a time when the Astros owned a commanding 9-0 lead. The trivia was shared by both teams. It was the 26th straight game in which the Yankees homered, a franchise record and one short of the major league record, held by the 2002 Rangers. It was also the first time since April 15, 2017 — back when he was still a Tiger — that Verlander had surrendered a three-run homer.

I’ll get back to the home runs momentarily. The Astros’ 9-4 win gave Verlander his 10th victory of the season and the 214th of his career; he’s second among active pitchers behind only CC Sabathia, who claimed his 250th win last week. His 142 strikeouts trail only teammate Gerrit Cole for the league lead, while his 2.67 ERA is good for fourth. However, because he’s served up 21 homers in 114.2 innings — a career-high 1.65 per nine — his FIP is a less-impressive 3.77, and his ERA-FIP differential of -1.10 ranks third in the AL. Depending upon one’s choice of pitching value metrics, he either looks like a Cy hopeful (second in bWAR at 3.8) or just a solid All-Star candidate (tied for ninth in fWAR at 2.5). Read the rest of this entry »


The Legal Ramifications of the Two-City Rays

By now, you’re undoubtedly aware that Major League Baseball gave the Tampa Bay Rays the go-ahead to explore playing a divided home schedule between St. Petersburg and Montreal. The plan is certainly ambitious, if nothing else:

Though no details of the overall plan are set, the basic framework is for the Rays to spend the first 2½ months or so of the season, playing about 35 of their 81 home games, in Tampa Bay, then move north by early June to finish the schedule in Montreal.

The Rays can pay the players for the inconvenience, similar to the stipends they get for taking international trips, and as part of a compensation package that also could offset other issues such as taxes, currency exchange (though they’re paid in U.S. dollars) and family travel costs.

But practical issues aside, the idea also faces a series of legal hurdles. First, the team’s use agreement with the city of St. Petersburg simply doesn’t allow it. That’s right – the Rays, unlike most teams, aren’t technically a tenant. They’re legally a licensee, as Eric Macramalla explains for Forbes:

The Rays never signed a traditional lease. Rather, they signed a Use Agreement, which, to say the least, is an onerous agreement that strongly favors St. Petersburg. A Use Agreement is in stark contrast to a traditional lease, where a tenant typically owes the landlord what’s left on that lease after breaking it.

As for sharing games with Montreal, the Use Agreement at Section 2.04 expressly provides that the Rays must “play all its homes games” at Tropicana Field unless St. Petersburg consents to the Rays playing some of its game elsewhere.

Read the rest of this entry »


Sunday Notes: Tyler Clippard’s New Pitch Came Out of His Back Pocket

Tyler Clippard got top billing in this column nine months ago. A Toronto Blue Jay at the time, he boasted a 3.17 ERA, and had allowed just 6.5 hits per nine innings over 696 career appearances. Thanks in part to a lack of save opportunities, he was one of the most-underrated relievers in the game.

Twisting a familiar phrase, the more things remain the same, the more they change. Clippard is now a Cleveland Indian, and while he’s still gobbling up outs — his 3.05 ERA and 5.2 H/9 are proof in the pudding — he’s getting them in a new way. At age 34, having lost an inch or two off his fastball, the under-the-radar righty has pulled an old pitch out of his back pocket.

“Toward the end of last season, I started to incorporate a two-seamer,” said Clippard, who’d scrapped the pitch after transitioning to the bullpen in 2009. The new role wasn’t the primary driver, though. As he explained, “I mostly got rid of it because it wasn’t necessarily sinking. I thought, ‘If it’s not sinking, why should I throw it?’”

A decade later, a reason for throwing it emerged.

“Traditionally, I’ve been a fly-ball pitcher and have given up home runs,” said Clippard, who has surrendered 99 of them at baseball’s highest level. “In the overall scheme of things, I have’t been too concerned about that. There was a year, 2011, when I gave up 11 home runs — which is a lot for a reliever — but I had a 1.83 [ERA]. I can give up home runs and still be fine. At the same time, if I can keep the ball in the ballpark a little bit more, that’s obviously going to benefit me.”

Hence the reintroduction of a two-seamer… this despite the fact that it isn’t diving any more now than it did a decade ago. Read the rest of this entry »


A Conversation with Phil “The Vulture” Regan

The New York Mets made an out-of-the-box move yesterday, hiring 82-year-old Phil Regan as their interim pitching coach. The former big-league hurler, and longtime coach, takes over for Dave Eiland, who along with understudy Chuck Hernandez, was relieved of his duties in the throes of what has been an underachieving season.

As you should be aware, Regan’s nickname is “The Vulture.” It was given to him by Sandy Koufax, in a year that Regan went 14-1 out of the Dodgers bullpen with 21 saves and a 1.62 ERA. Prior to that 1966 season, he’d pitched primarily as a starter for the Detroit Tigers, the team he grew up rooting for in rural Michigan. Overall, Regan appeared in 551 games, for four teams, from 1960-1972.

The excerpted interview that follows was conducted approximately five or six years ago and was intended for inclusion in a book project — conversations with Detroit Tigers players of yesteryear — that has remained on the back burner. Given the timeliness of Regan’s hiring, I am choosing to share highlights from the interview here.

———

David Laurila: You were born in 1937, and grew up in southwest Michigan rooting for the Tigers.

Phil Regan: “Yes, I grew up in a town called Wayland. My earliest recollection of the Tigers was listening to Harry Heilmann call games on the radio. I recall players like George Kell, Johnny Lipon, Hoot Evers, Johnny Groth, and Vic Wertz. But my favorite of all was Hal Newhouser. He always seemed to be the one who pitched on Sundays, often against Bob Feller. He was my hero.

“During the week, I’d rush home from school, turn on the radio, and listen to Harry Heilmann and then, later on, Van Patrick. In those days we didn’t have a lot of television, but we always had the games on the radio. Of course, being from Michigan, I grew up wanting to play for the Tigers.”

Laurila: You ended up signing with them after graduating from high school.

Regan: “I did. As a kid, I never really got to play many games of baseball, because I lived out on a little farm, near a little town. Mostly I threw against a barn, with my brother, and stuff like that. But I had a good arm, and after graduating I was invited to Tiger Stadium to work out. They offered me a contract, but I decided that I wanted to go to Western Michigan [University]. After a year at Western, I decided to sign with the Tigers. From there I went into their minor league system.”

Laurila: How much did you sign for? Read the rest of this entry »


Lance Lynn, AL Pitcher WAR Leader

In the winter of 2017, Lance Lynn was coming off a season with a solid 3.43 ERA but poor peripheral numbers and couldn’t get the multi-year deal he desired, eventually settling with the Minnesota Twins. Lynn got off to a rough start, but from May on he put up a 3.34 FIP and a 4.13 ERA with the Twins and Yankees (following a trade), with the former number making Lynn one of the top-15 pitchers in the game and the latter number befitting an average-to-slightly above-average innings-eater. Heading into 2018, Lynn was paid based on his poor FIP and not his solid ERA, but heading into 2019, Lynn received a contract based on his average ERA and not on his very good FIP. Lynn agreed to a three-year deal worth $30 million to pitch for Texas, and 15 starts into in his Rangers career, the MLB pitching WAR leaderboard looks like this:

MLB Pitching WAR Leaders
Name IP K/9 BB/9 ERA FIP WAR
Max Scherzer 106.1 12.4 1.9 2.62 2.19 4.2
Lance Lynn 93 9.9 2.3 4.16 3.00 3.2
Hyun-Jin Ryu 93 8.2 0.5 1.26 2.51 3.1
Matthew Boyd 88.2 11.4 1.7 3.35 3.00 2.8
Chris Sale 90.1 13.0 2.1 3.49 2.80 2.8
Lucas Giolito 85.1 11.0 3.1 2.74 3.08 2.8
Gerrit Cole 96.2 13.8 2.3 3.54 3.10 2.7
Jose Berrios 97.2 8.7 1.6 2.86 3.52 2.6
Frankie Montas 82 9.7 2.3 2.85 2.89 2.6
Charlie Morton 87.1 11.0 3.2 2.37 2.88 2.5
Jacob deGrom 91 11.1 2.0 3.26 3.21 2.5
Jake Odorizzi 76.1 10.0 2.8 2.24 2.99 2.4
Stephen Strasburg 96 10.8 2.3 3.75 3.27 2.4

There’s Max Scherzer at the top, and right behind him is Lynn with 3.2 wins above replacement on the season. While some might have the urge to point to Lynn’s 4.16 ERA and insist there is something wrong with WAR, particularly at FanGraphs, I would request fighting against any such urges. First, I’d like to note that over at Baseball-Reference, Lynn’s 2.7 WAR ranks 12th in all of baseball and isn’t too far off from the one above. As for that ERA, Lynn has put together an unusual season with respect to runs allowed. First, Lynn has no unearned runs on the year. While most pitchers’ earned run totals are around 90%-95% of their runs allowed, Lynn’s runs have all been earned. Indeed, Rangers pitchers outside of Lynn have earned run totals that are 93% of their total runs allowed. While it is possible that Lynn has benefited from great defense, that’s unlikely as we’ll get to below. In any event, that explains roughly 0.3 of Lynn’s higher ERA. Read the rest of this entry »


Anthony Rendon Keeps Getting Better

The first round of All-Star voting comes to a close on June 26th, which means we’re just over a week away from an annual tradition unlike any other: Anthony Rendon not getting the respect he deserves. He’s sitting fifth among NL third basemen in the vote, below the top-3 cutoff for this year’s final-day runoff. He’s also sixth in the majors among all batters in fWAR, which likely means he’ll make his All-Star debut this year. Yes, you read that right — Anthony Rendon has never been an All-Star.

All-Star results aren’t everything, of course. They matter for arbitration payouts, as Tommy Pham will tell you, but they’re not always (or even often) accurate reflections of who has provided the most value on the field. Still, it’s remarkable that Rendon has never been an All-Star. Since he debuted in 2013, he’s been the 12th-most valuable hitter in baseball, second only to Josh Donaldson among third basemen. If Rendon makes the team this year as a reserve, it will be fitting, because he’s never been more deserving than he is right now; he’s taken his offensive game to new heights from an already impressive baseline. He’s been outright Trout-ian at the plate this year, fixing weaknesses while sticking with strengths.

When I looked into Rendon’s 2018 this offseason, I focused on his newfound aggression. He increased his swing rate more than almost every other player in baseball last year, particularly on the first pitch of a plate appearance. Looking back a few more years, this seems like a change Rendon has been leaning into over time. He was passive to start at-bats at the start of his career, and he has been ramping it up over time, though he’s dialed it back marginally this year:

First-pitch swing rate is a blunt tool. Imagine a batter who is universally feared. Pitchers rarely attempt to challenge him. They throw him strikes on only 10% of first pitches. He’s wildly aggressive, swinging at 80% of strikes and 10% of balls. Still, that’s only an 17% swing rate, which sounds quite passive. Imagine another hitter, this one a patient sort with no pop whatsoever. Pitchers absolutely pound the zone against him — we’re talking a 90% zone rate, completely unheard of. He’s one of the most patient hitters in baseball, only swinging at 20% of strikes, and no balls whatsoever. This gets him to an 18% first-pitch swing rate. Clearly, we need to consider how pitchers attack Rendon to say anything definitive about his swing rates. Read the rest of this entry »