For years now, a simple message has been gaining traction in major league bullpens and pitching labs: Just throw it down the middle. As big league pitches have gotten speedier and bendier, the people who throw them have been increasingly advised to trust their stuff, stop nibbling around the edges, and attack the heart of the zone. Adam Berry wrote about the Rays adopting this approach in 2021. In 2022, Bryan Adams superfan Justin Choi looked into the numbers and noted, “In each season since 2015, when Statcast data became public, hitters have accumulated a negative run value against down-the-middle fastballs.” Last year, Stephanie Apstein documented the phenomenon in Baltimore, while Hannah Keyser and Zach Crizer did the same on a league-wide basis, describing the Rays model thusly:
Step 1: Develop unhittable stuff
Step 2: Let it rip down the middle
Step 3: Win
Just last week, Jeff Fletcher wrote that after trying and failing to get their pitchers to attack the zone more often, the Angels started putting their pitchers in the box to face their own arsenal, courtesy of a Trajekt pitching machine. “I knew my pitches were good,” said José Soriano through an interpreter, “but when I faced myself, I find out they’re really good. So I have more trust in my stuff now.” Pitches right down the middle are called meatballs for a reason, but if you’ve ever watched peak Max Scherzer demolish the heart of the other team’s lineup by simply pumping 97-mph fastballs across the heart of the plate, none of this comes as a galloping shock.
Still, I wondered whether I could find data to back up this shift in mindset. Are pitchers really attacking the zone more often? And are better pitching staffs (or staffs with better stuff) really attacking the middle of the plate more often? After all, the Angels rank 22nd in Stuff+ and 14th in PitchingBot Stuff, not to mention near the bottom in ERA, FIP, and xFIP. If they feel this good about their stuff, I’d imagine that every team does. Read the rest of this entry »
On the first knuckleball thrown at Coors Field in 16 years, Matt Waldron hit home plate umpire Bill Miller right in the nuts.
Nobody — not Waldron, not his catcher Kyle Higashioka, not Miller — appeared to know where the ball was going. Despite Higashioka frequently (and understandably) struggling to track the flight of the ball throughout the rest of the night, Waldron delivered a career-best performance, allowing just one run over six innings.
Perhaps the most surprising part of his performance was the setting. Since 2008, knuckleballers have dodged outings at Coors Field, which sits 5,200 feet above sea level. Conventional wisdom dictates that knuckleballs at altitude are a bad idea, as Cy Young-winning knuckleballer R.A. Dickey told Dave Krieger back in 2012. Read the rest of this entry »
The catcher pickoff is one of my favorite plays in baseball. It’s impressive almost every single time. Not only do backpicks call for remarkable agility and arm strength on the catcher’s part, but they also require a Holmesian ability to read the diamond. Are any runners getting cocky? Is the defense ready for a pickoff throw? Can the team risk a throwing error? The catcher needs to make those decisions rapidly, all while still performing his regular duties behind the plate. It’s not easy.
To that point, I like catcher pickoffs so much because they’re a nice reminder of the level of talent on display in professional baseball. In all my years of childhood rec league play, I never saw a catcher pull off a backpick. I don’t think I ever saw anyone try. The chances of success were too low, and the risk of a catastrophic error was too high. Catcher pickoffs are better left to the professionals. Yet this year, even the professionals are leaving them to someone else.
Here is a supercut of every catcher pickoff so far in the 2024 season. You might notice there aren’t many:
According to the records at Baseball Reference, there have been a total of seven catcher pickoffs this year. Just past the quarter mark of the season, that puts the league on pace for 26 backpicks in 2024. Last year, there were 49. In each of the previous two seasons, we saw 51. Over the last two decades, there has never been a full season with fewer than 41 catcher pickoffs. The numbers are, perhaps, even more dramatic if you remove cross-listed pickoff/caught stealing plays. There have only been five pure catcher pickoffs this year, putting the league on pace for just 19 by season’s end:
Catcher Pickoffs Are Way Down
Year
All Catcher Pickoffs
Full-Season Pace
Pure Catcher Pickoffs
Full-Season Pace
2024
7
26
5
19
2023
49
49
34
34
2022
51
51
40
40
2021
51
51
40
40
2020
17
46
15
41
2019
67
67
50
50
SOURCE: Baseball-Reference
In 2023, the league leaders in catcher pickoffs were Keibert Ruiz (6), Patrick Bailey (4), and Francisco Alvarez (4). In 2022 and ’23 combined, the leaders were Ruiz (10), Jose Trevino (7), and Elias Díaz (6). While three of those five catchers have spent time on the IL this season, that group has still combined to catch 933.1 innings over 115 games. That’s nearly equivalent to a full season of work behind the dish. They have yet to pick off a single runner.
Here’s another fun way to think about how few catcher pickoffs we’ve seen in 2024. So far this year, there have been more successful steals of home plate (9) than successful catcher pickoffs (7). That’s partly because steals at home are up, but still, this simply doesn’t happen. Like, ever:
Data via Baseball Reference
Entering the 2023 season, I thought we might see an uptick in backpicks. I was hardly alone. Willson Contreras, one of the greatest backpick artists of his generation, took note of the fact that the new disengagement rules did not limit catcher pickoff attempts. He said the Cardinals would have to be “smart” regarding “when our catchers backpick runners.” Manager Oliver Marmol sang a similar tune, praising his new catcher’s pickoff abilities. He said Contreras would “play a big part” in preventing runners from “stretching out” their primary and secondary leads. More catchers, such as Sean Murphy (“Yeah, that means we’ll throw more”), and managers, including Gabe Kapler (“We’re emphasizing backpicks”), made similar remarks.
A few months into the 2023 season, Kiri Oler looked at the data and concluded that “the numbers suggest catchers could be throwing behind runners significantly more in the name of keeping runners on edge.” She found that backpicks were a much more effective tool for discouraging stolen bases than traditional pitcher pickoff throws. Yet, if catchers were throwing behind runners any more often, they weren’t earning any more pickoffs. League-wide catcher pickoff totals were remarkably consistent from 2021 to ’23. Now, in the second season under the new disengagement rules, catcher pickoffs are disappearing.
This disappearing act is especially noteworthy considering average catcher pop times have gotten quicker in recent years (at least as of Ben Clemens’s piece on the stolen base rate from last month). What’s more, it’s not as if runners have been extra cautious on the bases this season; if anything, it’s the opposite. The stolen base attempt rate is slightly up, while the stolen base success rate is slightly down. Similarly, runners are making outs on base (OOB) and taking extra bases (XBT%) at similar rates to last season, according to Baseball Reference.
Most interestingly, the decline in catcher pickoffs has not resulted in fewer pickoffs overall. Ninety-nine runners have been picked off this season, putting the league on pace for 368 pickoffs by the time the calendar flips to October. That would be the highest total in a single season since 2012. Needless to say, this means pitcher pickoffs are on the rise. If current trends hold, pitchers alone will finish the season with more pickoffs (342) than pitchers and catchers combined in 2023 (341). Pitchers have not surpassed the 300-pickoff mark since 2012; they’re on pace to smash past that threshold in 2024.
On the one hand, it makes sense that pitchers would improve their pickoff throws with a full season of new disengagement rule experience under their belts. That said, it stands to reason that runners, too, would get better at making the most of the new rules. A recent article from The Athletic noted that “stolen-base percentages actually went down with each pickoff attempt last season, perhaps because baserunners were not yet attuned to exploiting the new rules. This season, runners are taking fuller advantage. According to STATS Perform, the stolen-base percentage after zero pickoff [attempts] is .77 percent. After one, it’s .81. After two, .87.”
Thus, while pitchers are getting better at picking off runners, the penalty of a failed pitcher pickoff attempt has increased. That being so, you might think catcher pickoffs would rise as a result. Runners’ taking more aggressive leads provides the opportunity, while the disengagement limit for pitchers provides the motive. The case is solid. Nevertheless, things certainly haven’t played out that way. What’s up with that?
Perhaps it isn’t really about the pickoffs, at least not directly. Instead, catchers might simply be placing greater emphasis on a different aspect of their game: framing. Teams knew pitch framing was important long before they had any metrics to quantify it. Now that we have the numbers, framing is more in vogue than ever. As a result, it’s likely teams are prioritizing framing over other strategies (i.e. pickoffs) in spring training, game plans, and the moment. I’ve already described how difficult a backpick can be. Now imagine trying to pull one off while simultaneously attempting to steal a strike. It’s all but impossible. If anything, I’d think backpicks have the opposite effect; pitches in the strike zone are probably more likely to be called balls on catcher pickoff attempts. Indeed, Noah Woodward found just that in a piece for his Substack, The Advance Scout. Woodward also suggests that the one-knee-down catching stance, known to help with pitch framing, makes it harder for catchers to pull off backpicks. As this catching setup rises in popularity, it makes sense that we would see fewer catcher pickoffs.
Good pitch framing isn’t nearly as exciting as a successful backpick, nor is an extra called strike nearly as beneficial as a pickoff. Ultimately, however, there’s more value to be gained from framing than backpicks over the course of the season. If a catcher can only do one or the other, it’s not hard to see why framing wins out. Even Willson Contreras seems to agree. Contreras recorded 28 pickoffs from 2016-22 with the Cubs. Throwing behind runners was his signature skill. Yet, ever since he signed with the Cardinals – who encouraged him to work on his framing and switch to a one-knee-down position – he has not picked off a single runner. The evidence may be circumstantial, but it’s still compelling.
If catchers are really letting pickoffs fall by the wayside in an effort to steal more strikes, it’s worth remembering that pitchers are picking up the slack. In other words, it might be a win-win. Since the disengagement limits were introduced, pitchers have been picking runners off with greater efficiency than before. That means pitcher pickoff attempts are less detrimental than we might have thought. Meanwhile, catcher pickoff throws still come with significant risk attached; as Kiri explained in her piece last year, the probability of an error is significantly higher on a catcher pickoff throw than a pitcher pickoff throw. Furthermore, while each pitcher disengagement marginally increases the chances of a successful steal, a throwing error all but guarantees the runner an extra base. Therefore, if pitchers can successfully pick runners off at a high enough rate, pitcher pickoff throws might be a safer option for the defense than backpick attempts. Hence the win on both fronts; catchers can be more efficient when they focus on framing over pickoffs, and pickoffs might still be more efficient coming from pitchers rather than catchers.
It will take a lot more data before we can say with any certainty that catchers are truly moving away from backpicks. After all, we’re only seven weeks into the season. Moreover, catcher pickoffs are always so low in number that the league-wide backpick pace could skyrocket quickly. But hey, if we always waited to write about trends until they were undeniable, we wouldn’t be doing a very good job telling the story of the season as it plays out. Pickoffs, both the catcher and pitcher variety, are something to keep a close eye on for the rest of the year. That shouldn’t be hard to do — pickoffs are pretty fun to watch.
Last week, I looked into the strange fact that starter usage hasn’t declined as precipitously as it first seemed over the past half decade. It’s downright strange that pitchers are throwing nearly as many pitches per start as they did in 2019, because it sure doesn’t feel that way. It’s even stranger that the average start length has declined by a mere half inning since 2008; I’m still scratching my head about that one even though I’m the one who collected the evidence.
One potential answer stood out to me: maybe I was just measuring the wrong thing. Meg Rowley formulated it a bit better when we discussed the article: Maybe by capturing all the pitchers in baseball, I was missing the change in workloads shouldered by top starters. In other words, no one remembers the pitcher who made the 200th-most starts (Xzavion Curry in 2023, Ryan Tucker in 2008), and the usage patterns of back-end starters don’t leave much of an impression in our minds. We care about the horses, the top guys who we see year after year.
Time for a new measurement, then. I took the same cutoff points from last week’s study, which serves to control for early-season workloads. But I further limited the data this time. I first took the 100 pitchers who had thrown the most innings in each year and called them “established starters” for the next year. Then I redid my look at pitch counts per start and innings pitched per start, but only for top pitchers in each year. Read the rest of this entry »
In the modern game, pinch-hitting is seen as something of a lost art. This likely started with teams prioritizing roster spots for extra bullpen arms over spare position players. With that came a heavier emphasis on positional flexibility off the bench, rather than plus contact skills (think Ross Gload) or a big bopping bat (à la Matt Stairs). As an angry Facebook commenter might tell you, it’s one more way that sabermetrics has ruined America’s pastime. Yet, the numbers bear it out; the best arm is often a fresh arm, while conversely, fresh bats off the bench tend to perform significantly worse than their counterparts in the starting lineup. Ahead of the 2020 season, Ben Clemens found that the pinch-hitting penalty, first theorized in 2006, still held 14 years later. Contemplating Ben’s findings, Patrick Dubuque of Baseball Prospectuspenned a line that stuck deep in my brain: “Pinch-hitters are just difficult to justify, except when they’re mandatory.”
Pinch-hitters were mandatory far less often in 2020 after the universal DH came into play. However, the age of the universal DH is also the age of expanded rosters and pitcher limits, and those new roster rules may just have saved the pinch-hitter from a slow demise. Pinch-hitters are rarely mandatory anymore, but they haven’t disappeared as much as you might think. Read the rest of this entry »
Release angles comprise the vertical and horizontal angles at which a pitcher releases a pitch. They are the natural counterpart to approach angles, except they capture the initial angle of a pitch’s trajectory rather than its final angle upon crossing home plate. Release angles can tell us a lot — namely, where a pitch is headed (or, at least, intended to go). However, we already have plenty of data to describe a pitch’s flight path. We have its short-form movement (i.e., total inches of break), as well as its acceleration and velocity vectors in all three dimensions, not to mention its final location coordinates. We can pretty much map the entire trajectory without release angles. Like the last unrevealed letter in Wheel of Fortune, you theoretically need it to solve the puzzle, but you can probably infer the word or phrase just fine without it. What are release angles, then, if not just a different way to describe a pitch’s movement in space? What information do release angles add? (Michael Rosen adeptly provided an answer to that question here.)
When a pitcher throws a pitch, the pitch reaches home plate in a fraction of a second. The opposing hitter, then, has a fraction of a fraction of a second to discern a great many things about the pitch: its velocity, its shape, its probable final location, all to then ascertain whether or not he should swing. Given the impossibly small window of time in which to make a swing decision, much of a hitter’s behavior is influenced by the untold thousands of pitches he’s seen before, like a mental library of pitch shapes. One of the very first visual cues a hitter receives, aside from the pitcher’s release point, is the angle at which a pitch leaves the pitcher’s hand. This particular visual cue ought to enable a hitter to determine out-of-hand a prohibitively bad pitch — one that, on most occasions, will not find the zone. He can potentially make a snap decision with a fairly high degree of confidence that the pitch will miss the zone. Read the rest of this entry »
In the course of researching the haphazard nature of JP Sears’ fastball command for my blog Pitch Plots, I realized I was missing the answer to a fundamental question: Why does the ball go where it goes?
Specifically, I had no idea which variables determine the physical location where a pitch crosses home plate. My first guesses revealed nothing: a combination of velocity, extension, spin, and release height had no relationship to a pitch’s eventual location. If it wasn’t any of these factors, what could Sears change to throw his fastball to better locations?
I was missing the key variable: the release trajectory. Trajectory, as defined here, is not just release height and width but also the vertical and horizontal release angles of the pitch, which are not widely available to the public on a pitch-by-pitch basis.
The release trajectory, it turns out, explains nearly everything about the ultimate location of a pitch. Read the rest of this entry »
I won’t sugarcoat it for you, friends. It’s a tough time to be a major league starting pitcher. Their ligaments are under threat like never before. Their workloads aren’t far behind. For a variety of reasons, the old style of starting pitcher is quickly headed toward extinction and we’re transitioning to a new way of doing things.
That all seems like the obvious truth. But I decided to go to the data and make sure. As Malice of the Clipse (and yes, fine, Edgar Allan Poe) memorably said, “Believe half what you see, none of what you heard.” I’m not sure exactly where that leaves you, since I’m going to be telling you what I saw, but that’s an epistemological question for another day. Let me just give you the data.
So far this year, there have been 452 games, and thus 904 starts. Starters have completed 4,735 1/3 innings, or 5.24 innings per start, and they’ve thrown an average of 86.2 pitches to get there. They’ve averaged 94.1 mph with their four-seamers, yet despite all that velocity, they’ve thrown fastballs of any type just 54.9% of the time. This isn’t Opening Day starters, or anything of that nature; it’s just whoever has picked up the ball for the first pitch on each side. Read the rest of this entry »
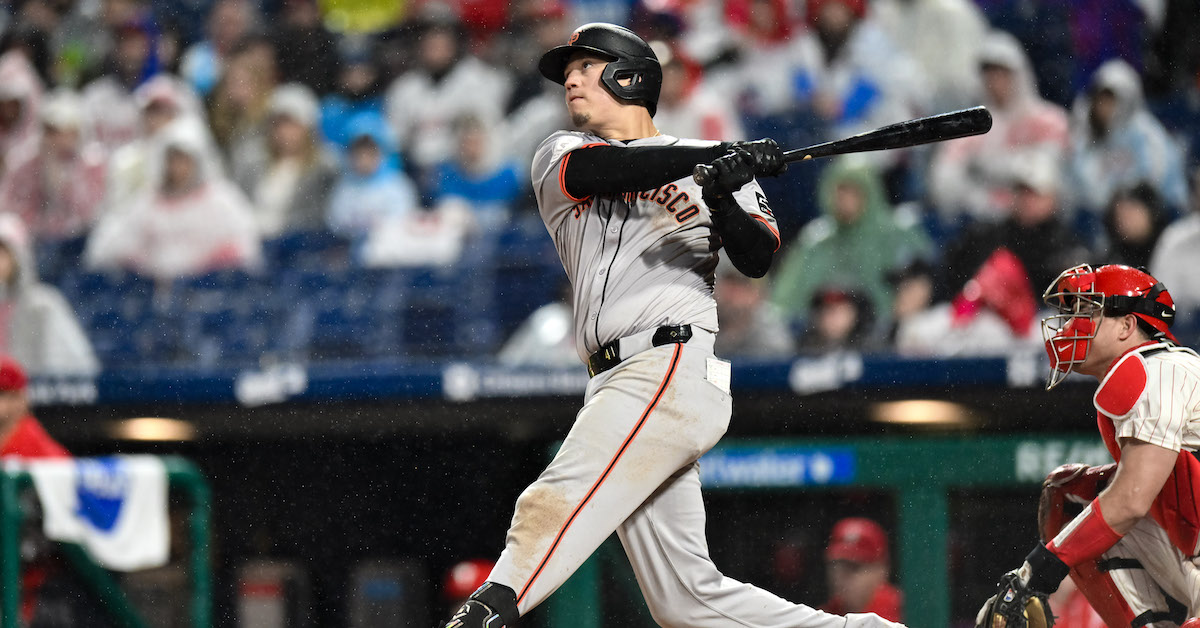
On Monday night, I had the privilege of attending a game in which the Reds’ best left-handed starter, Andrew Abbott, faced the Phillies’ best left-handed hitter, Bryce Harper, three times. Abbott got the better of Harper, who went 0-for-3 with a strikeout against the Cincinnati starter and 0-for-5 overall. But the qualities of each player got me thinking.
When Harper swings the bat, one of two things happens. In scenario no. 1, he squares it up and hits it so hard it causes bruising on the deceased ancestors of the workers who stitched the ball together at the Rawlings factory. Sure enough, Harper tagged Abbott’s teammates for three home runs just 24 hours later.
Otherwise, Harper misses it. He can miss it by a lot, in which case he just swings through it, or he misses it by a little. Those swings manifest themselves either in balls fouled straight back to the screen, or in fly balls that go straight up in the air and stay there long enough for the outfielder to take out his phone, and queue up Meat Loaf’s “Bat Out of Hell,” so the ball lands right at the climax of the second chorus. You know the part: “Like a sinner / before / the gates of Heaven / I’ll come crawling on back to you.” The loud one, like five and a half minutes into the song. Read the rest of this entry »
On Monday, I dove into Kevin Gausman’s fast and furious two-strike fastball approach. Last season, Gausman led the majors in terms of the velocity gap between his normal fastballs and his two-strike offerings, and he prospered with that approach. In 2022, however, he had the same juicy gain in velocity and was one of the worst pitchers in baseball with two strikes.
In that article, I mused that it was really difficult to know what pitchers were doing differently with two strikes. Short of using a stuff model, I said, trying to figure out relative pitch quality between two-strike fastballs and their early-count brethren wouldn’t work. Then I had an epiphany. We have a stuff model. We have two, in fact, one of which is entirely in-house. So like a kid asking for the keys to the candy store, I went to David Appelman and asked if I could get pitch-by-pitch stuff grades.
Now I have those! It turns out that running a giant data-focused baseball website comes with access to a tremendous amount of baseball data. I pulled every four-seam fastball thrown in 2023 and broke them into two categories for every player: two-strike counts and all other counts. Read the rest of this entry »