I’ll lead with this: I’m not certain the Launch Angle RevolutionTM was ever really a thing — or at least, it wasn’t a thing in the way we thought it was. In 2019, we were faced with an onslaught of home runs that needed an explanation, a genesis. It made sense to turn to launch angles: all else equal, if you hit balls higher, they tend to travel farther. As we’d later learn, juiced balls were much more a culprit than anything else. I wish I could find the sound byte for it – my squishy memory may have manufactured it – but I swear I recall Christian Yelich, perhaps the juiced ball’s most prominent (though, to be clear, not necessarily its biggest) beneficiary, scoffing at the concept of a “launch angle swing.” (Edit: It’s here! Thanks, Mike Petriello!) Although Yelich’s fly ball rate jumped 13.4 percentage points in 2019, he (arguably rightly) denounced the very idea of what everyone assumed had fueled his success.
There is, however, unquestionably another revolution afoot: the Pulled Fly Ball RevolutionTM. Inherently, it’s its own kind of launch angle revolution. But it’s also a spray angle revolution, and a pitch selection revolution, and a swing decision revolution. It is multifaceted and sprawling, and it is much more clearly defined than its predecessor. Here’s the percentage of batted ball events (BBE) that were pulled fly balls (PFBs, for short) by year:
I don’t think I’m alone in my fascination with pulled fly balls. In fact, I know I’m not, because Alex Chamberlain wrote about them today too. These days, we’re practically drowning in data: exit velocities, launch angles, chase rates, aggression rates — the list goes on and on. There are so many different ways of thinking about exit velocity that you can read an entire great article about what they all mean. If you want to translate how hard someone hits the ball into how they’re likely to perform, there’s no shortage of instructivearticles. But in that deluge of data, horizontal angle has been left out, for reasons both purposeful and accidental, and the unavailable is always interesting.
Earlier this month, I did some idle digging into what pull rate means for production on contact. The takeaway was, to be generous, middling. It seems like pulling your aerial contact results in better overall production on that contact, but the effect isn’t huge. Perhaps the more interesting takeaway was that xwOBA on these batted balls had a bias: the more pull-happy the hitter, the lower their xwOBA was on the balls they hit in the air. That was the case despite greater overall production on those balls.
That’s a weird little artifact, though I didn’t think too much of it because I kind of knew what it would say in advance. Every time I look at a dead pull fly ball hitter, they’re getting home runs out of batted balls that xwOBA hates. But that doesn’t mean the statistic is working incorrectly; it’s doing exactly what it says on the label by bucketing batted balls based on exit velocity and launch angle. Read the rest of this entry »
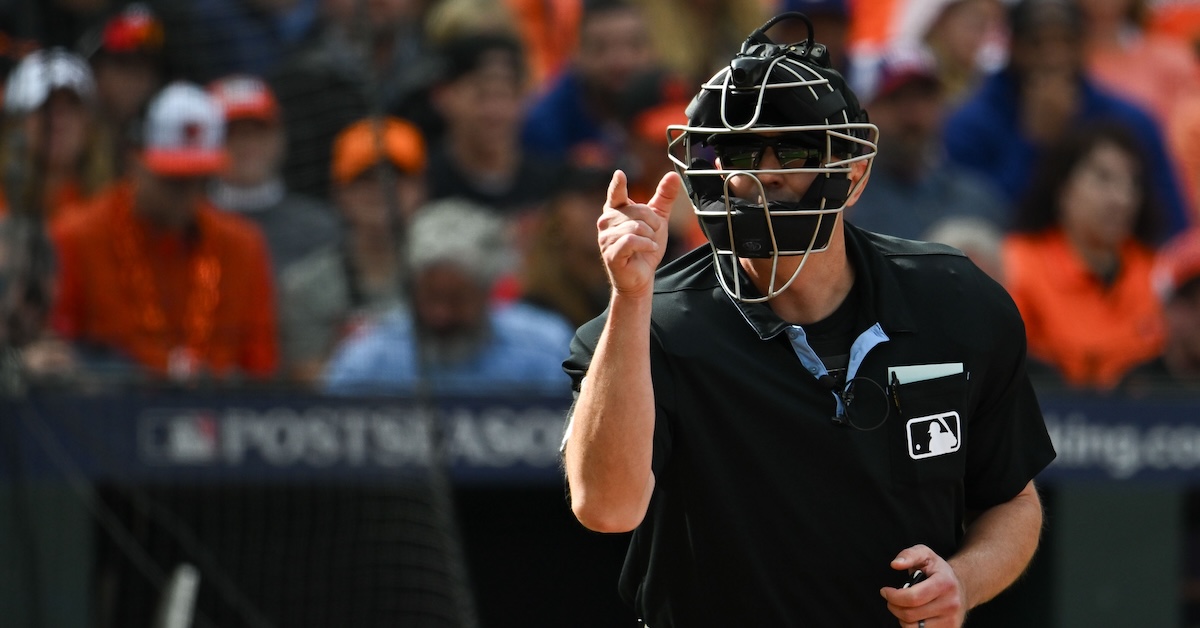
For a while now, I’ve been having fun analyzing how accurate umpires are when calling balls and strikes according to the Statcast strike zone. Honestly, I might be having toomuchfun. It’s just that there are so many variables that might affect the way the umpire sees a pitch. Today we’re looking into the most literal one: the ballpark. Every stadium is different, and that can affect how easy it is to track the baseball. This is a well-established issue, which is why every ballpark has a batter’s eye, a dark background that’s supposed to ensure that the batter is able to see the ball out of the pitcher’s hand. Those backdrops vary quite a bit, from evergreen trees and ivy in Colorado, to a painted wall in Texas, to tinted glass in the Bronx.
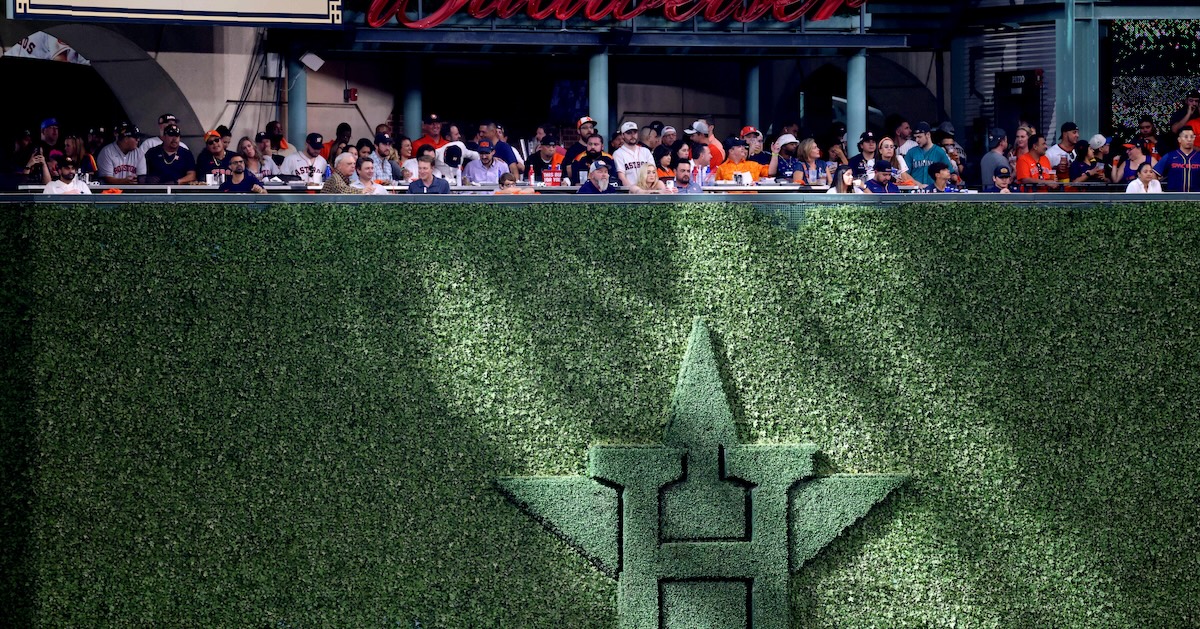
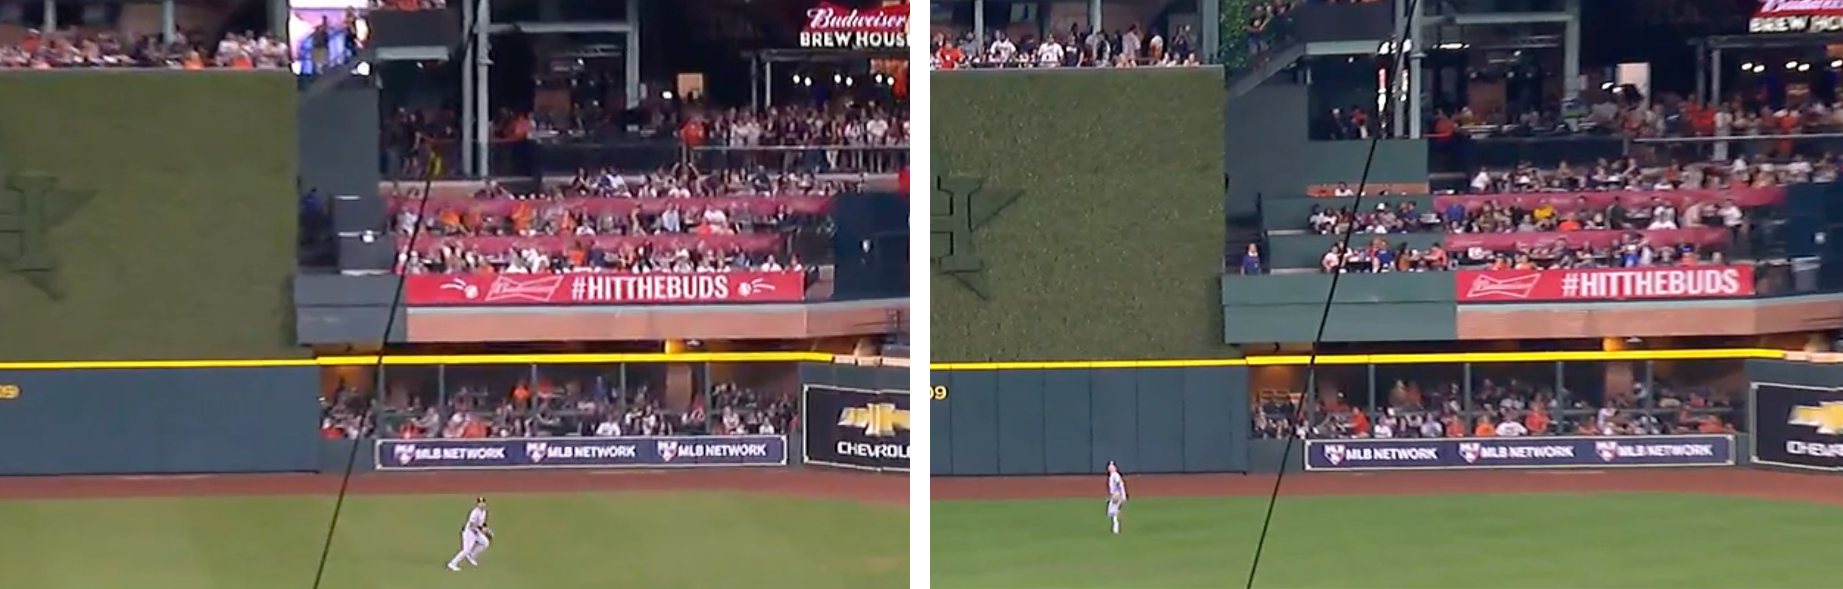
When Drew Smylynearly threw a perfect game last April, it helped that it was a day game at Wrigley Field, and his left-handed release point was so wide that the ball appeared to be coming not from the batters eye, but from the bleachers in right-center. Last September, in response to multiple public complaints from players, the Astros effectively extended Minute Maid Park’s batter’s eye several feet farther into right field, awkwardly repainting part of a formerly red section of brick and signage green. “It’s like night and day,” one player told The Athletic after the paint job:
Nathan Ray Seebeck-USA TODAY Sports
As I write this, I’m in a fair amount of discomfort. I went to the dentist’s office for a routine filling and next thing you know, bam, root canal. I’m a little out of it, is the point, and in my dental chair daze, I did what everyone probably does when they’re upside down with blood rushing to their head for a long time: I started musing about Isaac Paredes.
Oh, I hear you. This isn’t what normal people do when they’re discombobulated, not even a little bit. To that I say, you’re not wrong. Also, though, I’m not a normal person. This is my job, and daydreaming about work is inevitable, not weird. In any case, I came up with an incredible idea, a way to work out the next Paredes before teams did. I was a genius. Here’s the bad news, though: I don’t really remember it now that I’m lucid again.
That’s a bummer, but it’s OK, because in trying to reconstruct my thoughts, I think I came up with a pretty cool way of contextualizing how much it pays to sell out for pulled contact. As an added bonus, I got to pore over a ton of data and play with it to my heart’s content. That’s the dream, coming up with some silly junk stat in a haze and then spending hours manipulating data to show that it’s worthwhile. Read the rest of this entry »
About a year ago, I wrote about how umpires have improved at calling balls and strikes throughout the pitch tracking era. They have gotten a whole lot better, especially at identifying strikes. While everyone appreciates a more consistent and accurate zone, that has made things a bit harder for hitters overall. More importantly, their progress didn’t seem like it was showing any signs of slowing down. With the 2023 season in the books, it’s time to check in on whether that’s still the case. The methodology here is simple: check to see if Statcast agrees with the umpire’s decision for each called ball and strike. This isn’t a perfect method, as a pitch right over the heart of the plate is a much easier call than one right on the edge, but the enormous sample sizes (there were 376,635 takes in 2023) mean that things even out over time.
The other day, my friend asked me a simple baseball question with no easy answer: What does a four-seam fastball look like? Not what is a four-seam fastball, or what does a four-seam fastball accomplish, or any number of fastball-related questions with more straightforward answers. He wanted me to conjure up an image of the most common pitch in baseball. I didn’t quite know what to tell him; strangely enough, the more ordinary something is, the harder it can be to describe.
My friend is merely a rhetorical device, but I’ve already grown attached to him, so let’s call him Tony. Tony is a casual observer of baseball. He hears terms like “fastball” and “curveball” and “the Dodgers are ruining the game” every now and then, but he doesn’t have the requisite context to understand what any of it really means. How do I show Tony what a four-seam fastball looks like in 2023? After all, every pitcher works differently. The velocity gap between Jhoan Duran’s and Rich Hill’s four-seam fastballs is the difference between a speeding ticket and losing your license. Explaining to Tony that those two offerings are technically the same pitch would be like trying to convince an alien that a Bergamasco Shepherd and a Xoloitzcuintli are the same species. It’s factually correct, yet without hyper-specific evidence – and the background knowledge necessary to interpret that evidence – it’s all but impossible to believe.
Yet Tony didn’t ask about results, be they average or exceptional. He wants a visual point of reference, and simply put, neither of those two throws a visually conventional heater. Reaching triple-digits on the radar gun remains a rarity, and Bautista does it more often than most. Meanwhile, Heaney throws his fastball with over 15 inches of arm-side run; that’s 70% more horizontal movement than the average four-seamer of a similar speed and release point. On the graph below, Heaney sits way over on the right, and only two dots (min. 500 pitches) can be found farther in that direction:
via Baseball Savant
What Tony really wants to see is the prototypical four-seam fastball, the pitch that most closely resembles the norm in as many material ways as possible. Identifying the man who throws such a pitch won’t serve a practical purpose; it won’t help teams win ballgames, fans win their roto league, or Harold Ramírez lay off all those four-seamers outside the zone. Still, it’s nice to have a baseline for the most important pitch in baseball – or any pitch for that matter. Thus, I set out to find the pitchers who throw the pitches that best exemplify what each pitch looks like in the game today.
A project like this requires a good deal of subjective decision making. No one throws a pitch perfectly identical to league average in every measurable way. Heck, even if someone did, who’s to say that average is the same as normal. The league average four-seam fastball last year clocked in at 94.2 mph, but the average reliever threw nearly a full mile per hour faster than the average starter. With that in mind, would it be incorrect to say that a starter who boasts a 94.2 mph heater is throwing with typical velocity? On top of that, pitchers who throw harder fastballs tend to throw better fastballs, which means they get to throw more fastballs. Therefore, they influence the league average to a greater extent than their less prolific peers. The average velocity of the 43 starters who threw at least 1,000 four-seam fastballs last season was 1.2 mph faster than the average velocity of the 216 starters who threw between 50 and 999 of the same pitch. Should those fewer, faster pitchers have such an outsized influence on the overall numbers? With all that said, I’m sticking with league average as my baseline (for lack of a perfect alternative, if nothing else), and I hope you’ll stick with me as I explain the rest of my decisions.
Next, I had to figure out how to narrow down the list of possible candidates. Seven-hundred and thirty-one players threw a four-seam fastball in the major leagues last year, and I wasn’t going to get anywhere if I gave each of them a close look. (Sorry Tony, even I have my limits.) Thus, I set 100 four-seam fastballs as my arbitrary minimum requirement, and I chose to prioritize one attribute above all else: velocity. It’s called a fastball, after all.
Seven pitchers (min. 100 pitches) averaged exactly 94.2 mph on their four-seam fastball. Another 18 sat at 94.1 or 94.3 mph, and I included those arms in my search to allow for candidates who might be a rounding error away from league average. That gave me 25 pitchers to work with, 19 right-handers and 6 southpaws. I hemmed and hawed over whether to include lefties at all, and ultimately I put off making a decision in hopes I wouldn’t have to. Thankfully, that proved to be the case, as none of the top candidates were left-handed.
Armed with 25 contenders and a Google spreadsheet, I hopped on Baseball Savant, looking for as many physical pitch characteristics as I could find and manipulate. I settled on nine: vertical release point, horizontal release point, extension, perceived velocity, vertical movement, horizontal movement, spin rate, total movement, and active spin. After calculating the standard deviation of each metric, I returned to my 25 candidates. Did anyone fall within one standard deviation of league average in every category?
Well Tony, today is your lucky day. One pitcher, and only one pitcher, fit the bill. One pitcher was within a single standard deviation of league average in all nine of the aforementioned metrics. That same pitcher came within half a standard deviation in seven categories, within a quarter of a standard deviation in five categories, and within an eighth of a standard deviation in four. No one else came closer at any step along the way. The owner of the most ordinary four-seam fastball in baseball is José Berríos.
Wow… Let’s take a minute to marvel at the regularity. Here’s how Berríos threw his four-seamer in 2023:
José Berríos Four-Seam Fastball
mph
V Release
H Release
Ext.
Pcvd. Velo
V Mvt.
H Mvt.
Spin
Total Mvt.
Active Spin
94.3
5.68
-2.30
6.5
94.5
0.1
1.3
2227
17.8
92%
SOURCE: Baseball Savant
And here is how he stacks up to Alec Marsh, the next closest competitor and, as I discovered, a player for the Royals, not the title of a Phillies day carefan fiction. I’ve also included league average numbers in the table for additional context:
Berríos and Marsh Four-Seamers
Pitcher
mph
V Release
H Release
Ext.
Pcvd. Velo
V Mvt.
H Mvt.
Spin
Total Mvt.
Active Spin
Berríos
94.3
5.68
-2.30
6.5
94.5
0.1
1.3
2227
17.8
92%
Marsh
94.2
5.67
-2.33
6.4
94.5
-0.3
1.2
2461
17.3
85%
Average
94.2
5.83
-1.82*
6.5
94.4
0.0
0.0
2283
17.4**
90%**
SOURCE: Baseball Savant
*Horizontal release point average for RHP **Average is a close approximation using available data
I considered making a case for Marsh on the basis of speed alone. At the beginning of my search, I said I would prioritize velocity, and his 94.2 mph average was right on the money. However, Berríos’s 94.3 mph average velocity was actually rounded up from 94.25 mph. In other words, if he had thrown just one additional fastball at 92.3 mph or slower (he threw 27 such pitches last year), his season average would have fallen to 94.2. It’s simply too close to take the title away from him.
Interestingly, Berríos’s four-seam fastball wasn’t quite so ordinary until this past season. For most of his career, he threw the pitch with less rise and more run than the typical four-seamer. However, in 2023, his four-seamer had more vertical movement and less horizontal movement than it had since his breakout campaign in 2018:
Data via Baseball Savant
My quest for the platonic ideal of a four-seam fastball was so fruitful that I decided to perform a similar search for sinkers and cutters. I still prioritized velocity, but for this investigation, I also took movement into account to narrow down the contenders. Call me a literalist, but I say the typical sinker needs to sink, and the typical cutter needs to cut.
Starting with sinkers, I picked out the 12 pitchers who came within one-quarter of a standard deviation of league average in velocity and within half a standard deviation in both vertical and horizontal movement. Next, I compared them all to league average in each of the additional categories I previously identified. Unfortunately, there wasn’t quite as clear of a winner this time around.
Only one pitcher, Colin Rea, finished within one standard deviation of league average in every metric (including mph). However, eight others finished within one standard deviation in nine out of 10. When I narrowed the criteria to half a standard deviation, Rea remained in the lead, meeting the criteria in nine of the 10 metrics, but he was tied with three other pitchers: Mitch Keller, Miles Mikolas, and Bryse Wilson. Meanwhile, at a quarter of a standard deviation, Rea reclaimed sole position of first place (eight out of 10), but three more arms were right on his tail with seven: Mikolas, Pedro Avila, and Brandon Pfaadt. What’s more, one of the metrics in which Rea wasn’t particularly close to league average was vertical movement, and that seems pretty important for a sinker. Among the quartet of Rea, Mikolas, Avila, and Pfaadt, only Avila came within a quarter of a standard deviation of league average in vertical movement. Finally, when I went down to an eighth of a standard deviation away from league average, Rea lost his crown to Avila, who came that close to league average in six different metrics. Rea and Noah Davis finished right behind him with five each.
The names that came up most often in the previous paragraph were Rea, Avila, and Mikolas. However, only one of those three threw his sinker with precisely league-average velocity. Indeed, only one of those three came within half a mile per hour of average. What’s more, that same pitcher was the only candidate out of 12 who came within an eighth of a standard deviation of league average in both vertical and horizontal movement, and one of only two who came within a quarter: Pedro Avila.
Avila, Rea, and Mikolas Sinkers
Pitcher
mph
V Release
H Release
Ext.
Pcvd. Velo
V Mvt.
H Mvt.
Spin
Total Mvt.
Active Spin
Avila
93.3
5.56
-1.24
6.4
93.4
-0.3
-0.2
2281
17.5
76%
Rea
92.6
5.58
-2.1
6.7
93.2
-1.2
-0.1
2136
17.9
84%
Mikolas
92.7
6.49
-2.1
6.4
92.8
-0.8
-0.2
2193
18.1
84%
Average
93.3
5.64
-1.93*
6.4
93.3
0.0
0.0
2150
17.8**
85.7%**
SOURCE: Baseball Savant
*Horizontal release point average for RHP **Average is a close approximation using available data
Likewise with the cutter, there were no exact matches. I picked out the 14 contenders who came within half a standard deviation of league average in velocity and both planes of movement, but none of those 14 came within one standard deviation of league average in every other metric. Nonetheless, there was still a clear winner. Only one pitcher came within half a standard deviation of average in nine categories, within a quarter in six categories, and within an eighth in five. He was one of only four pitchers within half a standard deviation of league average in both vertical and horizontal movement and within a rounding error of league average in velocity. And out of those four, he was easily the closest to league average in release point and extension. It’s Javier Assad.
Javier Assad’s Cutter
Pitcher
mph
V Release
H Release
Ext.
Pcvd. Velo
V Mvt.
H Mvt.
Spin
Total Mvt.
Active Spin
Assad
89.1
5.94
-1.81
6.4
89.7
0.8
0.6
2046
8.2
57%
Average
89.2
5.84
-1.82*
6.4
89.5
0.0
0.0
2388
8.2**
47.1%**
SOURCE: Baseball Savant
*Horizontal release point average for RHP **Average is a close approximation using available data
Here at FanGraphs, we pay a ton of attention to average performance. The concept of “league average” informs some of our most foundational stats. We even have a tab on the leaderboards page (+ Stats) dedicated to precisely that. It’s not hard to see why; a good sense of average performance, whether for a team, a player, or an individual skill, has all sorts of practical applications. Sometimes, however, it’s just as interesting to take a step back from results and focus on the process instead. We talk a whole lot about four-seamers, sinkers, and cutters, and it’s helpful to visualize those concepts as best we can. In 2023, it was Berríos, Avila, and Assad who made that possible.
So, there you have it, Tony. It’s been fun! Let’s grab a coffee sometime soon.
Earlier this week, I wrote aboutEmmanuel Clase. Specifically, I wondered whether a lower release point, or whatever caused that lower release point, was the reason his performance took a step back in 2023. I don’t know the answer for sure. I don’t even think there is a way to know the answer for sure, but I’ve spent the last few days thinking about release points. Clase’s has fallen roughly two inches over the last two years. That feels like a lot to me, but I realize that I don’t have a basis for that feeling. What happens to a pitcher’s release point on a year-over-year basis? Does it stay the same? What constitutes a normal amount of variance? Does it only fall off once things are starting to go wrong? Does it slowly degrade over time just like the pitcher himself, who is after all merely an ephemeral vessel of bone and sinew, destined to return unto the dust?
Naturally, there’s only one place to find answers for metaphysical questions like these: Baseball Savant. I pulled the average vertical release point for every pitcher in the Statcast era, calculating the year-over-year change for their primary fastball. For pitchers who threw both a four-seamer and a sinker, I ignored whichever pitch they threw less often. I also threw out seasons in which players changed their release point by more than four inches, which to me indicates an intentional change to a pitcher’s delivery and overall approach to pitching. We’re interested in cases like Clase’s, where his release point changed unintentionally as he tried to pitch in the same way.
That left me with a goodly sample of 5,353 player seasons. In addition to calculating the change in vertical release point, I also noted the change in fastball velocity, along with the changes in the pitcher’s overall FIP-, whiff rate, and groundball rate (adjusted to league average). The first thing I did was create an aging curve, but before I show it to you, I’d like to tell you what I was expecting to see. Read the rest of this entry »
The 2023 season seemed to be studded with stars. Two-way phenom Shohei Ohtani turned in by far his best offensive season (not to mention a very good pitching season before succumbing to injury) en route to a unanimous MVP selection. Ronald Acuña Jr. made counting stat history with the first ever 40–70 season, posting a .428 wOBA that was somehow 35 points shy of his .463 xwOBA and earning his own unanimous recognition from MVP voters. This despite playing in the same league as Mookie Betts, who had what would have been a career-best season for almost anyone else, slashing .307/.408/.579 with a career-high 39 home runs. Freddie Freeman had the best season of one of the best active careers in baseball, somehow improving on a 2022 campaign that featured a .325/.407/.511 slash line and 7.1 WAR. And I could go on — Matt Olson hit 54 home runs, Marcus Semien and Corey Seager anchored a championship lineup, Francisco Lindor quietly put up another 6.0-WAR season, and Corbin Carroll wasted no time in establishing himself as a bona fide superstar. Read the rest of this entry »
Pitchers mostly don’t throw sweepers to opposite-handed batters. Starters especially don’t throw sweepers to opposite-handed batters. To put a number on it, 227 starters threw 250 or more pitches to opposite-handed hitters in 2023. Only 18 of that group chose sweepers even 10% of the time. Everyone knows the math: It’s the kind of pitch that simply doesn’t work when opponents get a clean look at it.
Want further proof? When pitchers have deigned to throw this suboptimal pitch, they’ve gotten punished for it. Per Baseball Savant, starters threw 4,734 oppo sweepers and accumulated 43.6 runs of negative value relative to average for their troubles. In other words, it’s generally a poor option. It’s not quite “break glass in case of emergency,” but it’s not far off. Starters rely on changeups, splitters, vertical breaking balls, or cutters to get by; anything to avoid throwing sweepers.
Okay, now that I gave you that setup, here’s the deal: It’s not universally true. Two Cy Young contenders and a top prospect have bucked the trend, throwing sweepers with relative abandon and getting away with it. What gives? Let’s look at each in turn. Read the rest of this entry »
Last year, I took a long look at the predictive power of rookie exit velocity. One of the things I learned was that for rookies with at least 200 balls in play, wRC+ was less predictive of their future performance than max exit velocity. That blew my mind. Knowing just one measurement, the velocity of a player’s hardest-hit ball, was more useful than knowing about their overall performance through their entire rookie season. Exit velocity matters a lot, as does how you interpret the data.
Since the rollout of Statcast in 2015, we’ve been introduced to three general ways of thinking about exit velocity, along with half a dozen individual variations. Depending on the context, we might read about a player’s average exit velocity, their maximum exit velocity, their hard-hit rate, or any number of exit velocity percentiles. For a while now, I’ve been wondering which one of these methods is most useful. Could there be one exit velocity metric to rule them all?
I have to imagine that at some point in the last several years, the R&D department of each major league team has asked itself that exact same question. In each big league city, someone much smarter than I am did the math and wrote up the results in a report that now rests comfortably in a proprietary database with a catchy name. The rest of us just have to make do with rumors and innuendo suggesting that teams most often value something akin to 90th-percentile exit velocity. To my knowledge, no one in the public sphere has made a comprehensive survey, and I wanted to look into the matter for myself. Read the rest of this entry »