Who’s the best reliever in baseball? There are multiple ways to go about answering that question. You could pick the guy with the lowest projected ERA; that’s Josh Hader, with Emmanuel Clase, Liam Hendriks, and Taylor Rogers close behind. You could pick the guy with the best reputation; I’d go with Hendriks or Hader, but if you’re a giant Raisel Iglesias or Aroldis Chapman fan, I wouldn’t hold it against you.
If you want to look at what’s happening on the field, though, the best reliever in baseball is clearly Ryan Helsley. It’s not “probably Ryan Helsley.” It’s not “Ryan Helsley is in the conversation.” It’s just Ryan Helsley. He’s been absolutely dominant to start the year, so dominant that I’m not sure I have the right words for it.
If you follow the NL Central, you’ve surely heard of Helsley. He’s been in the majors for parts of the last four seasons as a flamethrowing reliever, and that part isn’t changing. He topped out at 103 mph this weekend, the kind of heat that makes Pitching Ninja sprint to his computer and search for the right emoji (he used fire, if you’re keeping score at home). But that pitch reduces Helsley’s performance to “he throws hard sometimes,” which undersells him to a comical extent. Read the rest of this entry »
This season, Eric and Tess Taruskin will each have a minor league roundup post that runs during the week, with the earlier post recapping some of the weekend’s action. You can read previous installments of our prospect notes here.
Calvin Ziegler, RHP, New York Mets Level & Affiliate: Low-A St. Lucie Age: 19 Org Rank:TBDFV: 40
Weekend Line: 4.1 IP, 1 H, 0 R, 0 BB, 9 K
Notes
Ziegler was generating enough buzz during minor league spring training that a scout in Arizona mentioned his name to me totally unprompted, as a heads up that he might be breaking out. A Canadian high schooler in the Toronto area, Ziegler was in a bind ahead of the 2021 draft because travel restrictions were going to make it hard for him to be seen by scouts. He transferred to TNXL Academy, an athletics “school” in Florida, for his pre-draft spring. The Mets made him their second round pick and signed him for just over $900,000, then shut him down during the regular season.
He’s come out hot to start 2022, at least from a bat-missing standpoint, with last Friday’s outing his most efficient from a strike-throwing standpoint. Ziegler’s stuff isn’t appreciably different than when he was in high school, though he is mixing in his secondary stuff more heavily. He used his fastball over 75% of the time on the summer showcase circuit, but his usage has been closer to 50% so far this year. Both Ziegler’s trademark breaking ball and his mid-80s changeup show bat-missing potential, though the former has much more consistent finish. While Ziegler doesn’t have the prototypical pitching prospect’s frame at a fairly mature six feet tall, his delivery is very athletic, with the power and balance he shows in his lower half and the flexibility of his upper back generating optimism that he might yet throw harder than his current 91-96 mph range. Ziegler’s “lack” of height and the way he gets deep into his legs during his delivery give his fastball a tough-to-hit line. Changeup and overall command refinement are all that stand between Ziegler and pretty comfortable projection into a rotation. Read the rest of this entry »
As you may already know, I’m something of an intentional walk connoisseur here at FanGraphs. When questionable ones occur, particularly in the playoffs, I like to delve into the specifics to figure out which ones are good decisions, which ones are close calls, and which ones are just plain silly.
Earlier this week, I wrote about Joe Maddon’s bases-loaded intentional walk, which was about as far on the silly end of the spectrum as you can get. Today, I’m going to cover the other notable intentional walk of the week: the Yankees giving Miguel Cabrera a free pass on Thursday. Then, as a bonus, I want to talk about Cardinals manager Oli Marmol and a clever thing he did that might escape notice if you aren’t watching closely. Read the rest of this entry »
Notes
Kirby’s fastball sat 96-98 mph on Wednesday night, but more noteworthy was how little he threw it. He leaned much more heavily on his slider, curveball, and changeup, all of which flashed above average throughout the evening.
His increased use of those secondaries resulted in him throwing more balls than is typical of the control-specialist, but while that may have inflated his pitch count, he still kept it in check, and didn’t issue any free passes. More often than not, Kirby hit his spots and he missed bats with every offering, retiring the last 12 batters he faced in order. Read the rest of this entry »
So many relievers have found new homes recently that we’ve written not one, but two reliever roundups! You can find the first one from Luke Hooper here. This is part two, containing four additional relief arms who bring interesting backgrounds, stuff, and deception to the table. Without further ado, let’s get a closer look.
Brewers Sign Brad Boxberger
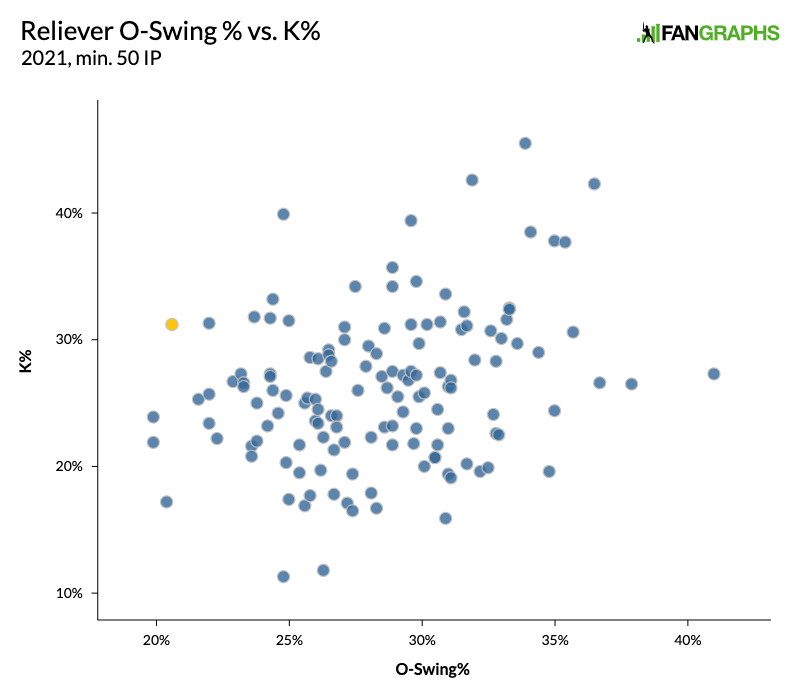
If you like weird, enigmatic relievers, then Brad Boxberger is the guy for you. He’s reuniting with the Brewers on a one-year, $2.5 million contract and looks to continue his success from last season. Let’s get into what makes Boxberger tick. Here’s a plot containing every reliever in 2021 who threw at least 50 innings. On the x-axis is chase rate, or how often batters swung against a reliever’s out-of-zone pitches. On the y-axis is overall strikeout rate:
That’s right. Boxberger, the point in yellow, generated an above-average strikeout rate for a reliever (31.2%) while having the fourth-lowest chase rate (20.6%). Not that more chases automatically equals more strikeouts, but this is still pleasantly odd. Boxberger doesn’t need to fish outside the zone to rack up strikeouts – he meets hitters in the middle, and more often than not, he emerges victorious. Read the rest of this entry »
The first post-lockout signing is now in the books, with the St. Louis Cardinals agreeing to a two-year deal with 6-foot-6 righty Drew VerHagen, a former Detroit Tiger who had spent the last two seasons in Japan with the Hokkaido Nippon-Ham Fighters.
The deal is worth $2.5 million in the first year and $3 million in the second, with up to $1 million in performance bonuses in each season. VerHagen, 31, threw about 100 innings in each of his two seasons in Japan, and gives St. Louis another arm capable of making spot starts or providing length out of the bullpen, something the Cardinals needs since much of their 40-man roster is occupied by single-inning relievers and starting prospects with sketchy command, like Angel Rondón and Johan Oviedo. Read the rest of this entry »
With no clear end in sight to the owner’s lockout, free agent Kwang Hyun Kim 김광현 has decided to return to Korea for the 2022 season. On Monday, Jeeho Yoo of Yonhap Newsreported that Kim has signed a four-year deal with the SSG Landers (previously the SK Wyverns). The deal is worth 15.1 billion won ($12.3 million dollars) and breaks the record for largest KBO contract that was previously held by Dae-Ho Lee 이대호 and Sung-bum Na 나성범. In a statement released by the Landers, Kim said, “I was able to challenge myself in the majors because of support from fans here. I decided I wanted to give back to them once I returned to the KBO. The Landers recognized my value with the biggest contract ever in the KBO — I didn’t have to think long and hard about the reunion.”
Kim returns to his old team in Incheon, a squad that has missed the playoffs both years since he made the jump to the major leagues after the 2019 season: They placed ninth in the 10 team league in 2020 but came up half a game short of qualifying for the Wild Card game in 2021. Kim solidifies a starting rotation that also includes former major league pitchers Iván Nova and Wilmer Font. Font led the Landers pitching staff with a 3.46 ERA and a 3.25 FIP, but the four pitchers in the rotation behind him all had ERAs and FIPs over five. With Kim back in the fold, the Landers are likely one of the preseason favorites heading into the regular season.
I asked former FanGraphs contributor Sung Min Kim for some additional context on Kwang Hyun Kim’s return to the KBO.
“Landers are now in a very good position, especially with their pitching staff. Not only do they get one of the better KBO pitchers back in their rotation, but they also bet highly on Wilmer Font, who pitched very well with them in ’21, and Iván Nova, and they also have two solid Korean-born starters in Jong Hoon Park and Seung Won Moon set to return mid-season from injuries. Those five pitchers would make up the best rotation in all of KBO, and make them instant pennant favorites for 2022. They will certainly be a very fun team to watch.”
Kim’s time in America was anything but easy. A club legend while playing for the Wyverns from 2007-19, he made the transition to the US prior to the 2020 season. Unfortunately, his introduction to the major leagues was interrupted by a global pandemic. The next season was a little more normal, but his two-year deal with the Cardinals expired at the end of 2021 and the 33-year-old again found himself in strange circumstances, with the owner’s lockout disrupting his foray into MLB free agency.
While pitching for St. Louis, Kim’s role was as settled as the circumstances around him these past two years. He began the 2020 season as the Cardinals closer, notching his first professional save in his first major league appearance. A COVID outbreak on the team forced him into the starting rotation soon after, and he made seven starts during the remainder of the abbreviated regular season with an additional start in the Cardinals Wild Card series against the Padres. He allowed just nine total runs to score against him in those eight regular season appearances, good for a 1.62 ERA.
Last year, two separate stints on the injured list limited Kim to 21 starts and six relief appearances. The second of those trips to the IL came in mid-August after the Cardinals had acquired J.A. Happ and Jon Lester to bolster their rotation for the stretch run. Kim returned after two weeks on the sidelines but had lost his spot in the rotation by then. He made two more starts through the end of the season but was mostly relegated to mop up duty in the bullpen over the last month of the season.
All told, he made 28 starts during his time with the Cardinals and seven additional relief appearances. He compiled 1.8 WAR with an excellent 2.97 ERA that outpaced a more middling 4.34 FIP. He never racked up big strikeout totals, instead relying on good command and a solid ability to limit hard contact. Just 25.6% of the plate appearances against him ended with a hard hit batted ball, right in line with the league average over the last two seasons. He allowed a 6.3% barrel rate during his time in the majors and just a .348 expected wOBA on contact.
On the pitcher’s decision to return to Korea, Sung Min Kim had this to say:
“I think he was always inclined to stay in the US and try to prolong his career in the US by signing with another team. He’s had a desire to challenge himself in the majors for a long while, even before he signed with the Cardinals. With his age and the decreased velocity he showed during his two seasons in St. Louis, I wasn’t sure what the market looked like for him, especially given that he was relegated to a bullpen role later in 2021. I think, with the lockout taking awhile, him missing his family being back in Korea, and definitely having a clearer role guaranteed back in KBO, it was very hard to say no to a lucrative deal to come back.”
Kim’s departure from the US creates an even bigger hole in the depleted free agent starting pitching market. Twelve of the 18 starters listed on our top 50 free agents list signed new deals prior to the lockout. That leaves very few options for teams looking to bolster their rotations once the offseason resumes. Kim was ranked 35th on that list of top free agents, ahead of Zack Greinke, Michael Pineda, and Yusei Kikuchi. Though he probably wasn’t likely to land a significant payday from an MLB club, he could have been a solid back-of-the-rotation option for a contending team that needs a bit more depth in their rotation. Those teams that might have been interested in Kim’s services are now limited to looking at starters like Pineda, Kikuchi, Tyler Anderson, and Garrett Richards.
This may also be the first instance of the ongoing owner’s lockout influencing a player to leave the US to find other opportunities abroad. Obviously, Kim returning to his home country to play for the same team he starred for previously is a unique circumstance, but the fact that there was no clear end to his free agent limbo in America had to have entered into his decision-making process when opting to return to Korea. Kim chose to leave behind the uncertainty of MLB for a record-setting KBO deal.
If negotiations between MLB and the Players Association continue to drag on, jeopardizing more and more of the regular season, it wouldn’t be surprising to see players consider signing with international leagues to give them some guarantee of earnings and playing time. Bryce Harper already joked about playing in Japan and Taiwan on his Instagram account:
It’s not hard to imagine a situation where MLB players start to seriously consider their options abroad if progress towards a new CBA deal hasn’t been made. Opening day in Korea is set for April 2, while the Nippon Professional Baseball season begins on March 25. That gives players an increasingly narrow window to make a decision. Established stars like Harper probably won’t be making the jump to Asia this year, but for players still mired in free agency or on the fringe of a major league roster and ineligible to play in minor leagues, a guaranteed paycheck and playing time in a foreign league could become increasingly enticing.
Tuesday marks the 83rd day of the owner-initiated lockout. It still remains to be seen how long it will last, but whatever its length, we’re likely to see a whirlwind of a mini-offseason as soon as the league and the players come to terms on a new collective bargaining agreement. While that kind of thing is fun to cover — the week before the lockout was a thrilling frenzy — there’s still quite a lot for baseball to do. So let’s roll up our sleeves, lend a hand, and find some new homes for a few of the remaining free agents. The trick here is that they actually have to make at least a lick of sense for the team signing them — but just a lick.
We gave out a half-billion of fictional dollars to hitters last time, but our imaginations could use some pitching too, so let’s get cracking! Read the rest of this entry »
Summary of Responsibilities:
The role of the Data Engineer will be to design, develop, and maintain modern, scalable baseball data processing systems for the St. Louis Cardinals. This person will collaborate with the Baseball Systems group to ensure that quality data, analytics, and visualizations are accessible in a timely fashion to front office members, scouts, coaches, players, and others in Baseball Operations. This person should be detail-oriented, enjoy collaborating with others, communicate effectively both verbally and in writing, keep up with the latest tools and technologies, and have strong interest in the game of baseball.
The St. Louis Cardinals are committed to building an inclusive organization where we have a diverse workforce as well as a culture where employees feel they belong and can contribute their unique qualities to the team. The Cardinals are dedicated to continuously building a diverse staff, and we strongly encourage candidates who are members of historically marginalized groups which may include, but are not limited to persons of color, LGBTQIA, gender, veterans, and persons with disabilities, to apply. If you meet any of the qualifications listed below we welcome you to apply, or to reach out to us at hrinfo@cardinals.com for more information. Read the rest of this entry »
The following article is part of Jay Jaffe’s ongoing look at the candidates on the BBWAA 2022 Hall of Fame ballot. For a detailed introduction to this year’s ballot, and other candidates in the series, use the tool above; an introduction to JAWS can be found here. For a tentative schedule and a chance to fill out a Hall of Fame ballot for our crowdsourcing project, see here. All WAR figures refer to the Baseball-Reference version unless otherwise indicated.
2022 BBWAA Candidate: A.J. Pierzynski
Player
Pos
Career WAR
Peak WAR
JAWS
H
HR
SB
AVG/OBP/SLG
OPS+
A.J. Pierzynski
C
23.8
18.1
20.9
2,043
188
15
.280/.319/.420
94
SOURCE: Baseball-Reference
For the sake of diplomacy, we’ll call A.J. Pierzynski a polarizing player, even if much of that polarization tended towards the negative end of the spectrum. “If you play against him, you hate him,” said his own manager Ozzie Guillen in 2006, the year after Pierzynski served as the starting catcher for the World Series-winning White Sox. “If you play with him, you hate him a little less.”
Pierzynski spent parts of 19 seasons in the majors provoking extreme reactions among players, fans, and everyone else, that while making two All-Star teams, helping five teams to the playoffs, and catching more games than all but eight other backstops. A November 2013 article by NESN’s Ricky Doyle, at a point just a few weeks before the defending champion Red Sox signed him as a free agent, summarized the book on Pierzynski to that point:
The most obvious risk of signing Pierzynski involves his accompanying baggage. There’s a difference between having a colorful personality and having a personality that evokes disdain, and Pierzynski’s behavior seemingly strikes a chord. According to an August 2012 article on SI.com, Pierzynski has in his career been voted by his opponents as the player they would most like to see beaned (2006), baseball’s meanest player (2011) and baseball’s most hated player (2012). Men’s Journalpolled 100 MLB players on various topics in 2012, and 34 percent of respondents voted Pierzynski the most hated player in the game.
“Everyone wants a villain,” Pierzynski told SI.com’s Ben Reiter in the aforementioned profile. Reiter was able to penetrate the persona to find an introspective, intelligent and hard-working player, not to mention a devoted family man. “Look at what LeBron James has gone through the past few years. My teammates get the best kick of it,” Pierzynski continued. “When we go to Oakland, Anaheim, San Francisco, Minnesota, Cleveland, I get loud boos. Guys on my team can’t wait to see that and to hear that… Now, when those polls come out, it’d be a big upset if somebody else won.” Read the rest of this entry »