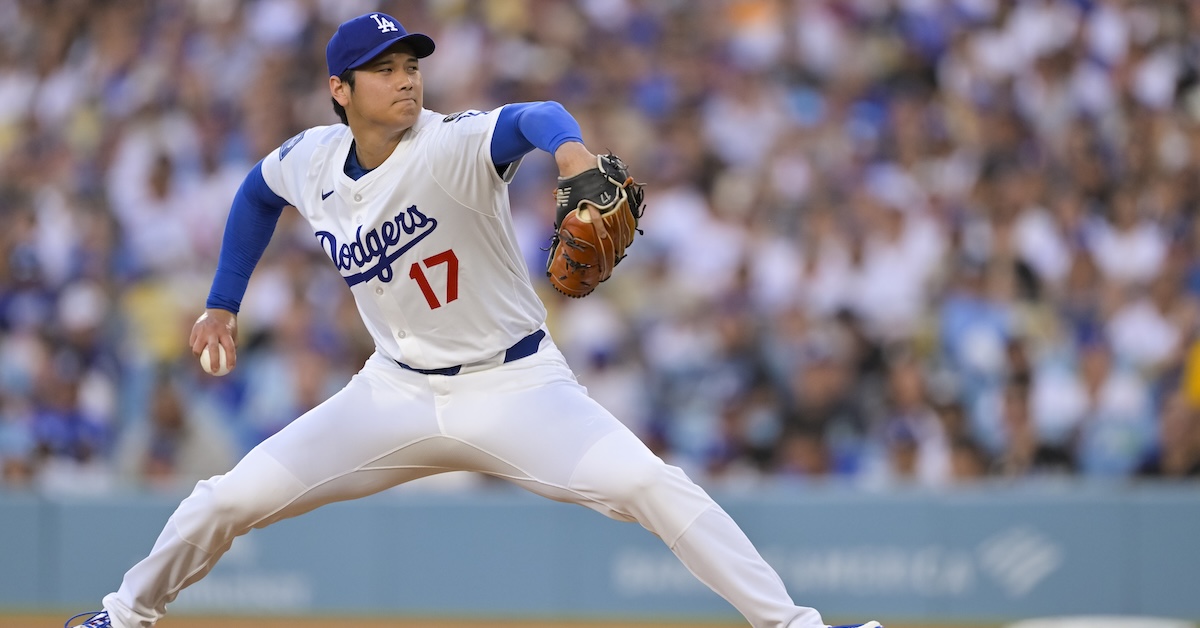
On Monday night in Los Angeles, Shohei Ohtani made his first major league start for the Dodgers. For any other starter signed before the 2024 season, that would be a disastrous sentence to type. Ohtani, of course, became the charter member of the 50/50 club, won the National League MVP, and then helped his team win the World Series. But he came to the Dodgers to hit and pitch, not just to play DH, and last night marked a key step in that process, his first game action as he rehabs from a 2023 elbow surgery.
I watched every pitch of Ohtani’s one-inning outing to compile a report. Obviously, these are the observations of a data analyst, not a scout. I’ve supplemented them with the Statcast and pitch model data generated overnight. I’m not the type to ignore the numbers, but realistically speaking, 28 pitches isn’t enough for a real sample, so the data is more supporting than primary. I’ll start with my first impressions, walk through each of the four pitch types Ohtani threw, and then share some general conclusions. Read the rest of this entry »
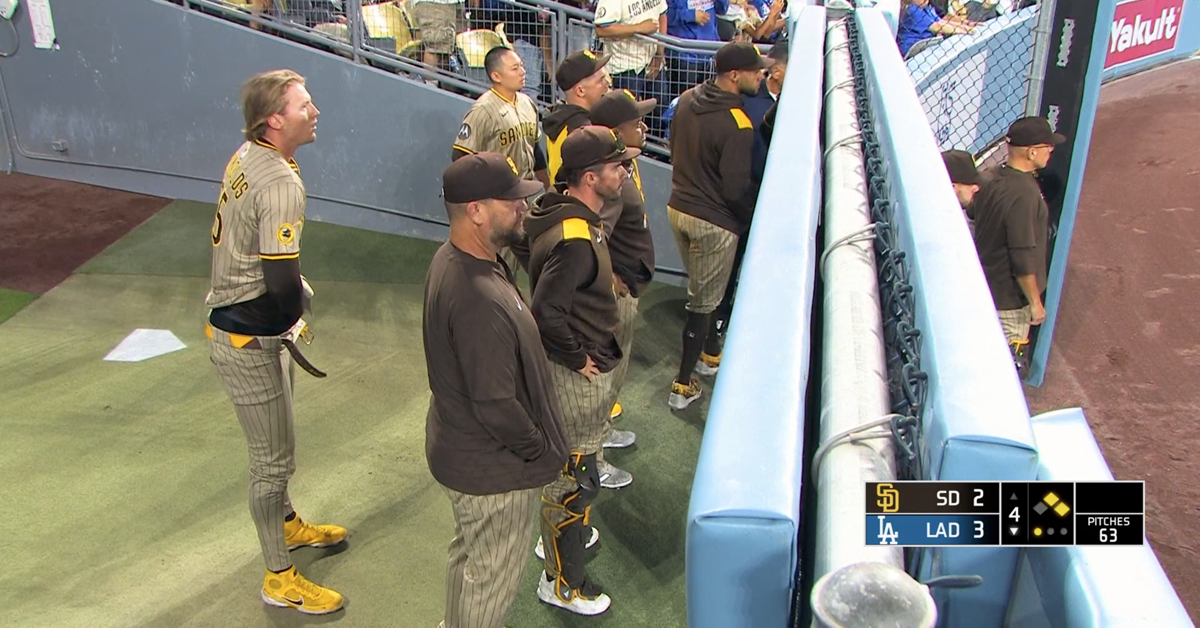
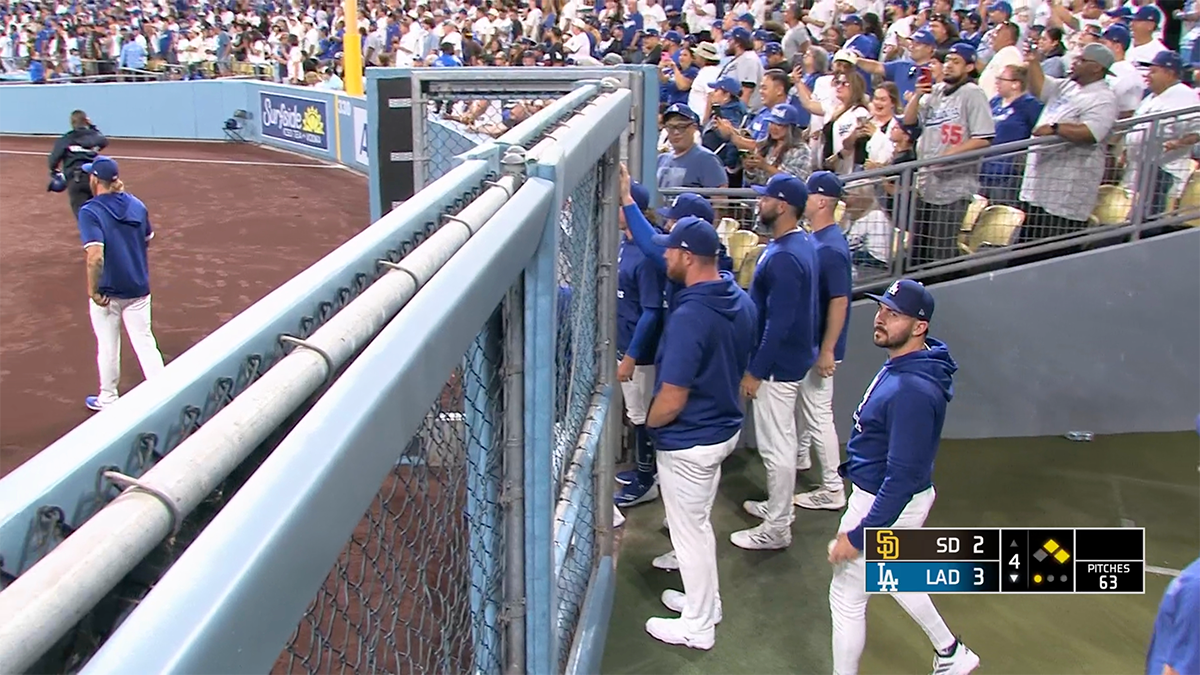
Alright, Dodgers bullpen! This is what we’ve been training for. They hit our guy. This is not a drill. I know it was an accident. I know it would have been the world’s worst time to throw at a hitter, down by a run in the fourth inning, a runner already on base, ahead in the count with the platoon advantage, unprovoked. But none of that matters right now. It’s time to look tough.
Everybody crowd up against the fence like you can’t wait to burst through the door. Time to posture. Strike a pose. This moment right here? This is the reason we watched The Warriors so many times. It’s time to get mean. It’s time to maybe, possibly, not really but you never know just in case, shove somebody a bit. We’re ready to jog out there. We’re ready to flex. Everybody ready for a fight?
You know Shohei and Clayton and Freddie and Mookie. Teo and Will Smith and Blake Snell and Roki. But do you recall the least heralded Dodger of all? Well, that’s not exactly fair, and I didn’t even name all the famous Dodgers, but here’s the point: I’m writing about a Dodger who isn’t one of the guys who seem to steal every headline.
Meet Andy Pages, the Dodgers’ everyday center fielder. A year ago, Pages was just another hopeful, the latest in a line of plus-bat, where-can-he-play-defense-though options cycling through the corners in Chavez Ravine. Pages’ prospectreports paint a clear picture: a swing built for lift, plenty of swing-and-miss, and sneaky athleticism that exploded after Pages returned from shoulder surgery. In 116 games of big league play, he took over center field (mostly out of necessity — he looked stretched there at times) and posted a league average batting line, though without the home run power that evaluators expected from him.
If you could freeze time there and give the Dodgers the option of having exactly that Pages for the next five years, I think they would have begrudgingly accepted it. Teams as full of stars as Los Angeles’ current squad need role players to fill the cracks in the roster, and outfielders who can handle center and hit at least okay are always in high demand. That isn’t to say that there weren’t encouraging signs – Pages’ athleticism was better than advertised and he showed plus bat speed – but a bird in the hand is worth two in the bush, and he was already an excellent cog in the machine even without fully unlocking his power.
Flash-forward to this season. Pages started the year playing center and batting ninth. That’s the lineup spot for a complementary piece, a defensive specialist or fourth outfielder. He started slow, with a 70 wRC+ over his first month of play. The Dodgers didn’t have better options defensively, and in fact, Pages looked downright smooth out there, both to my eyes and to defensive model grades. When your team posts a collective 126 wRC+ for the months of March and April (for the months of May and June so far, too — this team is pretty good!), you can live with a below-average hitter playing a tough defensive position, so the Dodgers kept running Pages out there, slow start and all. And that brings us to April 22, when Pages got hot and didn’t stop. Read the rest of this entry »
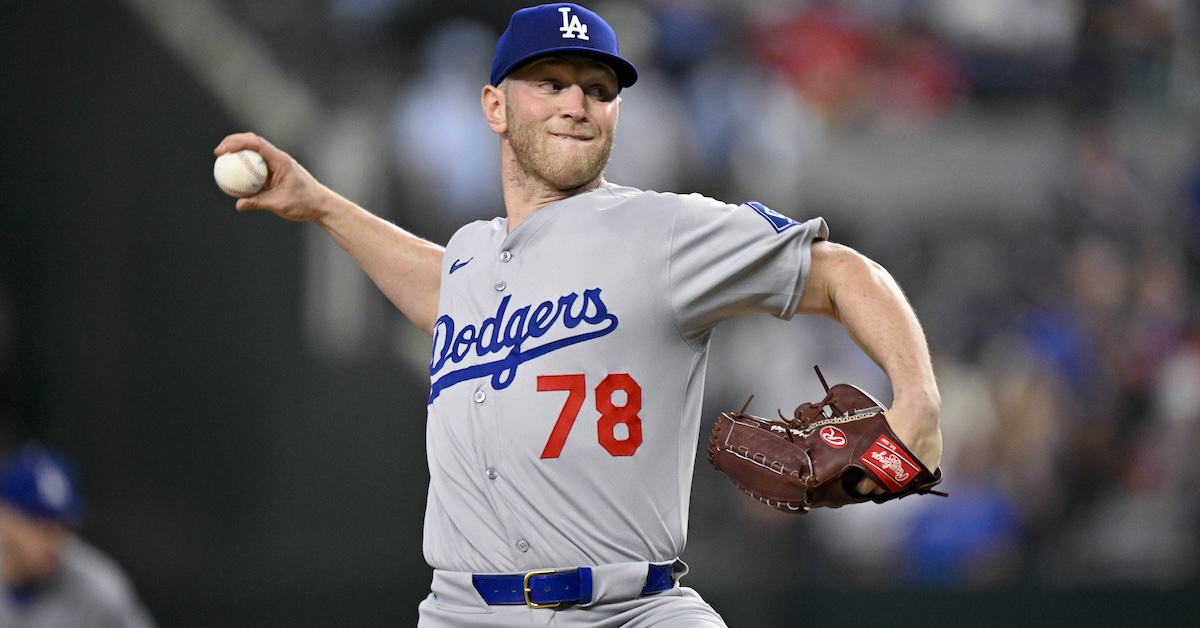
About six weeks ago, Eric Longenhagen published his Dodgers Top Prospects list. It ran 51 players deep, and was headlined by some of the trendiest names in prospect circles: Roki Sasaki, Dalton Rushing, Zyhir Hope. Down at no. 24, headlining the 40 FV group, was a blurb that started with the following phrase: “Low Leverage Ben.”
I guess when you’re in the double digits on the Dodgers’ starting pitcher pecking order, getting “Low Leverage” as a nickname is an occupational hazard. But I don’t like it. Mostly because it’s one short of the three-beat alliteration that made “Late Night LaMonte” roll off the tongue so felicitously. (My condolences to LaMonte Wade Jr. on his recent DFA.)
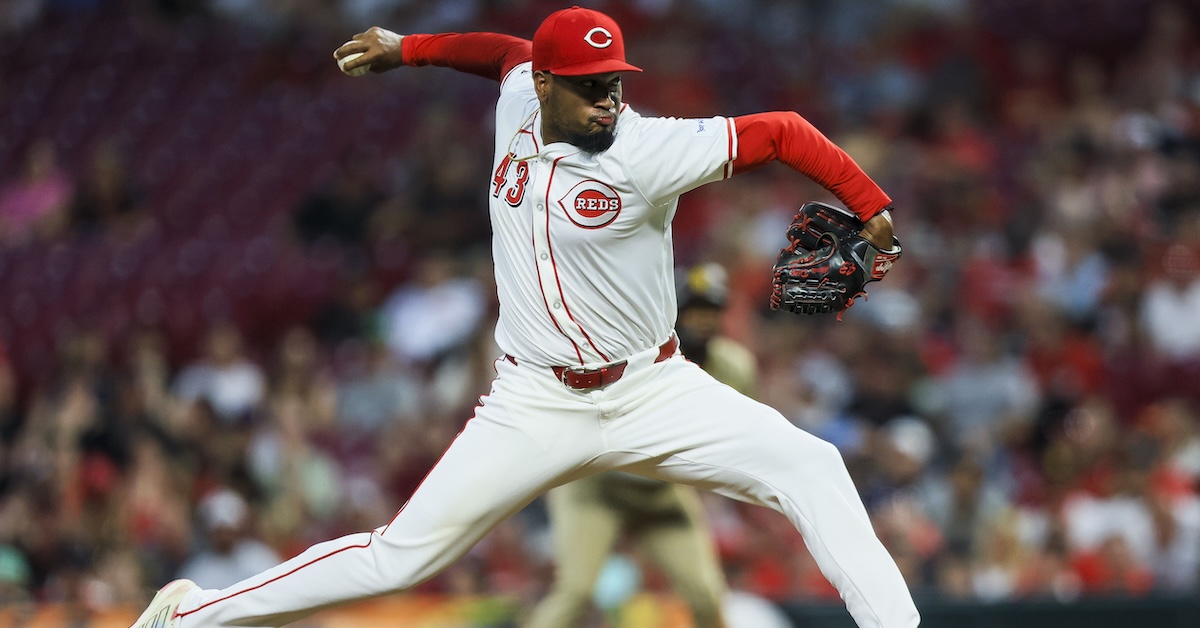
The Dodgers have had some impressive successes in recent years when it comes to acquiring pitchers who have struggled or failed to distinguish themselves elsewhere and then helping them flourish. Tyler Anderson made his first All-Star team as a Dodger in 2022, at his fifth stop in seven seasons. Evan Phillips owned a 7.26 career ERA before being plucked off waivers in 2021, and has since become a dominant part-time closer. Last summer Michael Kopech went from getting knocked around with the White Sox to closing games for the Dodgers within three weeks of being traded. Anthony Banda, Ryan Brasier, Andrew Heaney… the list goes on. Beset by pitching injuries yet again, on Thursday, Los Angeles acquired Alexis Díaz from the Reds with an eye toward helping him recover the form that made him an All-Star just two years ago.
The 28-year-old Díaz, the younger brother of Mets closer Edwin Díaz by two and a half years, has regressed considerably since his standout rookie campaign with the Reds in 2022. He spent the month of May pitching for Cincinnati’s Triple-A Louisville affiliate after a left hamstring injury suffered in spring training compromised his mechanics and displaced him from closer duty. The deal — which went down the day before the Dodgers announced that Phillips will undergo Tommy John surgery next week — sent 2024 draft pick Mike Villani to the Reds.
The Reds drafted Díaz in the 12th round in 2015 out of Juan Jose Maunez High School in Naguabo, Puerto Rico. His climb to the majors was slowed by 2016 Tommy John surgery and the coronavirus pandemic; he didn’t even reach Double-A until 2021. He broke camp with the Reds the following spring and allowed just one run and seven hits in his first 17 1/3 innings — capped by his first career save — while striking out 21. By late August, he was the primary closer, albeit on a team bound for 100 losses. He finished the year with a 1.84 ERA, a 32.5% strikeout rate, and 10 saves in 63 2/3 innings, a performance that helped him place fifth in the NL Rookie of the Year voting. Read the rest of this entry »
Hello, and welcome to another edition of Five Things I Liked (Or Didn’t Like) This Week. Memorial Day marks the point at which we’re a third of the way through the season, a great time to take stock of how preseason story lines have fared in the light of the regular season day. The Orioles might be bad. The Phillies and Tigers might be great. The Rockies might be the worst team of all time. Aaron Judge might be an alien. We’ve learned a lot so far – but none of those things affect the day-to-day experience of watching baseball. That’s what I like about it so much – you can turn on a random game, completely ignore any of those overarching narratives, and still see something delightful. So this week, let’s celebrate the little things that don’t necessarily win games but do consistently bring a smile to my face. With my customary nod to Zach Lowe of The Ringer for his basketball column that inspired this one, let’s dive in.
1. Determination
I’ve always been fascinated by Nick Allen, who blends elite shortstop defense with a completely powerless approach to offense. That combination got him traded to the Braves this winter to play a utility infielder role, but he outplayed Orlando Arcia in spring training to claim the starting job, and he’s been running with it. Not on offense – his 68 wRC+ is both mortifying and a career high – but on defense, he’s never been better.
Allen’s defense is many things, but most importantly to me, it’s kinetic. He doesn’t give up on plays. He’s always moving. He’ll throw from any platform, any arm angle, jump or twist or slide to get more force behind it. He’s graceful around second base, but it’s a nervous kind of grace, a ballet dancer after four shots of espresso. And if something gets in his way, he’ll just run through it:
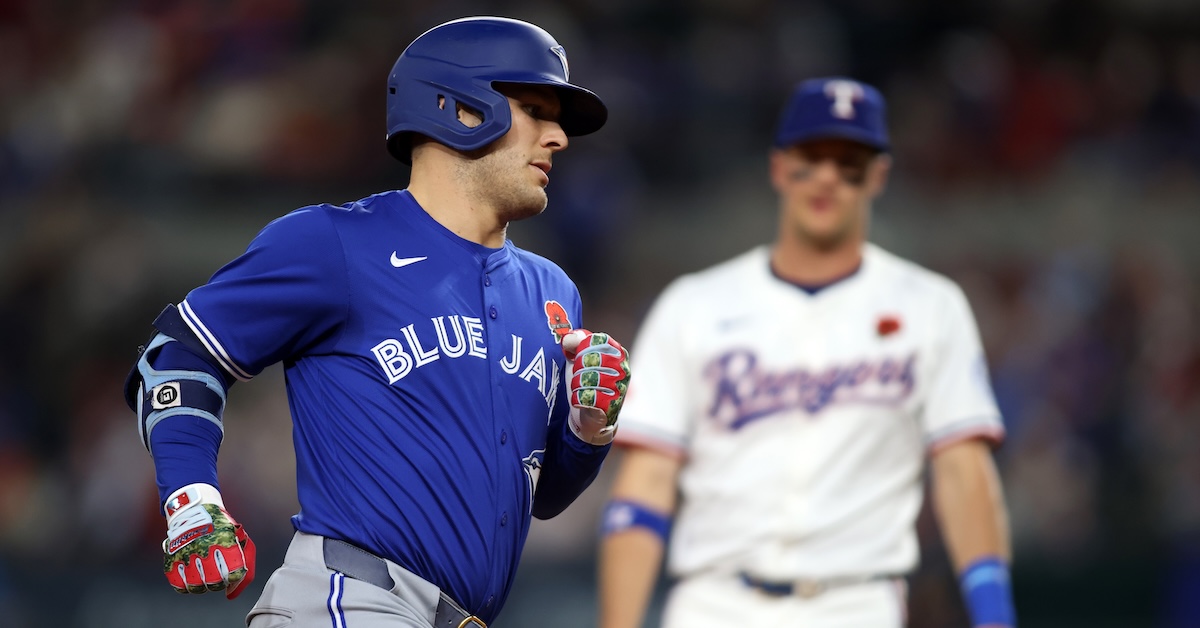
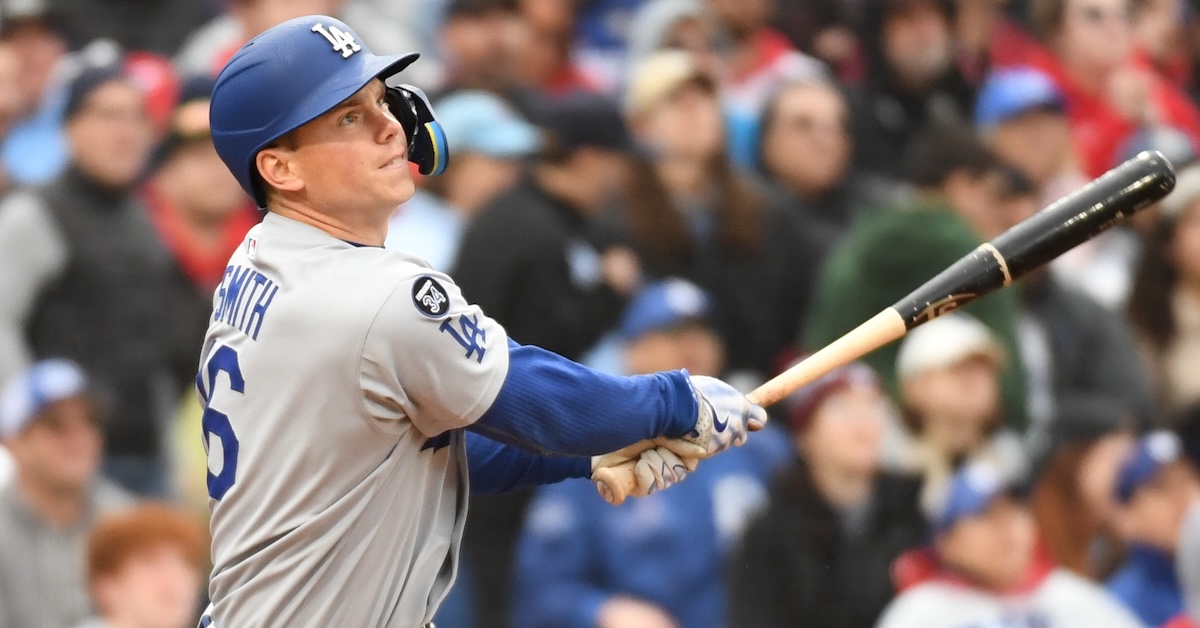
In Shohei Ohtani, Mookie Betts, and Freddie Freeman, the Dodgers don’t lack for superstars with potent bats, but so far this season, Will Smith is swinging — and, notably, not swinging — just about as well as any of them. The two-time All-Star catcher is off to an exceptionally hot start, particularly with runners in scoring position, and the Dodgers recently shook up their roster with an eye towards helping him maintain a high level of production later into the season.
The 30-year-old Smith is hitting .333/.456/.511, good enough to lead the NL in on-base percentage and to rank third in wRC+ (175) behind only Freeman (191) and Ohtani (182). Often batting ahead of either Max Muncy or Michael Conforto — both of whom have struggled thus far this year — he’s been pitched around to some degree, and he’s shown exceptional plate discipline:
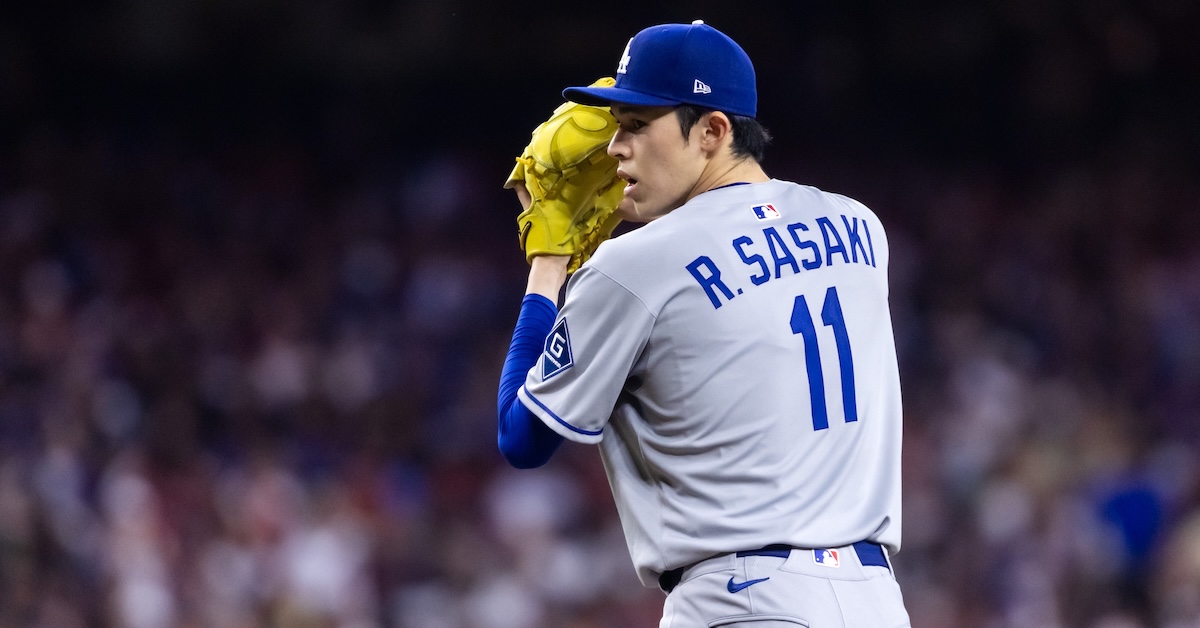
Though Roki Sasaki’s deal with the Dodgers wasn’t anywhere close to the winter’s biggest, few free agents were so coveted or came with as much hype attached. Known as “The LeBron James of Japanese baseball” for his exploits in high school, he was dominant — even transcendent — during his 2021–24 NPB run with the Chiba Lotte Marines. As he went through the posting process, his combination of youth and a tantalizing repertoire featuring an elite, 80-grade splitter as well as a fastball with triple-digit velocity generated widespread interest by teams, though a dip in that velo last year did rate as a cause for concern. Now, eight starts into his career with the Dodgers, the 23-year-old righty has been underwhelming, and now he’s hurt, too. On Tuesday, the team placed him on the 15-day injured list due to a shoulder impingement, continuing the dizzying level of turnover within the rotation of the NL West leaders.
This is the latest turn in what’s been a rocky rookie season for Roki. Through 34.1 innings — about 4 1/3 per start — he’s carrying a 4.72 ERA, a 6.16 FIP, and a 6.13 xERA. He’s struck out just 15.6% of batters, while walking 14.3% (the highest mark of any pitcher with at least 30 innings), and has served up 1.57 homers per nine. His 21.9% chase rate is the third-lowest at that 30-inning cutoff.
Batters have struggled to do anything with Sasaki’s splitter, which he’s thrown in the zone just 29.6% of the time; they’ve chased it 30.4% of the time, and overall have hit .137 and slugged .237 against it. Even so, his 35% whiff rate on the pitch is well off the 56.5% whiff rate it generated last year in NPB according to Sports Info Solutions. Batters have fared better against his slider (.250 AVG/.417 SLG, 33.3% whiff) and his four-seamer (.253 VG/.494 SLG, 10.1% whiff), rarely chasing either (14% of the time for the former, 15% for the latter). All six of his home runs allowed have been off of four-seamers, as have two would-be homers robbed by Andy Pages; his xSLG on that pitch is a worrisome .663. His 17.8% whiff rate on four-seamers in the upper third of the strike zone or higher is better, but batters have still slugged .692 on pitches there, with a .903 xSLG. Read the rest of this entry »
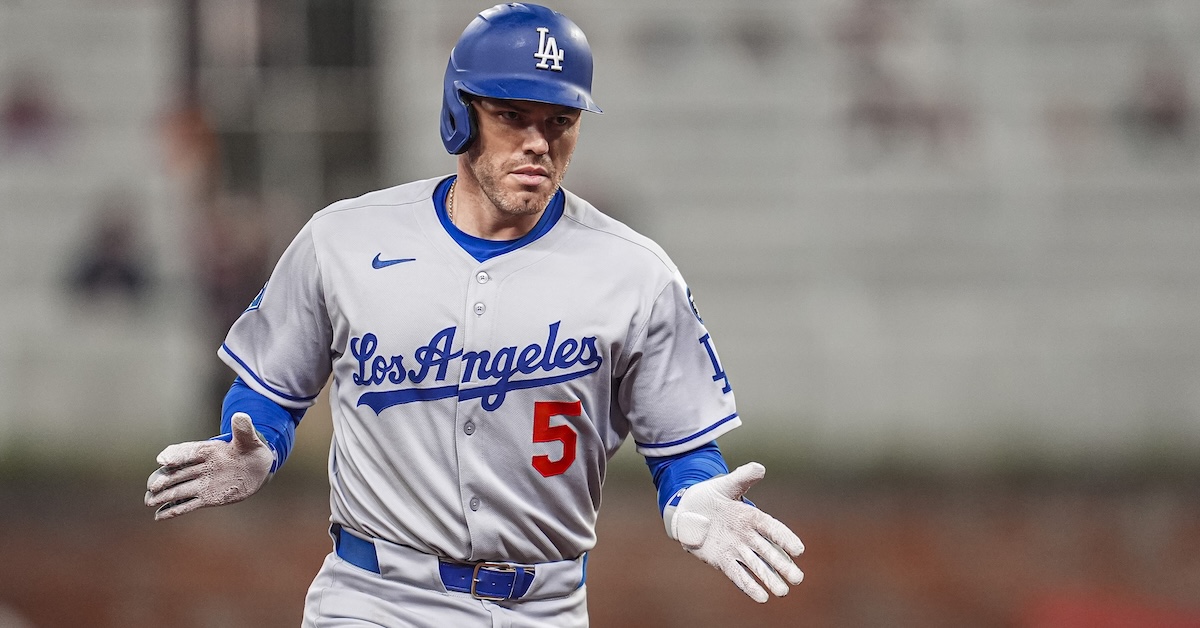
The world has changed in a lot of ways over the last dozen years, some good, and some… not. One thing that doesn’t change, however, is the status of Freddie Freeman at or near the top of the first base dogpile.
If at any point over the last decade you made a list of baseball’s top first basemen and didn’t include Freeman, you hopefully crumpled your list and started over again. Freeman will celebrate the 15th anniversary of his 2010 major league debut with the Braves later this year, and more than 2,000 hits and 350 homers later, he’s likely just rounding out the text on his bronze Hall of Fame plaque. Read the rest of this entry »
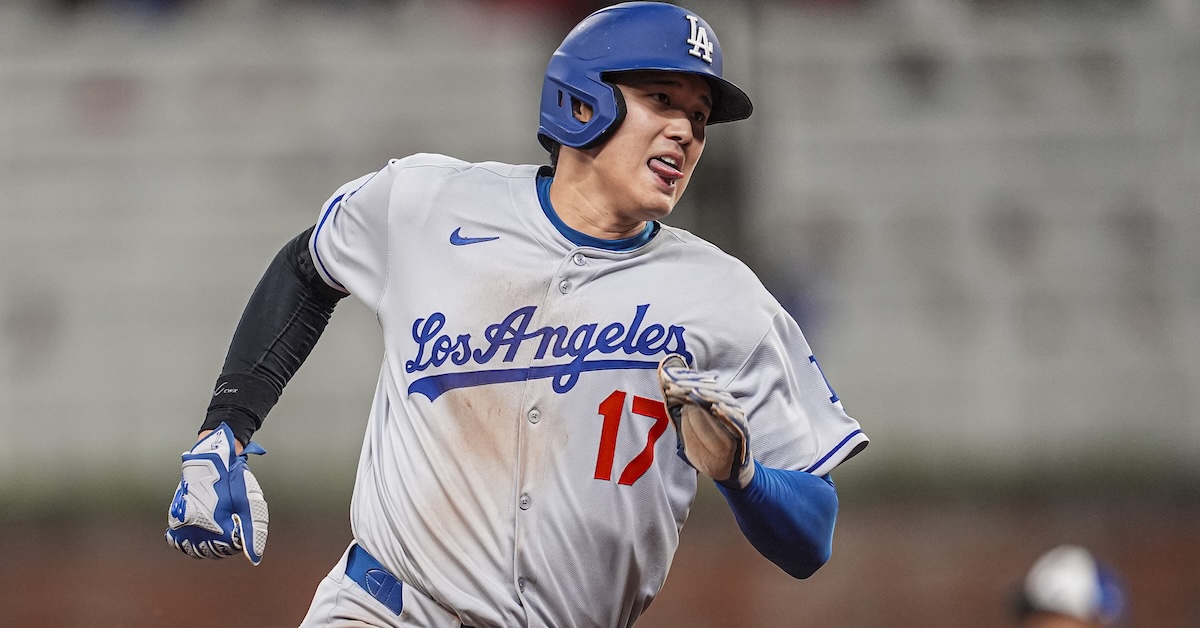
Shohei Ohtani leads the National League in runs. It’s not even close. He has scored 44 times in 2025. That’s 10 more runs than Fernando Tatis Jr., the next highest-scoring NL player. A couple of qualified NL batters haven’t even scored 10 runs yet this season.
Ohtani does not lead the National League in RBI. Not even close. If you visit our leaderboards and sort by RBI, you’ll have to click to the second page of names to find the reigning NL RBI king. Ohtani is tied for 36th in the senior circuit with 21 runs batted in. That’s only one more than the league median for a qualified hitter. Here’s another way to put it: The average NL batter has one RBI for every 8.8 plate appearances. Ohtani has averaged one RBI every 8.7 PA. It’s not so often that Ohtani is on the second page. It’s not so often that he’s a rounding error away from league average.
Runs and RBI might not be the best metrics for evaluating past performance or projecting the future, but they’re still two of the foremost storytelling statistics. So far, the story of Ohtani’s season is that he is scoring runs at an almost unbelievable rate but driving them in at a pedestrian pace. Since the beginning of the Live Ball era in 1920, we have records of 11,326 individual player seasons of at least 500 PA. In just 481 of those seasons, fewer than 5%, did the player finish with a higher run-to-RBI ratio than Ohtani’s current mark of 44:21 (2.095). As per usual, Ohtani stands out even among that small group of players. Take a look at this list of every player from the past decade who’s had a single-season run-to-RBI ratio higher than Ohtani’s 2.095. I’d like you to try and see if maybe, just maybe, you have a keen enough eye to spot the difference between Ohtani and the others: Read the rest of this entry »