Through seven minutes after the 8 pm E.T. Wednesday night, when Justin Verlander threw the first pitch of Game 6 to Washington’s Trea Turner, the 2019 World Series had recorded one lead change, zero home wins, and the lowest TV ratings in series history. What it needed, at least from the perspective of a non-partisan observer, was a little action, a little controversy, a little red blood in its veins. It got precisely that. This World Series is going to Game 7 tonight in Houston, and all it took to get there was two lead changes, five RBI from Anthony Rendon, a six-minute “replay” review, a managerial ejection, and quite possibly the best-traveled bats in Fall Classic history. That and 8.1 terrific innings from Stephen Strasburg.
In a moment of what we in the writing business call “foreshadowing,” the very first play of the game — a Turner groundball to Alex Bregman at third base — resulted in a replay review. The call on the field (out at first) was swiftly and uncontroversially overturned, and Turner took his base — and then a second — on his way to scoring the first Washington run of the game on an Rendon single to right (also, as it turns out, a sign of things to come). In a less eventful game, or one in which the final score was reversed, we might make more here of Dave Martinez’s decision to use Adam Eaton (and a bunt) to move Turner over in this inning; as we are consequentialists, we will not.
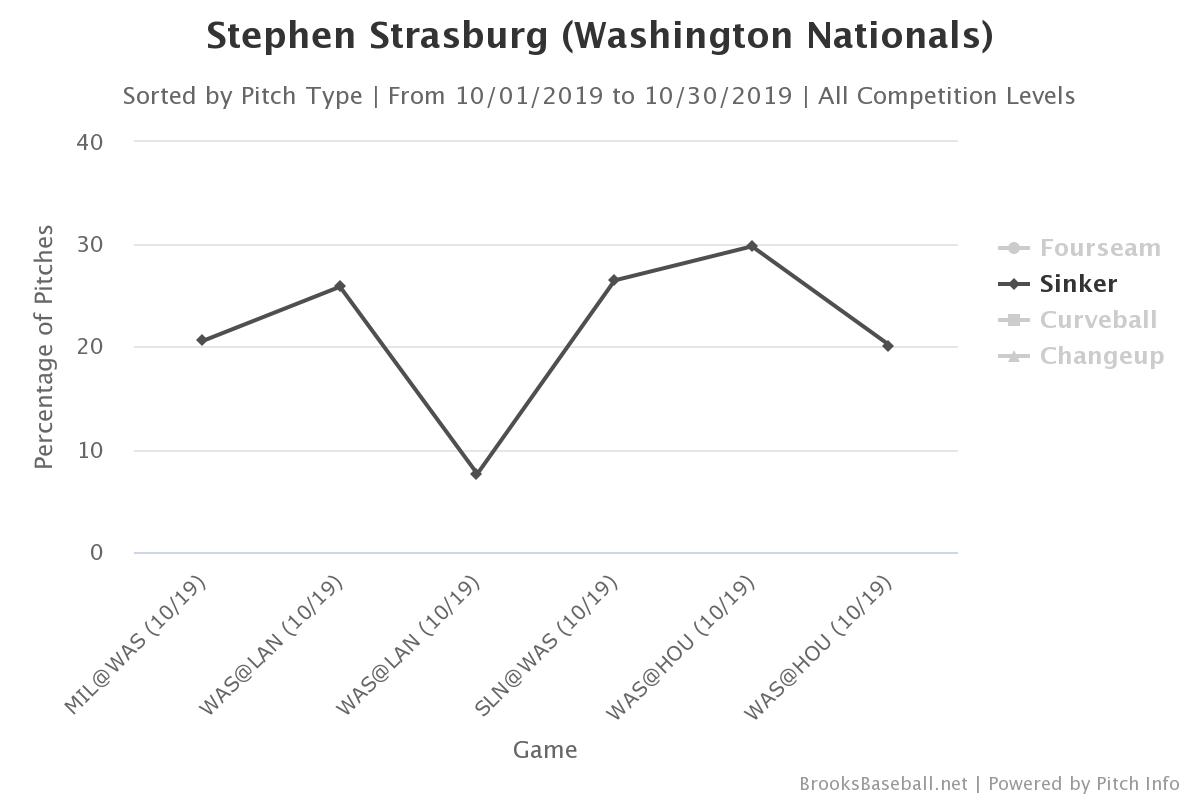
That first Nationals lead was itself overturned fewer than 10 minutes later, when a José Altuve sacrifice fly and a mammoth Bregman home run in the bottom of the inning put Strasburg on his heels and the score at 2-1 going into the second. Somewhat more importantly, given what was to come, Strasburg took just 13 pitches to get through his inning; Verlander threw 17. The next inning, which was scoreless for both clubs, added 7 and 12 to those totals. The third — also scoreless, though featuring a lively threat from Juan Soto — added 15 and 25, and by the time the fourth inning drew to a close, Verlander had thrown nearly 40% more pitches than his counterpart, and 75 on the game. He was, quite clearly, tiring. Read the rest of this entry »
 David Laurila: Hello fellow baseball fans. Let’s get this thing started.
 Dan Szymborski: Greetings chatters and chatees.