Runs Batted In is not the most reliable measure of a player’s offensive contribution in baseball. It isn’t particularly fair to evaluate a hitter based on how many players get on base in front of him. As the great William Shakespeare once wrote, “Some are born great, some achieve greatness, and some have runners in scoring position thrust upon them.” However, RBI has given rise to one under-appreciated stat. From 2013-2016, three of the most RBI-happy hitters on the St. Louis Cardinals roster were named Matt, namely Adams, Carpenter, Holliday. This led to the creation of an unofficial fan stat known as RMI (Runs Matted In), or runs batted in by players named Matt. Having enjoyed the RMI years in St. Louis, I thought I’d check in on baseball’s various Matts, and see how they stack up in 2019.
How many Matts do you know off the top of your head? Two, or perhaps three? There are actually 11 Matts with at least one plate appearance this season, making it the most common name among hitters. (Due to lack of plate appearances, American League pitchers are largely excluded from this statistic.) Let’s take a look at where we stand by team in 2019:
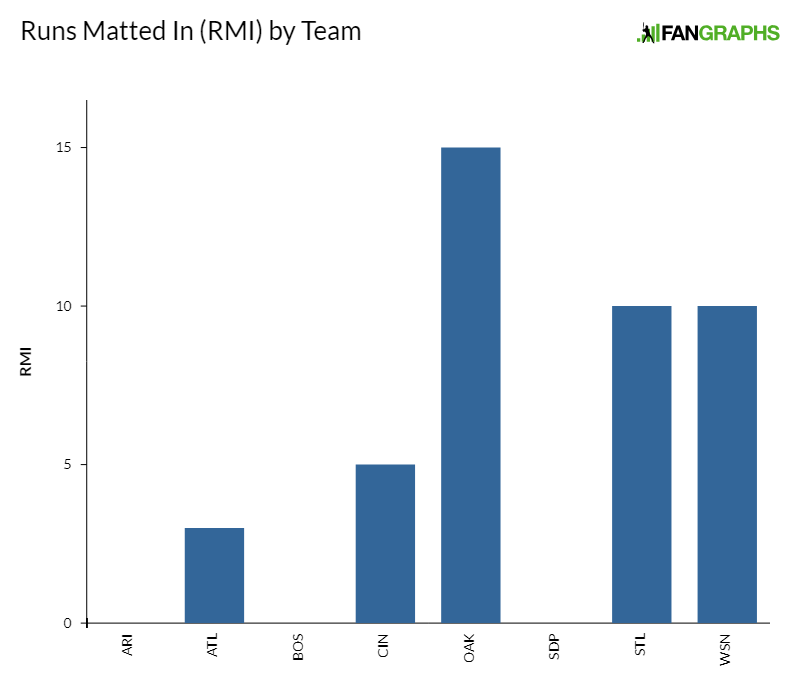
Not every team has a Matt, and not every Matt is a great hitter. Andriese and Koch are both pitchers for the Diamondbacks, neither of whom has so much as a hit. Barnes is one of only two Matts counted in the AL and is a pitcher for the Red Sox. He, unsurprisingly, also has not tallied a hit. Up next is Matt Joyce of Atlanta, who has Matted In three runs on the season. Then comes Matt Strahm of the Padres, another pitcher, who has two hits and a .500 average but no RMIs. Finally, there is Matt Olson, who has Matted in zero runs over six plate appearances for Oakland.
There is a three-way tie for third place in the current RMI standings, with each hitter tallying five. Matt Carpenter has played in 21 games and had 93 plate appearances, while his Cardinals compatriot, Matt Wieters, has just as many RMI while appearing in fewer than a third as many games. Rounding out the bronze medalists is Matt Kemp, who has 62 plate appearances and a wRC+ of 22 in Cincinnati. Contrast that with Carpenter’s 93 wRC+. How can three totally different players have the same number of RMI? We might speculate that RMI carries with it the same limitations as the more official, though still silly, RBI.
Carpenter has the unenviable position of hitting leadoff, a spot that notoriously lacks runners to bat in. The two hitters before him in an inning are generally first, the worst-hitting position player and second, the pitcher. He does, however, take second place among all Matts with three home runs. Four of his five RMI come from those homers, so he generates a lot of his RMIs by scoring himself, a Matt Matting In a Matt, as it were.
Playing backup to Yadier Molina is not going to yield many plate appearances, so we shouldn’t expect much out of Wieters in this category as the season progresses. However, he’s batting .333 in 11 plate appearances and has a wRC+ of 87, so while he’s still below average, he’s still making positive contributions when he can, especially by catching standards. Kemp, however, is on the opposite end of the spectrum. He bats further down in the lineup than Carpenter, and has hit .182 with runners in scoring position, yet he is at the same RMI level as the other two. Wieters has a quarter of Kemp’s plate appearances, but has Matted In the same number of runs.
Our silver medalist is the one and only Matt Adams. With ten Runs Matted In on the season and only 31 plate appearances, Big City is once again proving himself to be a force off the Nationals bench. His 84 wRC+ isn’t great, but five of his seven hits have gone for extra bases. Adams’ hits seem to come at more opportune times than Kemp’s, but does that make him better? Or could it be that as a pinch hitter, Matt Adams usually comes up with runners already on base? When it comes to RMI it does not Matt-er.
[Ba-dum tssh.]
The gold medal for Runs Matted In goes to the Athletics’ Matt Chapman. He has a 159 wRC+ in 94 plate appearances and has driven in 15 runs. He leads the “Matt Pack” with six homers in 22 games. Does that make him the Matt-riarch?
[Hold for applause.]
None of these players have similar profiles. Some hit in the middle of the order while others hit leadoff. Some hit for power while others get on base so they can be Matted In by the next hitter. Some are more Matt-ure at the plate than others. At the end of the day, you cannot judge a hitter, not even the Matts, by how many runs they drive in. It just doesn’t tell all that much.
There are other contenders for the most common name. Around baseball there are 10 hitters named Tyler and 10 named Jose, making it a tie for second place. Counting gets a little tricky once nicknames are included. For example, there are two Jacobs and seven Jakes; three Joes and five Joeys; three Johns, three Jonathans, and two Jons. The most common name with a diminutive is Michael, eight of them spanning the alphabet from A. Taylor to Wacha. They are supplemented by six Mikes, making them the quasi-leader with a total of 14.
Will you see RMI appearing on the FanGraphs leaderboards any time soon? No. But RMI is just as useful a statistic as RBI and twice as punny. As for the Matts in Arizona, Boston, and San Diego? To quote Dr. Seuss, “Your time will come, we love every Matt! A hitter’s a hitter, no matter how well they bat.”

 Dan Szymborski