2019 ZiPS Projections – Los Angeles Dodgers

After having typically appeared in the hallowed pages of Baseball Think Factory, Dan Szymborski’s ZiPS projections have now been released at FanGraphs for more than half a decade. The exercise continues this offseason. Below are the projections for the Los Angeles Dodgers.
Batters
Overall, the Dodgers still project as being among the best teams in baseball, but something feels curiously unsatisfying about the team’s offseason. The team appears to be shuffling the outfield again, but is the Cody Bellinger/A.J. Pollock/Guy in CF While A.J. Pollock is Injured/Maybe Alex Verdugo configuration really any better than the Bellinger/Joc Pederson/Yasiel Puig option — while still having Alex Wood and Kyle Farmer but not the Reds prospects — would have been? Maybe it is, maybe it isn’t. Pollock is a better player than Pederson, but riskier given his health history, and ZiPS has always been slightly underwhelmed by Verdugo. Given the team’s positional flexibility and their theoretical pocketbook, this depth chart could still change considerably over the next month; despite the tea leaves suggesting they’re out on Bryce Harper, I remain less than 100% convinced.
One wonders how much of Los Angeles’ apparent lack of interest in a big name isn’t a matter of feeling miserly, but is simply a reflection of the state of the NL West, which looks a lot less dangerous for the reigning champs than last year. Barring big changes, Arizona’s in a mostly-rebuilding phase, the Giants probably saw their last real opportunity to compete with their current core end last summer, and only part of San Diego’s prospect crop will be reaped this year, though a move for Manny Machado or J.T. Realmuto could accelerate the Padres’ timeline. That just leaves the Rockies, who while improved with Daniel Murphy at first, are unlikely to get quite as much awesomeness from their best players as they received in 2018. Colorado’s the biggest threat to the Dodgers in the division, but they’re also a passive team apparently content with their holes.
ZiPS is sold on Max Muncy, in large part due to his velocity data, the magnitude of his 2018 breakout, and the fact that his translated 2017 performance of .264/.351/.420 was more-than-adequate. That’s enough to effectively counteract his disappointing prior major league performance and meh-minus minor league translations of .218/.317/.346 and .219/.282/.359. In the end, ZiPS sees a lot more downside risk in Muncy’s batting average than his power, power being a difficult trick to fake.
Pitchers
Clayton Kershaw’s projection has to be the best OMG THAT’S HORRIBLE projection that ZiPS has ever spat out. The fact is, he’s missed time due to injury in four of the last five seasons and while no individual injury has been of the severe variety — the sort where ligaments are replaced or shoulders reconstructed — there’s evidence that he’s just not at the same level as he was from 2013-2016. ZiPS is still projecting him to be a star, but you can’t ignore his continued velocity decline and the loss of 20% of his strikeouts. That was enough to drop his yearly top comp from Sandy Koufax to “only” Tom Glavine. A brief aside: Kershaw was actually slightly easier to make contact against in 2018 than the average pitcher, which is really weird.
The bottom-line WAR projections aren’t generally in the stratosphere for the Dodgers, but that’s in large part due to the fact that the pitching staff has a checkered health record and ZiPS is only projecting Kershaw to qualify for the rate stat leaderboard. What the Dodgers don’t have in health they’ve been forced to make up for in depth, and of the pitchers on the 40-man roster, ZiPS projects a shocking 15 to have a league-average ERA or better (when adjusting for park, of course). Just on the major league roster, ZiPS sees both Caleb Ferguson and Ross Stripling as perfectly adequate fallback options if (when?) the rotation starts making DL trips.
I believe that Kenley Jansen is the first player to get a top comp of a prime Mariano Rivera (a few have gotten him as a minor-league starter). Seems kinda poetic given Jansen’s cutter, which ZiPS doesn’t actually know about, though he’s unlikely to retire as the best reliever in major league history. From a comp standpoint, a team shouldn’t be able to complain too much when a quarter of their pitching staff has Hall of Famers — easy ones rather than guys that just happened to be Frankie Frisch’s teammates — as their top comparisons.
Bench and Prospects
ZiPS doesn’t see the Dodger farm system as being as strong as it did in the last few years, but there’s still a lot of future major league value here. ZiPS isn’t on the Alex Verdugo star bandwagon, but at least sees him as an above-average starter in his prime, and the projections for Keibert Ruiz are of a similar level of quality. ZiPS thinks that both Dustin May and Dennis Santana wouldn’t embarrass themselves if dragooned into duty on the major league roster, and even Yadier Alvarez, a pitching prospect who a set of algorithms ought to have issues properly appreciating, gets a projection in the same zip code as league-average. ZiPS thinks that both Will Smith and Gavin Lux will be league-average regulars, but sees a significant quality dropoff after that pair. That’s not including Jeter Downs, who will get a projection for ZiPS Top 100 list, but I avoid giving official seasonal projections for players who’ve only played in the Midwest League outside of rookie ball unless I’m forced to by circumstance.
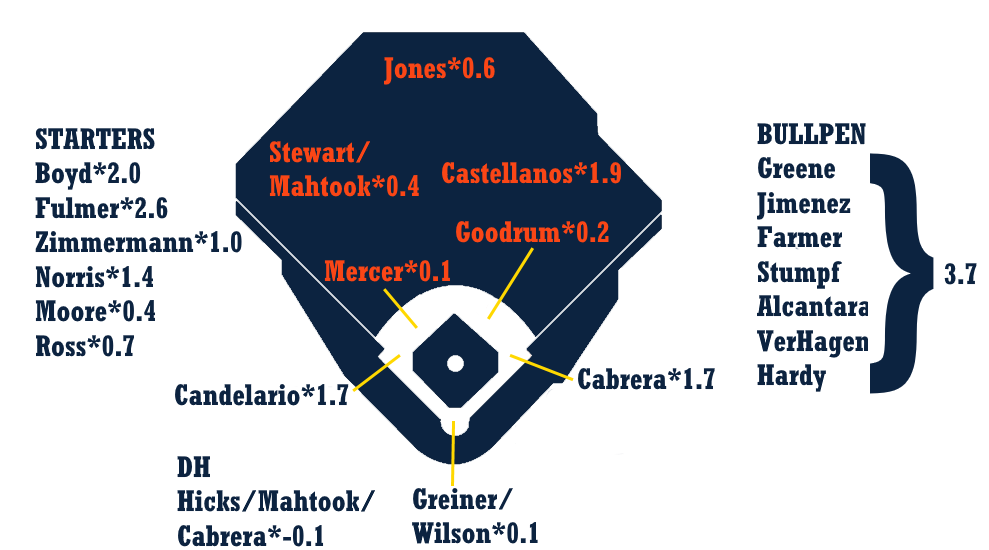
One pedantic note for 2019: for the WAR graphic, I’m using FanGraphs’ depth chart playing time, not the playing time ZiPS spits out, so there will be occasional differences in WAR totals.

Ballpark graphic courtesy Eephus League. Depth charts constructed by way of those listed here at site.
| Player | B | Age | PO | G | AB | R | H | 2B | 3B | HR | RBI | BB | SO | SB | CS |
|---|---|---|---|---|---|---|---|---|---|---|---|---|---|---|---|
| Manny Machado | R | 26 | SS | 156 | 618 | 88 | 174 | 36 | 2 | 34 | 112 | 60 | 110 | 11 | 3 |
| Cody Bellinger | L | 23 | 1B | 156 | 545 | 92 | 147 | 29 | 6 | 34 | 101 | 73 | 149 | 14 | 2 |
| Corey Seager | L | 25 | SS | 129 | 499 | 72 | 140 | 32 | 3 | 17 | 77 | 47 | 111 | 4 | 1 |
| Justin Turner | R | 34 | 3B | 118 | 409 | 60 | 119 | 27 | 1 | 15 | 63 | 46 | 64 | 4 | 1 |
| A.J. Pollock | R | 31 | CF | 114 | 425 | 65 | 112 | 24 | 4 | 16 | 57 | 32 | 90 | 16 | 4 |
| Chris Taylor | R | 28 | SS | 148 | 523 | 76 | 130 | 30 | 7 | 15 | 63 | 50 | 154 | 13 | 7 |
| Joc Pederson | R | 27 | CF | 136 | 386 | 62 | 92 | 24 | 2 | 22 | 62 | 56 | 108 | 3 | 5 |
| Max Muncy | L | 28 | 1B | 131 | 385 | 63 | 94 | 18 | 2 | 23 | 66 | 64 | 124 | 3 | 1 |
| Keibert Ruiz | B | 20 | C | 107 | 407 | 47 | 107 | 19 | 1 | 10 | 45 | 22 | 57 | 0 | 1 |
| Alex Verdugo | L | 23 | CF | 138 | 474 | 59 | 130 | 25 | 2 | 11 | 50 | 40 | 67 | 8 | 3 |
| Kiké Hernandez | R | 27 | CF | 145 | 361 | 55 | 89 | 19 | 2 | 16 | 48 | 44 | 87 | 3 | 0 |
| Russell Martin | R | 36 | C | 94 | 314 | 44 | 67 | 11 | 0 | 12 | 40 | 48 | 92 | 1 | 3 |
| Austin Barnes | R | 29 | C | 102 | 262 | 38 | 63 | 13 | 1 | 5 | 30 | 37 | 65 | 7 | 2 |
| Will D. Smith | R | 24 | C | 88 | 327 | 39 | 64 | 14 | 1 | 12 | 39 | 31 | 122 | 4 | 1 |
| David Freese | R | 36 | 3B | 111 | 335 | 39 | 82 | 14 | 1 | 10 | 50 | 31 | 97 | 0 | 0 |
| Gavin Lux | L | 21 | SS | 120 | 493 | 61 | 117 | 20 | 7 | 13 | 53 | 44 | 125 | 11 | 10 |
| DJ Peters | R | 23 | CF | 133 | 517 | 65 | 103 | 21 | 4 | 23 | 66 | 40 | 235 | 1 | 3 |
| Matt Beaty | L | 26 | 1B | 101 | 388 | 45 | 101 | 21 | 1 | 7 | 44 | 25 | 68 | 2 | 2 |
| Chase Utley | L | 40 | 2B | 94 | 203 | 24 | 46 | 12 | 2 | 3 | 20 | 19 | 41 | 4 | 1 |
| Andrew Toles | R | 27 | LF | 95 | 327 | 40 | 82 | 18 | 2 | 7 | 39 | 15 | 76 | 7 | 5 |
| Jake Peter | L | 26 | 2B | 117 | 426 | 46 | 96 | 16 | 2 | 8 | 41 | 30 | 126 | 6 | 4 |
| Rob Segedin | R | 30 | 1B | 85 | 282 | 37 | 68 | 13 | 2 | 9 | 41 | 21 | 69 | 1 | 1 |
| Rocky Gale | R | 31 | C | 98 | 324 | 29 | 72 | 13 | 2 | 3 | 29 | 15 | 65 | 1 | 1 |
| Angelo Mora | B | 26 | 2B | 105 | 370 | 36 | 87 | 16 | 4 | 6 | 40 | 20 | 94 | 4 | 3 |
| Edwin Rios | L | 25 | 3B | 109 | 406 | 47 | 95 | 22 | 1 | 13 | 54 | 22 | 144 | 1 | 2 |
| Travis Taijeron | R | 30 | RF | 116 | 397 | 50 | 84 | 21 | 2 | 16 | 55 | 41 | 165 | 1 | 2 |
| Connor Wong | R | 23 | C | 100 | 383 | 46 | 80 | 15 | 1 | 15 | 46 | 27 | 158 | 5 | 3 |
| Paulo Orlando | R | 33 | RF | 106 | 369 | 39 | 87 | 17 | 2 | 7 | 36 | 13 | 86 | 4 | 1 |
| Josh Thole | L | 32 | C | 34 | 98 | 8 | 19 | 3 | 0 | 1 | 6 | 9 | 23 | 1 | 0 |
| Shane Peterson | L | 31 | LF | 120 | 390 | 42 | 91 | 21 | 3 | 9 | 49 | 23 | 114 | 3 | 0 |
| Zach McKinstry | L | 24 | 2B | 94 | 325 | 35 | 67 | 12 | 3 | 4 | 27 | 32 | 103 | 3 | 3 |
| Jeren Kendall | L | 23 | CF | 110 | 438 | 42 | 84 | 13 | 5 | 10 | 36 | 35 | 181 | 22 | 17 |
| Cameron Perkins | R | 28 | 1B | 108 | 389 | 44 | 93 | 23 | 2 | 9 | 48 | 21 | 77 | 6 | 3 |
| Tyler Goeddel | R | 26 | LF | 99 | 322 | 35 | 70 | 11 | 3 | 5 | 30 | 27 | 89 | 7 | 3 |
| Cristian Santana | R | 22 | 3B | 128 | 536 | 56 | 123 | 19 | 1 | 18 | 68 | 15 | 163 | 1 | 2 |
| Zach Reks | L | 25 | LF | 84 | 297 | 31 | 69 | 10 | 2 | 4 | 24 | 24 | 99 | 5 | 4 |
| Errol Robinson | R | 24 | SS | 107 | 417 | 44 | 91 | 15 | 2 | 7 | 36 | 29 | 127 | 14 | 6 |
| Kyle Garlick | R | 27 | RF | 110 | 407 | 47 | 85 | 20 | 2 | 17 | 54 | 21 | 160 | 2 | 0 |
| Omar Estevez | R | 21 | SS | 133 | 538 | 57 | 111 | 26 | 2 | 11 | 53 | 33 | 171 | 2 | 2 |
| Michael Ahmed | R | 27 | 3B | 86 | 298 | 32 | 57 | 10 | 2 | 7 | 27 | 28 | 122 | 4 | 4 |
| Logan Landon | R | 26 | LF | 108 | 381 | 41 | 80 | 15 | 1 | 10 | 38 | 25 | 131 | 14 | 4 |
| Player | BA | OBP | SLG | OPS+ | ISO | BABIP | RC/27 | Def | WAR | No. 1 Comp |
|---|---|---|---|---|---|---|---|---|---|---|
| Manny Machado | .282 | .344 | .511 | 128 | .230 | .295 | 6.7 | -4 | 5.3 | Adrian Beltre |
| Cody Bellinger | .270 | .357 | .532 | 137 | .262 | .312 | 7.2 | 4 | 4.8 | Johnny Callison |
| Corey Seager | .281 | .346 | .459 | 116 | .178 | .332 | 6.0 | 3 | 4.0 | Troy Tulowitzki |
| Justin Turner | .291 | .376 | .472 | 128 | .181 | .315 | 6.8 | 3 | 4.0 | George Kell |
| A.J. Pollock | .264 | .320 | .452 | 106 | .188 | .301 | 5.5 | 3 | 2.7 | Jackie Brandt |
| Chris Taylor | .249 | .320 | .419 | 98 | .170 | .325 | 4.8 | -2 | 2.4 | Robby Thompson |
| Joc Pederson | .238 | .342 | .482 | 120 | .244 | .273 | 5.7 | -5 | 2.3 | Jon Nunnally |
| Max Muncy | .244 | .355 | .481 | 124 | .236 | .298 | 6.1 | -3 | 2.1 | Johnny Briggs |
| Keibert Ruiz | .263 | .308 | .388 | 88 | .125 | .285 | 4.3 | 3 | 1.8 | Mike Lieberthal |
| Alex Verdugo | .274 | .332 | .405 | 99 | .131 | .301 | 5.1 | -4 | 1.7 | Nick Markakis |
| Kiké Hernandez | .247 | .328 | .443 | 107 | .197 | .283 | 5.3 | -3 | 1.7 | Scott Hairston |
| Russell Martin | .213 | .329 | .363 | 88 | .150 | .262 | 3.9 | 1 | 1.5 | Rick Dempsey |
| Austin Barnes | .240 | .344 | .355 | 91 | .115 | .302 | 4.5 | 1 | 1.4 | Al Lopez |
| Will D. Smith | .196 | .277 | .355 | 70 | .159 | .269 | 3.4 | 7 | 1.3 | Rick Wilkins |
| David Freese | .245 | .324 | .382 | 91 | .137 | .316 | 4.4 | 1 | 1.2 | Tony Graffanino |
| Gavin Lux | .237 | .301 | .385 | 85 | .148 | .293 | 3.9 | -3 | 1.1 | D’Angelo Jimenez |
| DJ Peters | .199 | .272 | .389 | 77 | .190 | .309 | 3.5 | -2 | 0.4 | Brent Clevlen |
| Matt Beaty | .260 | .310 | .374 | 84 | .113 | .300 | 4.2 | 3 | 0.3 | Tommy Gregg |
| Chase Utley | .227 | .310 | .350 | 79 | .123 | .270 | 3.9 | -1 | 0.3 | Craig Counsell |
| Andrew Toles | .251 | .288 | .382 | 80 | .131 | .307 | 3.9 | 4 | 0.3 | Rod Allen |
| Jake Peter | .225 | .281 | .329 | 65 | .103 | .301 | 3.2 | 5 | 0.3 | Mendy Lopez |
| Rob Segedin | .241 | .298 | .397 | 86 | .156 | .289 | 4.2 | 1 | 0.2 | Marlin McPhail |
| Rocky Gale | .222 | .261 | .302 | 52 | .080 | .270 | 2.7 | 6 | 0.1 | Izzy Molina |
| Angelo Mora | .235 | .275 | .349 | 68 | .114 | .300 | 3.3 | 1 | 0.0 | Juan Melo |
| Edwin Rios | .234 | .278 | .389 | 78 | .155 | .329 | 3.7 | -4 | -0.1 | Roy Howell |
| Travis Taijeron | .212 | .295 | .395 | 85 | .184 | .315 | 3.9 | -5 | -0.2 | Dustan Mohr |
| Connor Wong | .209 | .271 | .371 | 72 | .162 | .310 | 3.4 | -9 | -0.3 | Bob Geren |
| Paulo Orlando | .236 | .268 | .350 | 66 | .114 | .290 | 3.4 | 4 | -0.3 | Dave Augustine |
| Josh Thole | .194 | .266 | .255 | 43 | .061 | .243 | 2.4 | -2 | -0.4 | Charlie Greene |
| Shane Peterson | .233 | .280 | .372 | 75 | .138 | .307 | 3.7 | -2 | -0.4 | Jalal Leach |
| Zach McKinstry | .206 | .288 | .298 | 60 | .092 | .289 | 2.8 | -1 | -0.4 | Abel Nieves |
| Jeren Kendall | .192 | .253 | .313 | 52 | .121 | .300 | 2.4 | 8 | -0.4 | Jimmy White |
| Cameron Perkins | .239 | .285 | .378 | 78 | .139 | .277 | 3.8 | -2 | -0.5 | Virgil Chevalier |
| Tyler Goeddel | .217 | .287 | .317 | 64 | .099 | .285 | 3.2 | 0 | -0.6 | Casey Craig |
| Cristian Santana | .229 | .252 | .369 | 66 | .140 | .296 | 3.2 | -3 | -0.7 | Matthew Moses |
| Zach Reks | .232 | .291 | .320 | 66 | .088 | .335 | 3.2 | -1 | -0.7 | Angelo Cuevas |
| Errol Robinson | .218 | .271 | .314 | 58 | .096 | .297 | 3.0 | -5 | -0.7 | Brian Bixler |
| Kyle Garlick | .209 | .253 | .393 | 72 | .184 | .296 | 3.5 | -3 | -0.8 | Brian McFall |
| Omar Estevez | .206 | .255 | .323 | 56 | .117 | .281 | 2.8 | -2 | -0.9 | Ricky Magdaleno |
| Michael Ahmed | .191 | .266 | .309 | 55 | .117 | .296 | 2.6 | -3 | -1.0 | Frank Kremblas |
| Logan Landon | .210 | .261 | .333 | 60 | .123 | .292 | 3.1 | -3 | -1.2 | Juan Piniella |
| Player | T | Age | W | L | ERA | G | GS | IP | H | ER | HR | BB | SO |
|---|---|---|---|---|---|---|---|---|---|---|---|---|---|
| Clayton Kershaw | L | 31 | 11 | 6 | 2.91 | 26 | 26 | 164.0 | 138 | 53 | 18 | 27 | 170 |
| Walker Buehler | R | 24 | 9 | 6 | 3.31 | 28 | 27 | 141.3 | 118 | 52 | 16 | 46 | 163 |
| Kenta Maeda | R | 31 | 12 | 8 | 3.63 | 36 | 24 | 143.7 | 131 | 58 | 17 | 43 | 149 |
| Rich Hill | L | 39 | 9 | 7 | 3.81 | 22 | 22 | 115.7 | 98 | 49 | 17 | 40 | 128 |
| Caleb Ferguson | L | 22 | 8 | 6 | 3.53 | 39 | 9 | 109.7 | 99 | 43 | 10 | 48 | 115 |
| Ross Stripling | R | 29 | 7 | 6 | 3.92 | 32 | 17 | 105.7 | 105 | 46 | 16 | 25 | 103 |
| Kenley Jansen | R | 31 | 3 | 2 | 2.95 | 64 | 0 | 64.0 | 50 | 21 | 9 | 15 | 81 |
| Hyun-jin Ryu | L | 32 | 6 | 5 | 3.89 | 17 | 17 | 88.0 | 89 | 38 | 14 | 21 | 82 |
| Dustin May | R | 21 | 7 | 7 | 4.45 | 24 | 24 | 131.3 | 142 | 65 | 19 | 35 | 96 |
| Scott Alexander | L | 29 | 3 | 2 | 3.61 | 67 | 0 | 67.3 | 63 | 27 | 5 | 26 | 57 |
| Ryan Madson | R | 38 | 4 | 3 | 3.28 | 52 | 0 | 49.3 | 44 | 18 | 5 | 13 | 50 |
| Joe Kelly | R | 31 | 3 | 2 | 3.56 | 65 | 0 | 60.7 | 51 | 24 | 4 | 29 | 64 |
| Dennis Santana | R | 23 | 5 | 5 | 4.24 | 18 | 16 | 87.0 | 83 | 41 | 11 | 35 | 87 |
| Yadier Alvarez | R | 23 | 3 | 3 | 4.43 | 21 | 14 | 67.0 | 62 | 33 | 6 | 45 | 65 |
| Daniel Corcino | R | 28 | 4 | 4 | 4.55 | 29 | 16 | 95.0 | 94 | 48 | 13 | 43 | 87 |
| Pedro Baez | R | 31 | 4 | 3 | 3.72 | 59 | 0 | 58.0 | 51 | 24 | 7 | 22 | 62 |
| Josh Sborz | R | 25 | 4 | 3 | 3.72 | 55 | 0 | 58.0 | 51 | 24 | 5 | 27 | 61 |
| Joe Broussard | R | 28 | 5 | 4 | 3.84 | 53 | 0 | 65.7 | 63 | 28 | 8 | 22 | 63 |
| Zach McAllister | R | 31 | 3 | 2 | 3.79 | 49 | 0 | 54.7 | 53 | 23 | 7 | 16 | 54 |
| Josh Fields | R | 33 | 2 | 2 | 3.75 | 53 | 0 | 48.0 | 45 | 20 | 6 | 14 | 47 |
| Mitchell White | R | 24 | 6 | 6 | 4.68 | 22 | 22 | 98.0 | 102 | 51 | 13 | 43 | 78 |
| Brock Stewart | R | 27 | 4 | 4 | 4.70 | 26 | 20 | 103.3 | 108 | 54 | 17 | 35 | 87 |
| Tony Cingrani | L | 29 | 2 | 1 | 3.66 | 45 | 0 | 39.3 | 32 | 16 | 5 | 17 | 50 |
| JT Chargois | R | 28 | 3 | 3 | 3.97 | 50 | 0 | 45.3 | 41 | 20 | 4 | 24 | 45 |
| Tony Gonsolin | R | 25 | 6 | 6 | 4.87 | 26 | 26 | 118.3 | 123 | 64 | 20 | 53 | 103 |
| John Axford | R | 36 | 3 | 2 | 3.94 | 46 | 0 | 48.0 | 44 | 21 | 4 | 23 | 47 |
| Dylan Floro | R | 28 | 4 | 4 | 4.28 | 52 | 0 | 67.3 | 72 | 32 | 9 | 18 | 48 |
| Julio Urias | L | 22 | 1 | 1 | 4.25 | 12 | 9 | 36.0 | 33 | 17 | 5 | 16 | 38 |
| Shea Spitzbarth | R | 24 | 4 | 4 | 4.24 | 43 | 0 | 68.0 | 63 | 32 | 10 | 31 | 74 |
| Kevin Quackenbush | R | 30 | 3 | 3 | 4.18 | 55 | 0 | 56.0 | 54 | 26 | 8 | 20 | 53 |
| Daniel Hudson | R | 32 | 3 | 3 | 4.18 | 53 | 0 | 51.7 | 48 | 24 | 6 | 24 | 52 |
| Logan Bawcom | R | 30 | 6 | 7 | 5.08 | 25 | 14 | 85.0 | 91 | 48 | 13 | 38 | 62 |
| Logan Salow | L | 24 | 4 | 4 | 4.32 | 39 | 0 | 50.0 | 48 | 24 | 6 | 26 | 49 |
| Nolan Long | R | 25 | 4 | 4 | 4.41 | 46 | 0 | 63.3 | 58 | 31 | 8 | 39 | 69 |
| C.C. Lee | R | 32 | 2 | 2 | 4.31 | 27 | 0 | 31.3 | 29 | 15 | 5 | 12 | 34 |
| Adam McCreery | L | 26 | 3 | 3 | 4.58 | 41 | 0 | 55.0 | 48 | 28 | 4 | 45 | 59 |
| Logan Ondrusek | R | 34 | 2 | 2 | 4.42 | 38 | 0 | 38.7 | 38 | 19 | 6 | 15 | 36 |
| Yimi Garcia | R | 28 | 2 | 2 | 4.43 | 42 | 0 | 40.7 | 43 | 20 | 8 | 7 | 37 |
| Adam Liberatore | L | 32 | 3 | 3 | 4.54 | 38 | 0 | 33.7 | 33 | 17 | 5 | 14 | 30 |
| Zach Neal | R | 30 | 5 | 6 | 5.28 | 29 | 15 | 105.7 | 123 | 62 | 21 | 16 | 56 |
| Erik Goeddel | R | 30 | 2 | 2 | 4.69 | 46 | 0 | 48.0 | 45 | 25 | 8 | 23 | 52 |
| Marshall Kasowski | R | 24 | 2 | 2 | 4.71 | 42 | 0 | 49.7 | 37 | 26 | 5 | 50 | 72 |
| Ben Holmes | L | 27 | 3 | 4 | 5.22 | 25 | 10 | 70.7 | 76 | 41 | 11 | 35 | 54 |
| Jaime Schultz | R | 28 | 4 | 5 | 5.36 | 41 | 11 | 80.7 | 74 | 48 | 16 | 53 | 97 |
| Tyler Pill | R | 29 | 5 | 7 | 5.36 | 22 | 17 | 99.0 | 114 | 59 | 18 | 32 | 61 |
| Parker Curry | R | 25 | 6 | 8 | 5.26 | 38 | 10 | 87.3 | 95 | 51 | 16 | 40 | 75 |
| Andre Scrubb | R | 24 | 4 | 5 | 5.05 | 38 | 0 | 57.0 | 55 | 32 | 6 | 46 | 52 |
| Dylan Baker | R | 27 | 3 | 5 | 5.67 | 30 | 1 | 33.3 | 38 | 21 | 6 | 17 | 20 |
| Justin de Fratus | R | 31 | 5 | 8 | 5.70 | 24 | 18 | 109.0 | 131 | 69 | 23 | 30 | 63 |
| Player | TBF | K/9 | BB/9 | HR/9 | BABIP | ERA+ | ERA- | FIP | WAR | No. 1 Comp |
|---|---|---|---|---|---|---|---|---|---|---|
| Clayton Kershaw | 648 | 9.33 | 1.48 | 0.99 | .278 | 139 | 72 | 3.03 | 4.1 | Tom Glavine |
| Walker Buehler | 586 | 10.38 | 2.93 | 1.02 | .288 | 122 | 82 | 3.44 | 2.9 | John Smoltz |
| Kenta Maeda | 601 | 9.33 | 2.69 | 1.06 | .295 | 115 | 87 | 3.64 | 2.8 | Mark Gubicza |
| Rich Hill | 486 | 9.96 | 3.11 | 1.32 | .276 | 109 | 92 | 4.09 | 2.0 | Al Leiter |
| Caleb Ferguson | 475 | 9.44 | 3.94 | 0.82 | .301 | 114 | 88 | 3.72 | 1.8 | Terry Forster |
| Ross Stripling | 442 | 8.77 | 2.13 | 1.36 | .301 | 103 | 97 | 3.94 | 1.4 | Gil Heredia |
| Kenley Jansen | 255 | 11.39 | 2.11 | 1.27 | .277 | 137 | 73 | 3.24 | 1.4 | Mariano Rivera |
| Hyun-jin Ryu | 370 | 8.39 | 2.15 | 1.43 | .299 | 104 | 96 | 4.14 | 1.2 | Zane Smith |
| Dustin May | 569 | 6.58 | 2.40 | 1.30 | .299 | 91 | 110 | 4.55 | 1.1 | Rick Wise |
| Scott Alexander | 288 | 7.62 | 3.48 | 0.67 | .293 | 115 | 87 | 3.67 | 1.0 | Harry Perkowski |
| Ryan Madson | 205 | 9.12 | 2.37 | 0.91 | .291 | 127 | 79 | 3.41 | 0.9 | Todd Jones |
| Joe Kelly | 261 | 9.49 | 4.30 | 0.59 | .292 | 117 | 86 | 3.48 | 0.9 | Jim Hughes |
| Dennis Santana | 378 | 9.00 | 3.62 | 1.14 | .300 | 95 | 105 | 4.17 | 0.9 | Denny Bautista |
| Yadier Alvarez | 307 | 8.73 | 6.04 | 0.81 | .299 | 94 | 106 | 4.57 | 0.6 | J.R. Richard |
| Daniel Corcino | 420 | 8.24 | 4.07 | 1.23 | .298 | 89 | 113 | 4.61 | 0.6 | Johnny Klippstein |
| Pedro Baez | 244 | 9.62 | 3.41 | 1.09 | .289 | 108 | 92 | 3.77 | 0.6 | Mike DeJean |
| Josh Sborz | 251 | 9.47 | 4.19 | 0.78 | .297 | 108 | 92 | 3.72 | 0.6 | Clay Bryant |
| Joe Broussard | 280 | 8.63 | 3.02 | 1.10 | .299 | 105 | 95 | 3.96 | 0.6 | Joe Grahe |
| Zach McAllister | 231 | 8.89 | 2.63 | 1.15 | .303 | 110 | 91 | 3.83 | 0.6 | Danny Patterson |
| Josh Fields | 201 | 8.81 | 2.63 | 1.13 | .293 | 111 | 90 | 3.75 | 0.5 | Terry Leach |
| Mitchell White | 437 | 7.16 | 3.95 | 1.19 | .299 | 86 | 116 | 4.75 | 0.5 | Ed Wojna |
| Brock Stewart | 450 | 7.58 | 3.05 | 1.48 | .297 | 86 | 117 | 4.77 | 0.5 | Mickey Callaway |
| Tony Cingrani | 167 | 11.44 | 3.89 | 1.14 | .290 | 110 | 91 | 3.71 | 0.4 | Yorkis Perez |
| JT Chargois | 201 | 8.93 | 4.76 | 0.79 | .296 | 105 | 95 | 4.10 | 0.4 | George Smith |
| Tony Gonsolin | 529 | 7.83 | 4.03 | 1.52 | .298 | 83 | 121 | 5.13 | 0.4 | Tom Griffin |
| John Axford | 210 | 8.81 | 4.31 | 0.75 | .299 | 102 | 98 | 3.84 | 0.4 | Turk Lown |
| Dylan Floro | 289 | 6.42 | 2.41 | 1.20 | .297 | 97 | 103 | 4.35 | 0.4 | Tom Morgan |
| Julio Urias | 156 | 9.50 | 4.00 | 1.25 | .292 | 95 | 105 | 4.26 | 0.3 | Trevor Wilson |
| Shea Spitzbarth | 298 | 9.79 | 4.10 | 1.32 | .296 | 95 | 105 | 4.43 | 0.3 | Anthony Chavez |
| Kevin Quackenbush | 239 | 8.52 | 3.21 | 1.29 | .293 | 97 | 104 | 4.24 | 0.3 | Jose Silva |
| Daniel Hudson | 226 | 9.06 | 4.18 | 1.05 | .298 | 96 | 104 | 4.21 | 0.3 | Marc Wilkins |
| Logan Bawcom | 381 | 6.56 | 4.02 | 1.38 | .295 | 82 | 122 | 5.16 | 0.2 | Blue Moon Odom |
| Logan Salow | 224 | 8.82 | 4.68 | 1.08 | .300 | 93 | 107 | 4.49 | 0.2 | Mike Murphy |
| Nolan Long | 287 | 9.81 | 5.54 | 1.14 | .299 | 92 | 109 | 4.65 | 0.1 | Anthony Chavez |
| C.C. Lee | 135 | 9.77 | 3.45 | 1.44 | .293 | 94 | 107 | 4.39 | 0.1 | Jason Childers |
| Adam McCreery | 257 | 9.65 | 7.36 | 0.65 | .301 | 91 | 110 | 4.57 | 0.1 | Clay Bryant |
| Logan Ondrusek | 167 | 8.38 | 3.49 | 1.40 | .294 | 91 | 110 | 4.55 | 0.1 | Ricky Barlow |
| Yimi Garcia | 171 | 8.19 | 1.55 | 1.77 | .299 | 91 | 110 | 4.55 | 0.1 | Jeff Tam |
| Adam Liberatore | 148 | 8.02 | 3.74 | 1.34 | .289 | 89 | 113 | 4.72 | 0.0 | Mike Venafro |
| Zach Neal | 452 | 4.77 | 1.36 | 1.79 | .288 | 79 | 127 | 5.27 | 0.0 | Tim McClaskey |
| Erik Goeddel | 211 | 9.75 | 4.31 | 1.50 | .294 | 86 | 116 | 4.71 | 0.0 | Mike Cook |
| Marshall Kasowski | 236 | 13.05 | 9.06 | 0.91 | .302 | 86 | 117 | 4.76 | -0.1 | Rafael Pimentel |
| Ben Holmes | 322 | 6.88 | 4.46 | 1.40 | .298 | 77 | 129 | 5.30 | -0.1 | Wade Blasingame |
| Jaime Schultz | 369 | 10.82 | 5.91 | 1.79 | .293 | 78 | 129 | 5.48 | -0.2 | Leslie Brea |
| Tyler Pill | 441 | 5.55 | 2.91 | 1.64 | .296 | 75 | 133 | 5.43 | -0.3 | Don August |
| Parker Curry | 396 | 7.73 | 4.12 | 1.65 | .304 | 77 | 130 | 5.36 | -0.3 | David Potts |
| Andre Scrubb | 271 | 8.21 | 7.26 | 0.95 | .299 | 80 | 125 | 5.27 | -0.3 | Lloyd Allen |
| Dylan Baker | 154 | 5.40 | 4.59 | 1.62 | .294 | 73 | 136 | 6.00 | -0.3 | Tom Dukes |
| Justin de Fratus | 486 | 5.20 | 2.48 | 1.90 | .298 | 71 | 141 | 5.76 | -0.7 | Allen Davis |
Disclaimer: ZiPS projections are computer-based projections of performance. Performances have not been allocated to predicted playing time in the majors — many of the players listed above are unlikely to play in the majors at all in 2019. ZiPS is projecting equivalent production — a .240 ZiPS projection may end up being .280 in AAA or .300 in AA, for example. Whether or not a player will play is one of many non-statistical factors one has to take into account when predicting the future.
Players are listed with their most recent teams, unless I have made a mistake. This is very possible, as a lot of minor-league signings go generally unreported in the offseason.
ZiPS’ projections are based on the American League having a 4.29 ERA and the National League having a 4.15 ERA.
Players who are expected to be out due to injury are still projected. More information is always better than less information, and a computer isn’t the tool that should project the injury status of, for example, a pitcher who has had Tommy John surgery.
Both hitters and pitchers are ranked by projected zWAR — which is to say, WAR values as calculated by me, Dan Szymborski, whose surname is spelled with a z. WAR values might differ slightly from those which appear in full release of ZiPS. Finally, I will advise anyone against — and might karate chop anyone guilty of — merely adding up WAR totals on a depth chart to produce projected team WAR.
 Dan Szymborski