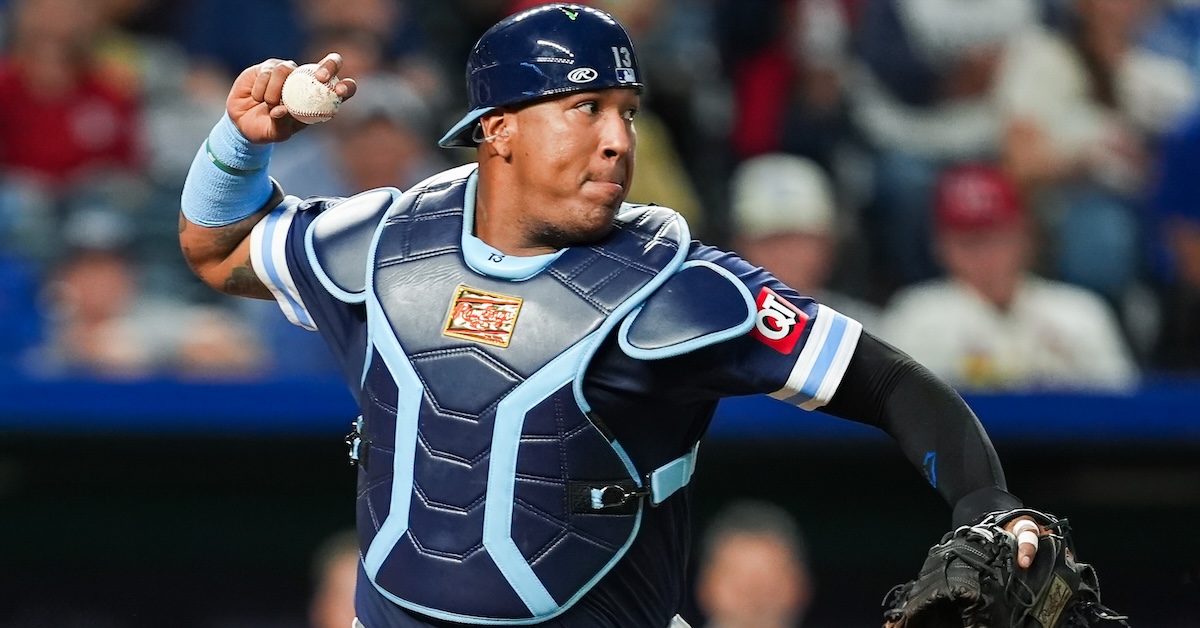
Carson Kelly Has Caught on With the Cubs

As one-half of the majors’ most productive catching tandem, Carson Kelly doesn’t have enough plate appearances to qualify for the batting title, but like the Dodgers’ Will Smith, he’s been incredibly productive so far, particularly with runners in scoring position. Unlike Smith, he doesn’t have a lengthy track record of success; in parts of 10 major league seasons with five teams, Kelly has not only never made an All-Star team, he’s only played 100 games in a season twice, and finished with a 100 wRC+ or better just twice. But thanks to some changes to his swing mechanics over the past couple of seasons, he’s in the midst of a breakout campaign for the NL Central-leading Cubs.
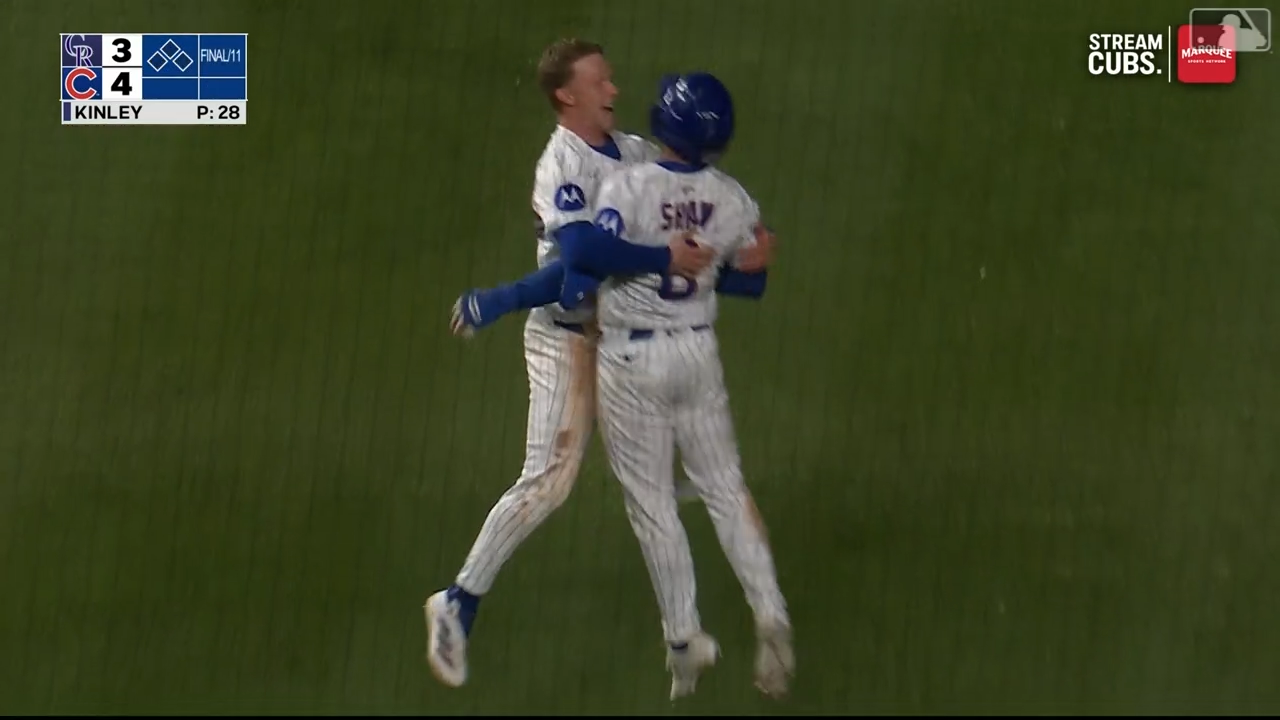
The 30-year-old Kelly is hitting .290/.412/.589 with nine homers and a 179 wRC+ in 131 plate appearances. He’s started 28 of the Cubs’ 56 games behind the plate, while Miguel Amaya started 25 before landing on the injured list this past weekend due to an oblique strain, an injury that interrupted a promising start to the 26-year-old backstop’s season. Though Kelly homered after replacing Amaya in Saturday’s loss to the Reds, he was limited to a single late-inning cameo over the next three days due to an unspecified illness before returning to the lineup on Wednesday night. Instead of recalling 21-year-old prospect Moisés Ballesteros, who spent five games DHing for the Cubs earlier this month but whose defense needs more refinement, the Cubs brought up Reese McGuire from Triple-A Iowa to replace Amaya on the roster; he started all three games while Kelly was ailing, homering twice in his season debut against the Reds. All told, the trio of Cubs catchers has been great offensively:
| Player | G | PA | HR | BB% | K% | AVG | OBP | SLG | wRC+ | WAR |
|---|---|---|---|---|---|---|---|---|---|---|
| Carson Kelly | 30 | 120 | 9 | 15.0% | 13.3% | .310 | .417 | .630 | 190 | 1.7 |
| Miguel Amaya | 26 | 96 | 3 | 4.2% | 22.9% | .267 | .295 | .467 | 111 | 0.7 |
| Reese McGuire | 3 | 11 | 2 | 0.0% | 27.3% | .200 | .200 | .800 | 171 | 0.3 |
| Totals | 56 | 227 | 14 | 9.7% | 18.1% | .285 | .356 | .565 | 155 | 2.7 |