The Rangers Rotation Has Been Great, but Things Are Gettin’ Weird
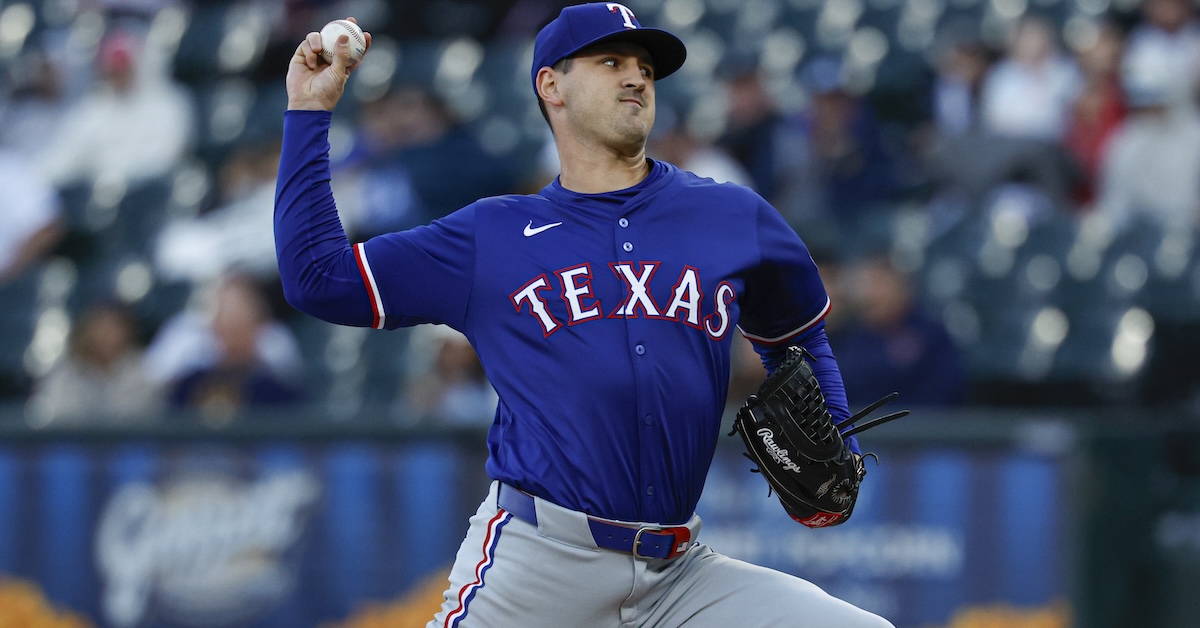
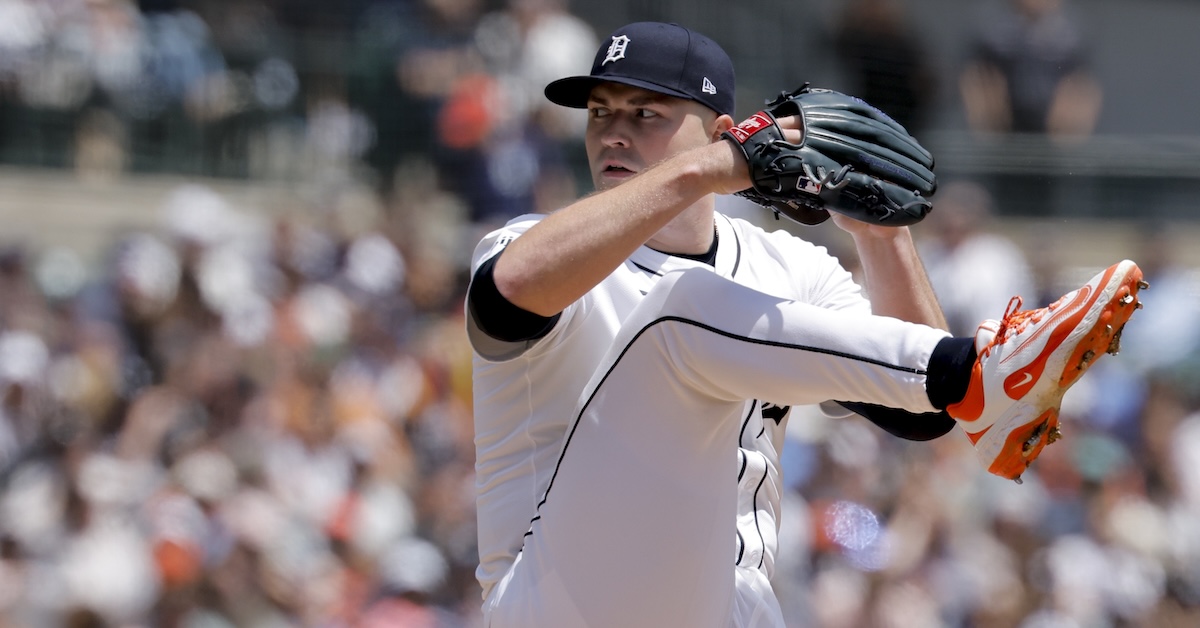
Way, way, way back in December 2023, the Rangers signed Tyler Mahle to a two-year contract. Absolutely nobody cared at the time, mostly because the news dropped the same day as Shohei Ohtani’s first press conference with the Dodgers. But also because Mahle, then recovering from Tommy John surgery, was expected to play a trivial part, at best, in the 2024 season.
Mahle had been a bit of a hipster favorite as an upper-mid-rotation starter in Cincinnati and then briefly in Minnesota — far from a household name, but from 2020 to 2022, he’d been quite good, and in high volume. Over those three seasons, he’d averaged 27 starts, 146 innings, and 3.0 WAR per 162 team games, with an ERA- of 90. For two years and $22 million, the Rangers were conceding that he’d rehab on their dime for most of 2024. But he would’ve been available for the 2024 playoffs if they’d made it that far, and if everything worked according to plan, they’d have a workhorse no. 3 starter under contract for 2025 at a fraction of what that kind of production usually goes for.
At least in 2025, everything has been working according to plan. Mahle has made 11 starts so far this season, with the past 10 lasting at least 80 pitches and five innings. Until his most recent outing, he hadn’t allowed more than two runs in any start. Even then, he allowed only three runs in his season-worst outlier. His 1.80 ERA is fifth best among all qualified starters. Read the rest of this entry »