Frank Bowen IV/The Enquirer/USA TODAY NETWORK via Imagn Images
Below is an analysis of the prospects in the farm system of the Cincinnati Reds. Scouting reports were compiled with information provided by industry sources as well as my own observations. This is the fifth year we’re delineating between two anticipated relief roles, the abbreviations for which you’ll see in the “position” column below: MIRP for multi-inning relief pitchers, and SIRP for single-inning relief pitchers. The ETAs listed generally correspond to the year a player has to be added to the 40-man roster to avoid being made eligible for the Rule 5 draft. Manual adjustments are made where they seem appropriate, but we use that as a rule of thumb.
A quick overview of what FV (Future Value) means can be found here. A much deeper overview can be found here.
All of the ranked prospects below also appear on The Board, a resource the site offers featuring sortable scouting information for every organization. It has more details (and updated TrackMan data from various sources) than this article and integrates every team’s list so readers can compare prospects across farm systems. It can be found here. Read the rest of this entry »
Ben Lindbergh and Meg Rowley banter about the unexpected power of Meg’s Mariners (and Jorge Polanco, specifically), in contrast to the Rangers’ unexpectedly light-hitting lineup. They also discuss a Jackson Chourio comment about Julio Rodríguez, the long-awaited comeback of Lance McCullers Jr. and the thus-far-deflating comeback of Sandy Alcantara, the literally diminished Mookie Betts, Jose Altuve’s self-knowledge, a Rockies theory, and the existence of Maverick Handley. Then (38:11) Meg gives Ben some alone time with Tigers reliever John Brebbia, who talks about iPhones vs. Androids, social media, the prospect of becoming Ben’s friend, indy ball, beards, spreadsheets, pitching for the 2024 White Sox, going from worst-to-first in the AL Central, being the new guy in a tightly bonded bullpen, pitch-calling, adapting, Brebbia’s alma mater as a pitching powerhouse, whether baseball players (other than Brebbia) are funny, his post-playing future, a potential new nickname, and more, plus a postscript (1:49:21).
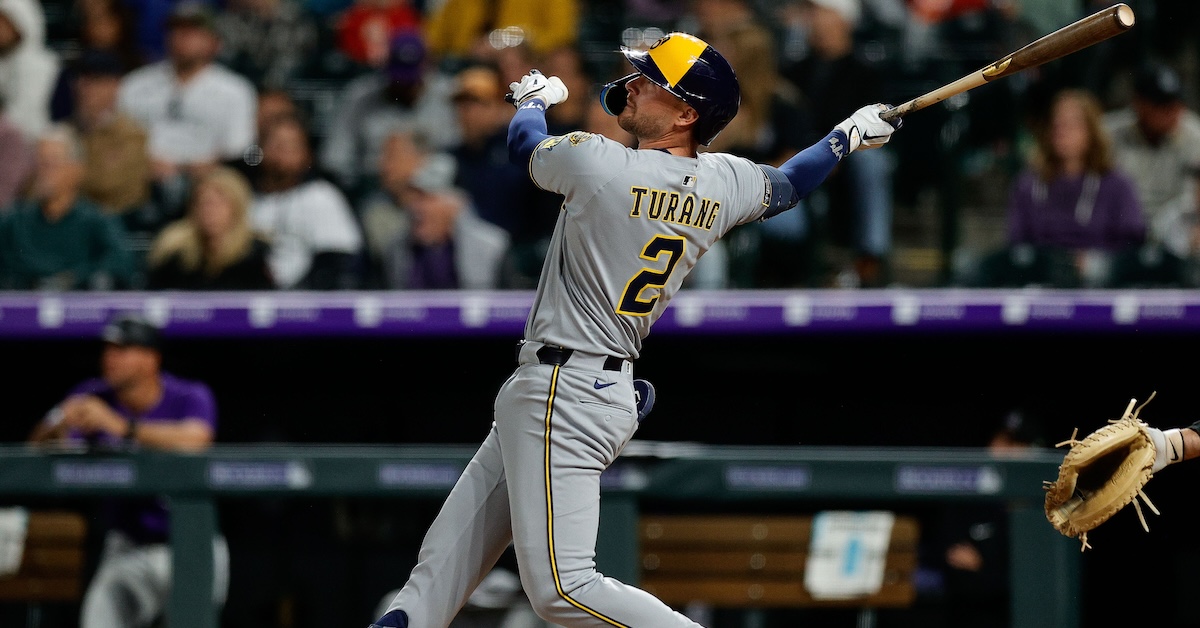
I like to analyze what’s happening with individual batters as a way to have a broader discussion about hitting. The story I wrote about Oneil Cruz back in January also covered how unusual it is for long-limbed hitters to crush high pitches. Digging into Brent Rooker’s excellent 2024 campaign in December offered me an opportunity to look at how batters can make subtle adjustments to command the top of the zone. And today’s piece on Brewers second baseman Brice Turang doubles as a primer on the best way to make bat speed gains.
It’s almost always a good thing for hitters to increase their bat speed. That sounds obvious, right? If you swing faster, you can hit the ball harder, get to more pitches, and have more time to react. No arguments there.
But when training to increase your bat speed, you don’t just swing some weighted bats around and magically become a better hitter. Your goal should be to swing faster while preserving the strengths of your swing. Sometimes higher-effort hacks can have unintended consequences, so hitters and their coaches need to pay attention to how individual swing components interact with all the others. For Turang specifically, this meant he had to figure out how to swing harder while maintaining his elite contact skills, which come from his bat angle variability and short stroke. With bat speed, intercept, and swing length data now in the public sphere, we can better understand how Turang is doing this. But first, let’s take a look at how much better Turang has been this season than he was in 2024:
Brice Turang’s Progression
Season
xwOBA
xwOBACON
Sweet-Spot%
Barrel%
Hard-Hit%
2024
.297
.322
32.0
2.4
29.7
2025
.364
.426
36.2
9.6
48.9
SOURCE: Baseball Savant
Yes, somehow, this is the same hitter. Turang’s Barrel% has jumped from the third percentile to the 56th, while his Hard-Hit% surged from the ninth percentile to the 80th. That’s ridiculous. Turang was essentially a bottom-decile guy across the board when it came to contact quality. Now, he’s well above average, and he’s improved without compromising the other parts of his game, which I’ll get into later. He’s also increased his power ceiling, with his max exit velocity climbing from the 33rd to the 64th percentile.
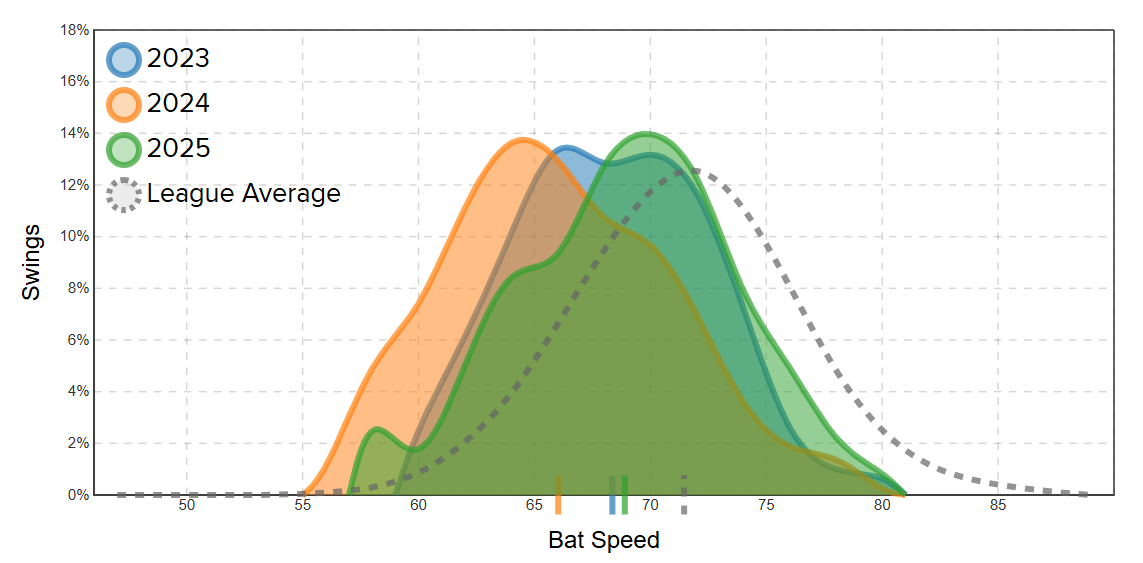
All these improvements are due to the fact that Turang is swinging significantly faster. No qualified hitter has increased his average bat speed more than the 2.8 mph that Turang has added, from 66.2 mph last year to 69.0 mph in 2025. That’s important when you consider that last year batters posted a .164 xwOBA on swings below 66 mph. Looking at how the distribution of Turang’s swing speeds has changed further demonstrates why it was especially crucial for him to take harder hacks:
This visualization specifically focuses on swings when Turang made contact. In 2024, about a tenth of his swings were at or below 60 mph, and those swings yielded a .165 xwOBA. Now, nearly all of his swings have a speed above that threshold. He has raised his floor a ton by minimizing how often he swings that slowly. The midpoint of his swing speed distribution has shifted beyond 70 mph – more often than not he’s giving himself a chance to do real damage, and that just wasn’t the case in the past.
Going back to what I mentioned earlier, Turang has kept other components of his swing almost exactly the same even as he’s made these gains. His point of contact relative to his body is the same. Last year, his intercept point (which also includes swings without contact) was 31 inches versus his center of mass. This year, that’s shifted, but barely, 30.6. This is fantastic. To understand why, I need to get a little nerdy and bring in some more context. There are ways to cheat bat speed gains that can actually be detrimental to a hitter. Yes, I know that’s a bit contrary to my previous point, however, it can be true! If a hitter does everything the same and shifts his point of contact further out in front of his body (even if that creates suboptimal contact) his bat speed will increase!
It comes down to physics. One component of measuring bat speed is the distance from the bat’s knob (assuming that is the reference point) to the point of impact. If that radius increases, so will your bat speed, though obviously there is a limit here. That means that you can keep your angular speed (how quickly the bat rotates) the same while lengthening your radius to increase your bat speed. There is a sweet spot for that radius increase to be beneficial. If you exceed it, you’ll start to yank all your solid contact foul, and if you want to keep the ball fair, you’ll have to alter your bat angles, which leads to suboptimal contact. Like with every part of baseball, balance is needed.
Based on this calculation of bat speed, we can deduce that Turang is creating more angular speed in order to increase his overall bat speed without changing his average intercept point much. Very good! Along with that, Turang’s swing length is still elite (90th percentile this year compared to 100th last year), and he is now standing more toward the back of the box. The former means his swing is still short and sweet, and the latter adjustment might mean that when he does shift his point of contact farther out in front, he has more wiggle room to keep the ball fair. All this combined leads to the type of improvements we’ve seen so far.
Lastly, I’ll leave with you some video highlighting how Turang has drastically changed his setup compared to last year, which likely is one of the main factors driving his bat speed gains:
2024
2025
He stands more narrow with his hands higher and begins his load with a big leg kick. This has helped him swing the bat faster on average by cutting down on his slower, non-A swings while also maintaining his previous point of contact. For many hitters, the leg kick is a timing mechanism and not just a way to set up their rotation. I think this is the case for Turang. And to make sure this change wouldn’t leave him off balance, he has paired it with higher hands to keep his upper and lower halves connected. Really good process decisions here.
Turang has always been a great baserunner and an excellent fielder, but because of the gains he made during the offseason, he has elevated both his ceiling and his floor. And as a result, he is now emerging as a valuable everyday player for Milwaukee.
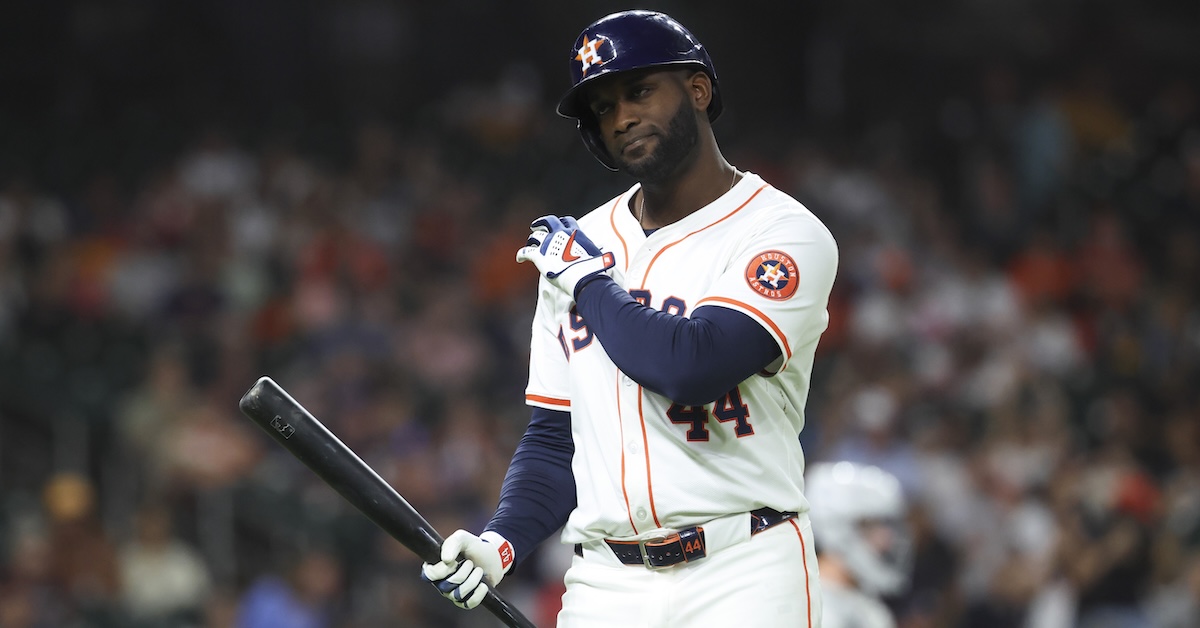
Yordan Alvarez is one of the best hitters on the planet. From 2021-24, only Aaron Judge produced a higher wRC+ than Alvarez’s 165, and only five players surpassed his total of 136 home runs. During that time, the slugger helped the Astros to two pennants and a championship, furthering his legend with some dramatic postseason homers as well. Yet so far in 2025, Alvarez has struggled mightily. In fact, he closed April with a WAR below zero (-0.1) after posting 5.3 WAR last season.
Through 28 games, Alvarez is hitting .219/.316/.354, well shy of last year’s typically stellar .308/.392/.567. In fact, his 81-point drop in wRC+ is the fourth largest among players who took 300 plate appearances last year and have made at least 80 this season:
Minimum 300 plate appearances in 2024 and 80 through April 30, 2025.
So what’s going on with Alvarez? He’s actually hitting the ball harder than he did last year or the year before, at least if we’re measuring only by average exit velocity — which isn’t a great way to go:
You Buying…: Wilyer Abreu’s start? His k-rate is a smooch above where you’d probably like it to be but the underlying metrics seem to really support this breakout. ZiPS was already the most bullish projection system on him and hopefully that continues, for my fantasy team’s sake.
12:02
dylan: Wilyer Abreu is having an MVP caliber season and it isn’t close!!!!!
12:02
Dan Szymborski: He has an above-average contact rate!
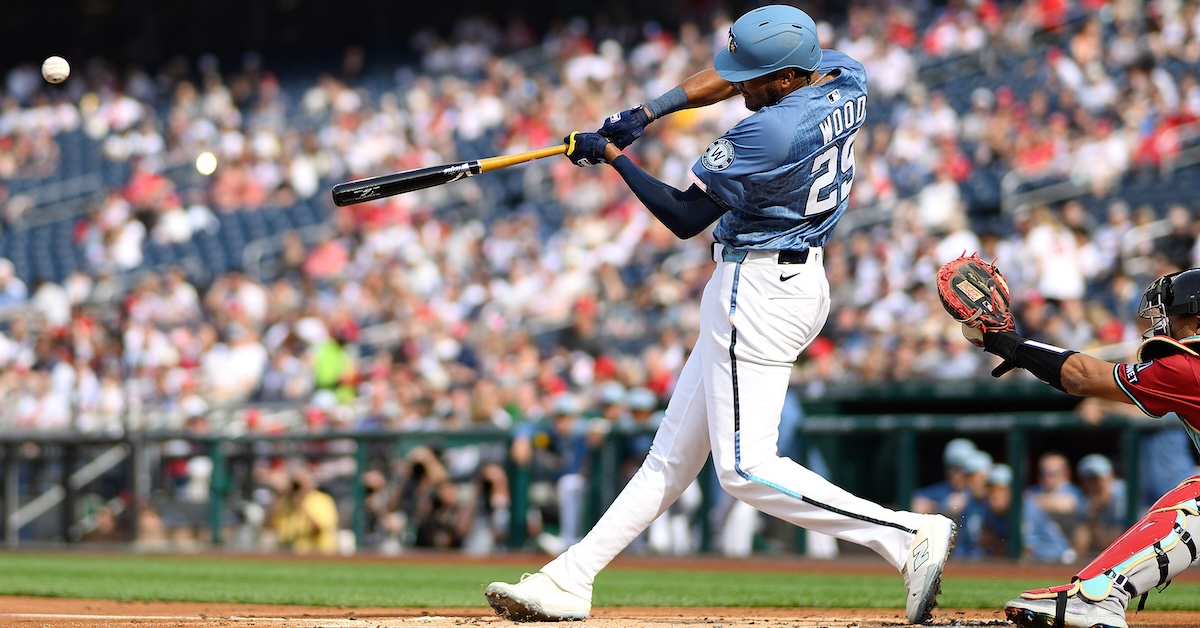
It can be difficult to contextualize just how unusual James Wood’s offensive profile really is. He hits the ball so very hard. He hits the ball in the air so very never. In his major league debut last season, the Nationals outfielder put 198 balls into play. Only five of them were fly balls to the pull side. Of the 403 batters who put at least 100 balls in play last season, that 2.5% rate put Wood in 385th place. As for those five pulled fly balls, they turned into two home runs, two doubles, and one very loud flyout.
That seems like a promising avenue for further investigation, doesn’t it? The kind of batted ball that turns into an extra-base hit at roughly the same rate that dentists recommend, you know, brushing? If Wood could figure out how to pull the ball in the air with any sort of regularity, he’d be one of the game’s great sluggers. And yet here we are a month into the season: Wood has not at all figured that out, and somehow he’s one of the game’s great sluggers anyway. He’s running a 153 wRC+ and a top-10 isolated slugging percentage because his prodigious power allows him to get the absolute most out of one of the least optimized profiles in the game. Read the rest of this entry »
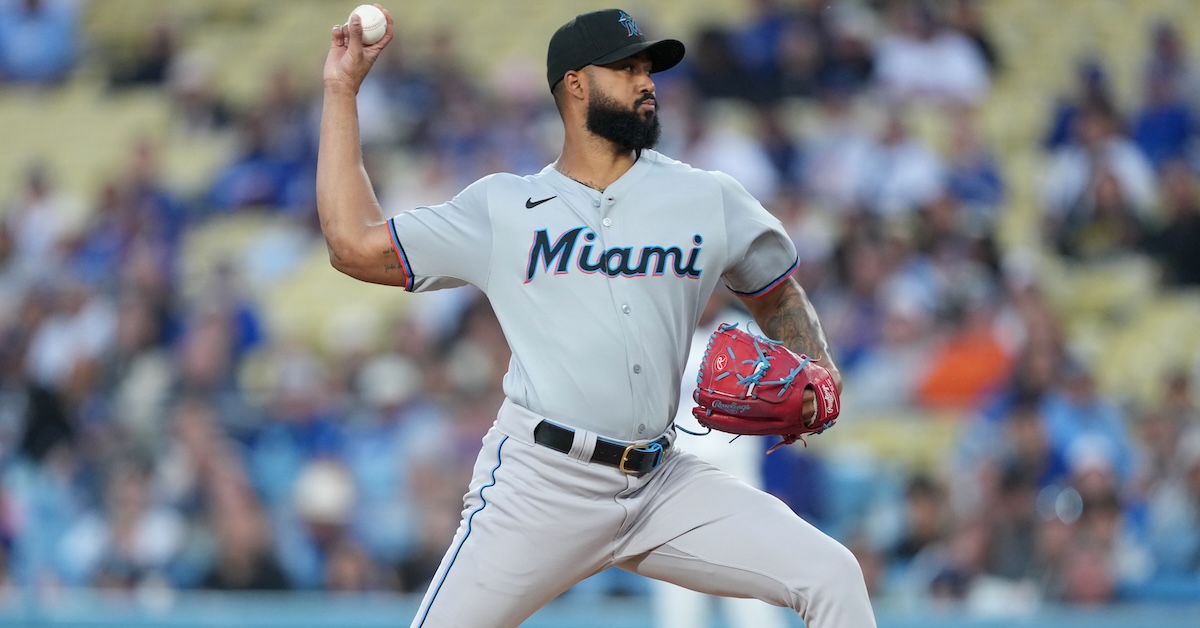
Sandy Alcantara was supposed to be the last bastion of the traditional starting pitcher, the guy who pumps gas seven innings a start come hell or high water. The stoic, hirsute antidote to the effete, three-ply soft five-and-dive starter of today. In his 2022 Cy Young campaign, Alcantara threw more innings than any other National League pitcher since 2015, and he did it while throwing harder than any other starter in the league that year. Oh yeah, man, that’s the stuff.
A mildly disappointing 2023 ended in a torn UCL, which prevented Alcantara from participating in a rare Marlins postseason appearance. But he’s back now, ready to remind the world what 220 innings a year looks like.
Through six starts, the Miami ace has an ERA of 8.31. His strikeout rate is down to 15.8%, which is about two-thirds of what it was at his peak, and his walk rate is 14.2%, which is so bad you don’t need context to appreciate it.
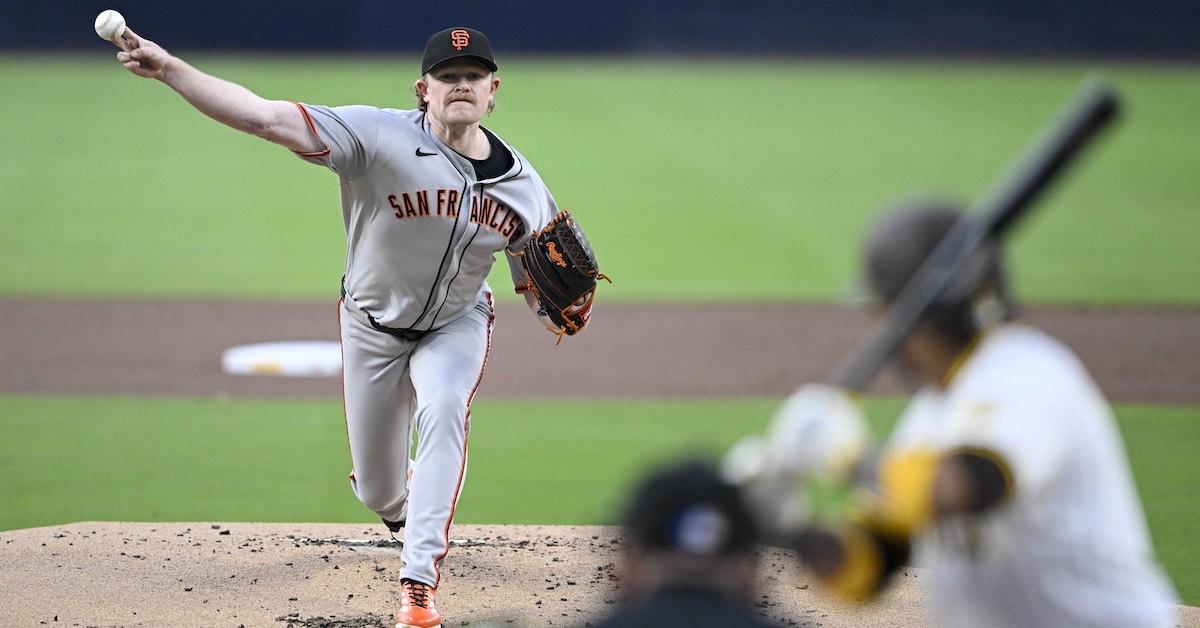
Every winter, pitchers step off the mound and into the lab. Sure, not every pitcher is in a wind tunnel with a high speed camera from October to January, but enough are that everyone seems to reap the benefits. You’ve got the sweeper, the kick change, the rise of the splitter, new fastball shapes – you name it, someone has tried it recently. That means that every year, I spend the first month or two of the season catching up to the new hot thing going on in the world of pitching.
But I have to level with you: On the whole, things haven’t changed as much this year as I expected. That won’t stop me from walking through what has changed, though, and the first shift to highlight is a subtle one – we’re seeing more bendy sliders and fewer gyro offerings:
Slider Usage By Year
Year
Sweeper
Slider
2020
1.1%
16.8%
2021
1.9%
17.2%
2022
3.9%
16.9%
2023
5.6%
16.3%
2024
6.5%
15.5%
2025
7.6%
14.9%
Why? Two things are happening. First, sweeping sliders do better against same-handed batters, so pitchers are choosing that as their secondary of choice when they have the platoon advantage. In 2021, 2.6% of pitches that righties threw to righties were sweepers. In 2025, that number has ballooned to 10.7%; it’s 10.9% for lefties against lefties. Usage is less than half as high when opposite-handed batters are at the plate.
Meanwhile, “regular” sliders are on the decline when pitchers have the platoon advantage. That makes good sense – they’re just throwing sweepers instead. And when pitchers aren’t facing same-handed batters, neither slider is particularly great; pitchers are staying away from both, more or less. That means that the traditional, gyro-spin slider is declining in prevalence overall. Read the rest of this entry »
It’s not often that I take a pause from the prospect lists to write about individual call-ups, but we have three big league debuts on the docket for today, and I wanted to update readers on those pitchers, as well one other prospect-related bycatch that’s come up during the course of me working on the Reds, Guardians, and Brewers org lists.
First, let’s talk about the starting pitchers making their big league debuts today: Chase Petty of the Reds, AJ Blubaugh of the Astros, and Noah Cameron of the Royals. All of them have updated player profiles over on The Board.
Chase Petty, RHP, Cincinnati Reds (50 FV)
Petty, who touched 102 in high school, came to the Reds from Minnesota during the spring of 2022 in a trade for Sonny Gray. After missing time with an elbow issue in 2023, he had a healthy and complete 2024 season in which he worked 137 innings spent mostly at Double-A Chattanooga, many more frames than he had thrown in any year prior. Proving he could sustain big stuff across that load of innings was instrumental to his inclusion among the 2025 Top 100 Prospects. His fastball was still sitting 94-97 mph after Petty had been promoted to Louisville at the very end of last season, and he has carried that into 2025. As of his call-up, he has 27 strikeouts, nine walks, and a 1.30 WHIP in 23 innings (five starts). Read the rest of this entry »
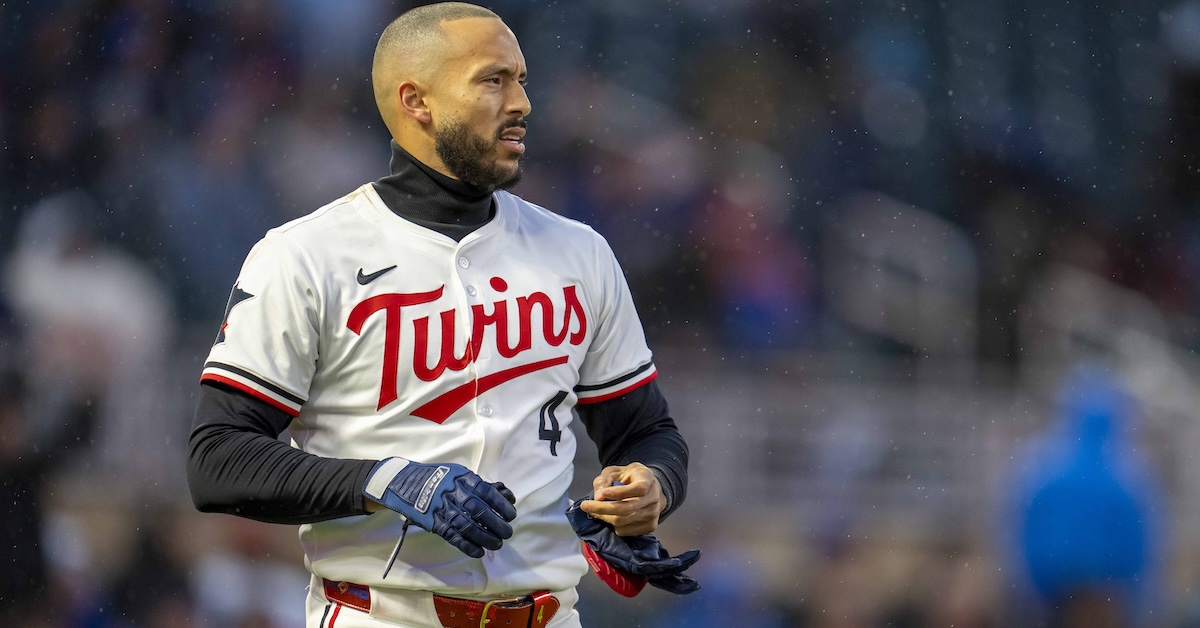
Carlos Correa has grounded into six double plays this season. He doesn’t lead the league; that would be Junior Caminero, who has already racked up nine, putting him on pace for an even 50 by the end of the year. If Caminero keeps that up (he won’t), he would shatter the single-season record of 36, set by Jim Rice in 1984. Still, it’s Correa whose GIDP numbers I find most intriguing.
Correa has always been prone to double plays. Since the day of his debut, 10 years ago in June, only five major leaguers have grounded into more of them. However, in 2023, Correa took things to a new level. He set a single-season Twins record by grounding into 30 double plays. He did so in just 130 games and 580 trips to the plate. His 30 GIDPs were the most by any player in a season since Casey McGehee in 2014 (31) and the most on a per-PA basis (min. 500 PA) since A.J. Pierzynski in 2004 (27 GIDPs in 510 PA). Adjusted for era, Correa’s GIDPs-per-PA rate registered as the third highest of all time:
Complete AL/NL records date back to 1939. Pitchers excluded.
Correa’s historically pitiful GIDP performance in 2023 made what he did next all the more fascinating. In 2024, he produced an equally historical turnaround season. He hit just five groundball double plays, 25 fewer than the year before. Admittedly, he played significantly fewer games, but even on a rate basis, the difference was astounding. Never in his career had he grounded into two-outers at a lower clip. (Quick aside: Writers need synonyms, and if they don’t exist, it’s our job to make them up. Get ready.) Read the rest of this entry »