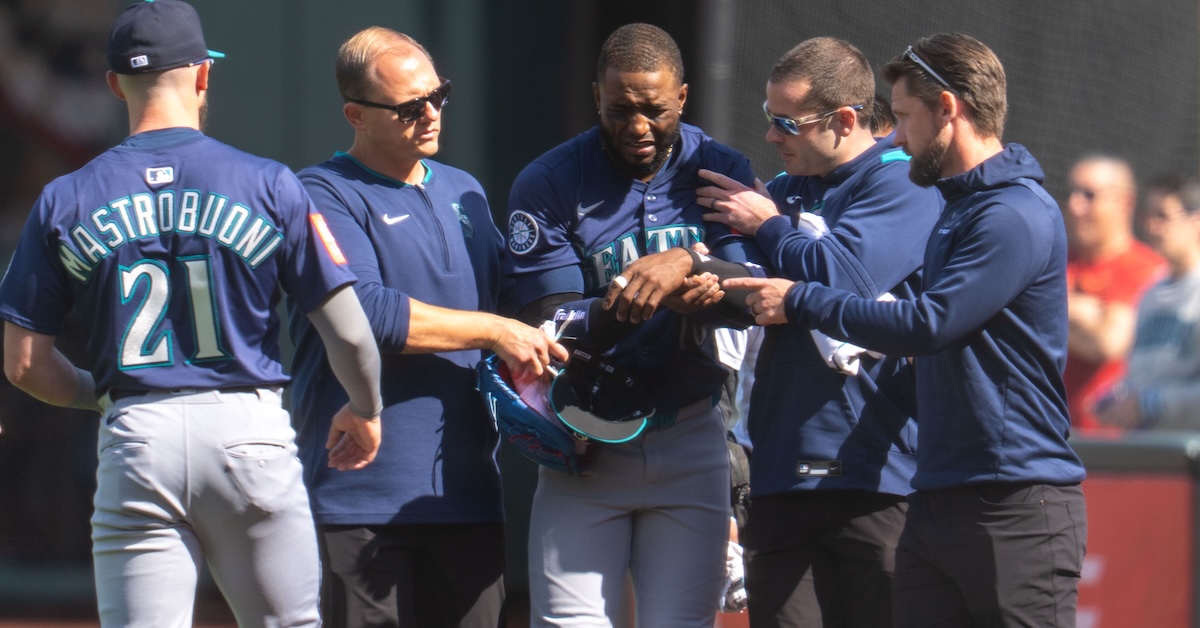
You lose some, and then you lose some. On Sunday at Oracle Park, the Mariners not only fell to the Giants 5-4, but they were forced to remove Victor Robles from the game after he injured his left shoulder making a remarkable catch on the game’s penultimate pitch. His injury is just one of a handful of notable ones suffered in the past several days.
Robles, who broke out last season after being released by the Nationals and signed by the Mariners, had played every inning of every game in right field until the injury. With the score tied 4-4 in the bottom of the ninth, one out, and Luis Matos on first base, Patrick Bailey fouled a drive into the right field corner. Robles sprinted 113 feet, leapt to grab the ball, and then fell over the half-height padded fence and into the netting. After extricating himself, he fell to his knees in obvious pain, rolled the ball to second baseman Ryan Bliss as Matos tagged up and reached third base, and remained on the ground. While he was tended to by Mariners head athletic trainer Kyle Torgerson, Giants manager Bob Melvin challenged the catch ruling, but the call on the field was upheld [as a reader pointed out, Matos was sent back to second under stadium boundary rules]. Finally, Robles was carted off the field, with Torgerson helping him to support his injured left arm.
Miles Mastrobuoni moved from third base to right field to replace Robles, but he didn’t need to for very long, because on the next pitch after play resumed, Wilmer Flores singled in Matos to send the Mariners to defeat, dropping them to 3-7. Medical personnel at Oracle Park popped Robles’ shoulder back into place, and after undergoing X-rays on-site, he was initially diagnosed with a dislocated left shoulder and placed on the 10-day injured list. The results of the follow-up MRI he underwent on Monday afternoon have yet to be announced.Read the rest of this entry »
Jay Jaffe: Good afternoon, folks! Welcome to the latest edition of my weekly chat. I’m having some technical difficulties and need to restart my browser, so please give me a few minutes before we get up and running.
12:06
Jay Jaffe: Ok, that’s better.
12:08
Jay Jaffe: Since it’s April 8, I’ll note a pair of important milestones: today marks the 51st anniversary of Hank Aaron’s 715th home run, and the 50th anniversary of Frank Robinson making his debut as the first Black manager in AL/NL history.
Jay Jaffe: Today I’ve got a piece on Victor Robles’ spectacular catch and subsequent shoulder injury as well as some other injuries of note: Spencer Arrighetti, Iván Herrera, Ketel Marte and Blake Snell. Should be up before this chat ends
12:10
cubs fan: I liked your article about Kyle Tucker’s market price last week, but I’m curious what you’d think he’d get if (like he is so far doing, although April obviously) he matches that superhuman 8-WAR pace from last season rather than the ZIPS projections or the previous career norm (and stays healthy)
The regular season has gotten underway and we’ve already seen a few teams get off to some surprising starts. The NL West looks like it’s shaping up to be the most competitive division in baseball. Meanwhile, the Braves inspired Michael Baumann to reference Biblical plagues in the headline of his piece on their woeful first week.
Last year, we revamped our power rankings using a modified Elo rating system. If you’re familiar with chess rankings or FiveThirtyEight’s defunct sports section, you’ll know that Elo is an elegant solution that measures teams’ relative strength and is very reactive to recent performance. To avoid overweighting recent results during the season, we weigh each team’s raw Elo rank using our coin flip playoff odds (specifically, we regress the playoff odds by 50% and weigh those against the raw Elo ranking, increasing in weight as the season progresses to a maximum of 25%). The weighted Elo ranks are then displayed as “Power Score” in the tables below. As the best and worst teams sort themselves out throughout the season, they’ll filter to the top and bottom of the rankings, while the exercise will remain reactive to hot streaks or cold snaps.
First up are the full rankings, presented in a sortable table. Below that, I’ve grouped the teams into tiers with comments on a handful of clubs. You’ll notice that the official ordinal rankings don’t always match the tiers — there are times where I take editorial liberties when grouping teams together — but generally, the ordering is consistent. One thing to note: The playoff odds listed in the tables below are our standard Depth Charts odds, not the coin flip odds that are used in the ranking formula. Read the rest of this entry »
As FanGraphs’ payroll and baseball economics czar, I expend a frightening amount of my brainpower thinking about team spending. I’m constantly trying to figure out how much money teams have spent and how much they will spend in the future. Since that stuff is always floating around in my head anyway, I thought it’d be a good idea to do something with all that information. Today, we’ll cover the payrolls for all 30 teams in 2025 and over the next three years.
Let’s start with the payrolls for this season, both real-dollar and luxury tax (CBT) amounts. There are a lot of small nuances that determine how the two numbers are calculated and why they are different, so I won’t get into the nitty gritty here. However, I am going to briefly point out some of the key discrepancies that you should know before we get to the data.
The real-dollar payroll uses the actual money paid out for each year of the contract, plus the prorated portion of the contract’s signing bonus, if it has one. On the RosterResource payroll pages, this is the number shown in the player’s column for each year.
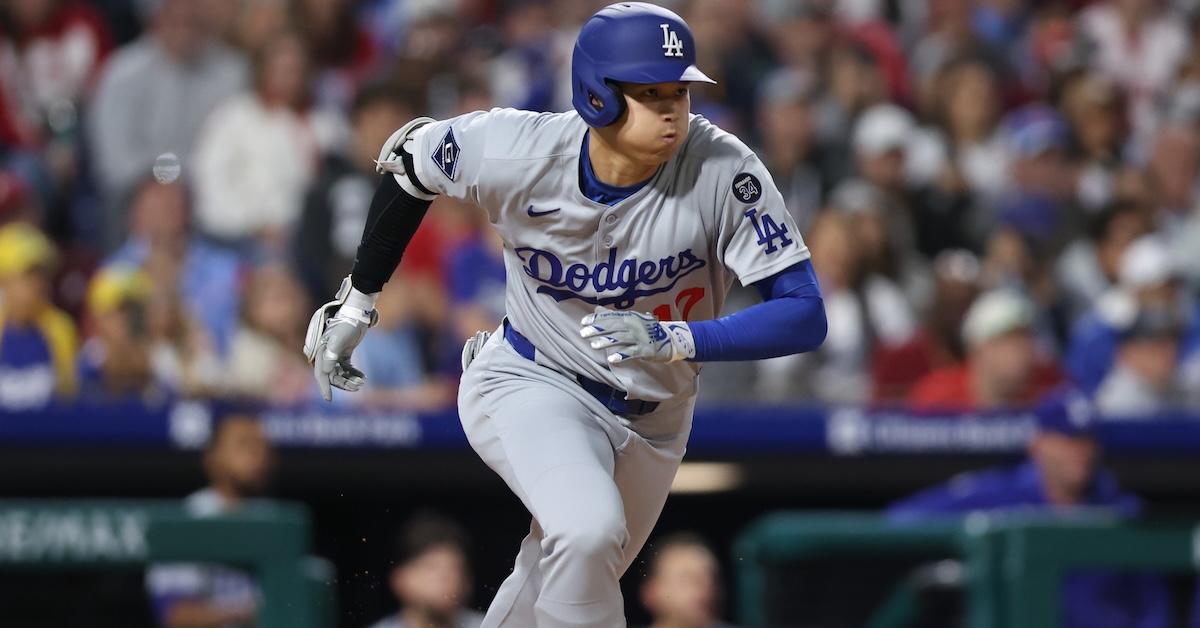
Please note that for contracts with significant deferrals, the league’s Labor Relations Department (LRD) will recalculate their value to a significantly lower number than what is displayed on the RosterResource pages to account for the discounted rate. For each year, we show the money that ultimately will be paid out to each player. So, for example, RosterResource lists Shohei Ohtani’s real-dollar payroll value for 2025 as $70 million, even though his 10-year, $700 million contract is heavily deferred.
The CBT payrolls shown on RosterResource, and in the AAV column for each player, do accurately reflect how the league discounts contracts. I wrote more about Ohtani’s deal in particular here. Ken Rosenthal wrote more about the nuances of Ohtani’s contract’s three values ($700 million, about $460 million, and about $280 million) here; RosterResource only accounts for the first two values, while the league’s LRD calculation reflects the third.
CBT payrolls include ancillary expenses that the real-dollar payrolls don’t, including player benefits (estimated at $17.5 million this year), payment into the $50 million pre-arbitration bonus pool ($1,666,667 per team), and minor league salaries for 40-man roster players (estimated at $2.5 million per team).
Ultimately, CBT payrolls will correlate strongly to real-money payrolls, since many contracts are evenly distributed anyway, so they’ll count the same for each season by both calculations.
OK, now that we’ve got that out of the way, here are the top-line payroll numbers for the 2025 season:
2025 Payrolls
Team
2025 LRD Payroll (Millions)
Rank
2025 CBT Payroll (Millions)
Rank
LAD
$390.1
1
$391.3
1
NYM
$332.0
2
$325.7
2
PHI
$288.9
3
$308.0
3
NYY
$287.8
4
$307.7
4
TOR
$251.3
5
$274.6
5
TEX
$223.4
6
$236.4
9
HOU
$219.1
7
$237.8
8
SDP
$211.4
8
$263.2
6
BOS
$211.2
9
$248.8
7
ATL
$208.3
10
$225.4
10
LAA
$203.2
11
$220.5
12
CHC
$196.2
12
$216.2
14
ARI
$194.7
13
$222.6
11
SFG
$177.0
14
$218.3
13
BAL
$165.2
15
$181.9
16
SEA
$152.3
16
$182.4
15
STL
$149.2
17
$164.8
18
MIN
$146.7
18
$156.9
20
DET
$144.7
19
$159.5
19
KCR
$133.1
20
$171.6
17
COL
$125.7
21
$146.4
21
MIL
$118.9
22
$139.8
22
WSN
$118.4
23
$138.7
23
CIN
$116.2
24
$138.0
24
CLE
$103.3
25
$131.2
25
TBR
$90.0
26
$120.0
26
PIT
$88.1
27
$112.6
28
CHW
$82.5
28
$89.7
29
ATH
$76.5
29
$115.3
27
MIA
$69.9
30
$86.8
30
The Dodgers may well end up as the first team in major league history to have a $400 million payroll; Clayton Kershaw should earn at least some of the $8.5 million available to him in incentives. On top of that, even though Los Angeles sure looks like a juggernaut right now, we should still expect president of baseball operations Andrew Friedman to make additions at the deadline that could increase payroll even more.
Flipping the chart on its head shows a couple of unsurprising bottom-dwellers in the A’s and Marlins. The A’s are successfully over the $105 million CBT threshold needed to avoid having the burden of proof placed upon them if the Players’ Association were to file a grievance against them related to how they allocate the revenue sharing dollars they receive. (Their real-dollar payroll is significantly lower because the contracts signed to get over that threshold are all backloaded.)
The Marlins, on the other hand, are evidently rolling the dice on being able to weather a potential grievance, with The Miami Heraldreporting that the club does “not believe [it is] at serious risk of losing a grievance in part because of the wording of the collective bargaining agreement.” In the event of a grievance, the Marlins would argue that they are using revenue sharing dollars “in an effort to improve performance on the field” (which is all that the CBA stipulates the money must be used for) because they’re spending on non-roster expenses like front office augmentation and player development fortifications. Helping their cause is the fact that grievances against the team from 2017 and 2018 are still pending; in the club’s eyes, this is a can that can be kicked quite far down the road.
And now, let’s take a look at how teams are distributing their budgets:
How the Money Is Allocated
Team
Guaranteed %
Arbitration %
Pre-Arbitration %
LAD
93.0%
5.8%
1.2%
NYM
91.7%
6.0%
2.4%
PHI
84.8%
12.2%
2.9%
NYY
86.1%
10.1%
3.8%
TOR
75.8%
20.5%
3.7%
TEX
88.7%
6.5%
4.9%
HOU
69.9%
23.7%
6.4%
SDP
77.0%
19.5%
3.5%
BOS
90.1%
5.0%
4.9%
ATL
92.2%
3.3%
4.5%
LAA
84.1%
9.6%
6.3%
CHC
81.0%
13.5%
5.5%
ARI
75.1%
20.9%
4.1%
SFG
76.6%
14.3%
9.1%
BAL
69.3%
25.9%
4.8%
SEA
69.6%
20.5%
9.9%
STL
76.1%
13.2%
10.7%
MIN
71.9%
20.6%
7.5%
DET
73.5%
18.5%
8.0%
KCR
78.6%
11.7%
9.7%
COL
78.8%
9.7%
11.5%
MIL
66.0%
21.6%
12.4%
WSN
56.0%
28.9%
15.1%
CIN
63.0%
26.5%
10.6%
CLE
67.6%
17.7%
14.8%
TBR
67.6%
13.1%
19.3%
PIT
69.2%
16.3%
14.6%
CHW
56.8%
20.9%
22.3%
ATH
68.6%
7.5%
23.9%
MIA
39.5%
21.4%
39.1%
Each team exists within its own context of what it’s trying to accomplish with its payroll, and having a higher or lower percentage within a given category doesn’t inherently mean anything good or bad. But it’s especially interesting to me to look at the middle column, or the percentage of real-dollar payroll allocated to arbitration-year players.
Since most of those players are between one and three years away from reaching free agency — along with the small group of Super Two players who have four years left — sorting from highest to lowest is a great way to answer the question: “Which teams have their rent coming due the soonest?” In other words, both Beltway teams have over a quarter of their payrolls hitting free agency within the next three years; will either of them make the effort to re-sign or extend key players like Cedric Mullins, Adley Rutschman, Nathaniel Lowe, and MacKenzie Gore? Those aren’t all extremely urgent decisions, but they’re much more at the forefront than, say, what becomes of Gunnar Henderson or Dylan Crews.
Speaking of the future, here’s what teams have allocated in payroll for the next three years:
Future Commitments
Team
2026 Commitments (Millions)
2027 Commitments (Millions)
2028 Commitments (Millions)
LAD
$298.9
$301.9
$228.1
NYM
$202.7
$171.6
$117.5
TOR
$182.4
$136.7
$109.8
BOS
$175.4
$162.1
$93.0
SDP
$166.7
$177.6
$144.7
PHI
$163.4
$127.9
$88.9
NYY
$163.2
$157.3
$145.3
ATL
$158.3
$127.0
$91.0
HOU
$137.9
$120.2
$58.8
TEX
$131.3
$119.5
$51.5
LAA
$128.9
$58.1
$37.1
SFG
$127.9
$115.6
$101.6
CHC
$123.3
$31.5
$27.0
ARI
$109.8
$101.7
$103.7
COL
$84.0
$51.2
$38.2
SEA
$76.1
$58.5
$44.9
STL
$75.0
$38.5
$5.0
MIN
$72.5
$68.7
$46.5
MIL
$59.6
$42.0
$36.3
KCR
$49.9
$43.3
$31.7
WSN
$49.4
$5.4
$7.4
ATH
$46.9
$20.2
$23.4
CLE
$42.3
$36.0
$36.0
PIT
$38.2
$40.7
$43.7
TBR
$34.8
$23.0
$25.5
DET
$28.8
$28.3
$5.3
CIN
$28.8
$23.6
$17.3
MIA
$25.8
$5.0
–
CHW
$20.6
$15.1
$0.0
BAL
$17.5
$16.5
–
Just so we’re all clear on what we’re looking at here: Future Commitments includes only guaranteed salaries from free agent contracts and extensions; we’re not including any projected earnings for pre-arbitration or arbitration-year players. Because of how our data is displayed on the payroll pages, single-year player options (highlighted in green on the payroll pages) are not included (like Pete Alonso), but opt outs for longer deals are (like Alex Bregman) factored into these figures. Essentially, we’re summing the white text on the payroll pages and ignoring any of the color-coded cells.
Even though the mechanism is the same in that the player still controls the cards, we create this line of demarcation (one year left on the deal is a player option, anything longer is an opt out) for a couple reasons. One is that the CBA itself makes that distinction, and the other is because it more closely matches how club, mutual, and vesting options work: They’re a single year 99% of the time. Opting out is a longer-term decision that’s also generally easier to make; if you’ve got multiple years left on your deal, you’d better be darn sure you can do better in free agency if you leave.
As I said before, each team is going to operate within its own budgetary constraints. The fact that the Diamondbacks already have $110 million on the books for 2026 may well make them more inflexible than the Dodgers or Mets this coming offseason, even though the Snakes have much less in the way of commitments.
Having more tied up in the future doesn’t mean that the team has less to do compared to teams with fewer dollars on the books, either. The Mets’ $202 million includes just eight players on guaranteed deals; they don’t have a particularly impactful arbitration class, and their only significant pre-arbitration player is Mark Vientos. They’ll have more to accomplish than the Red Sox, who are at $175 million, a total that includes Bregman. Excluding Bregman, Boston has nine players locked up, plus Tanner Houck and Jarren Duran, both key cogs, in arbitration.
Ultimately, my job is to compile all of the data, not necessarily to make sweeping declarations or draw any grand conclusions about payroll. I always caution that there’s a lot of nuance and team-specific context that often gets lost in more generalized comments, and the purpose of this summary isn’t to tell anyone how to think or feel about how teams are spending their money. That said, I’m looking forward to a spirited discussion in the comments section, and I’m happy to answer any team-specific questions you may have.
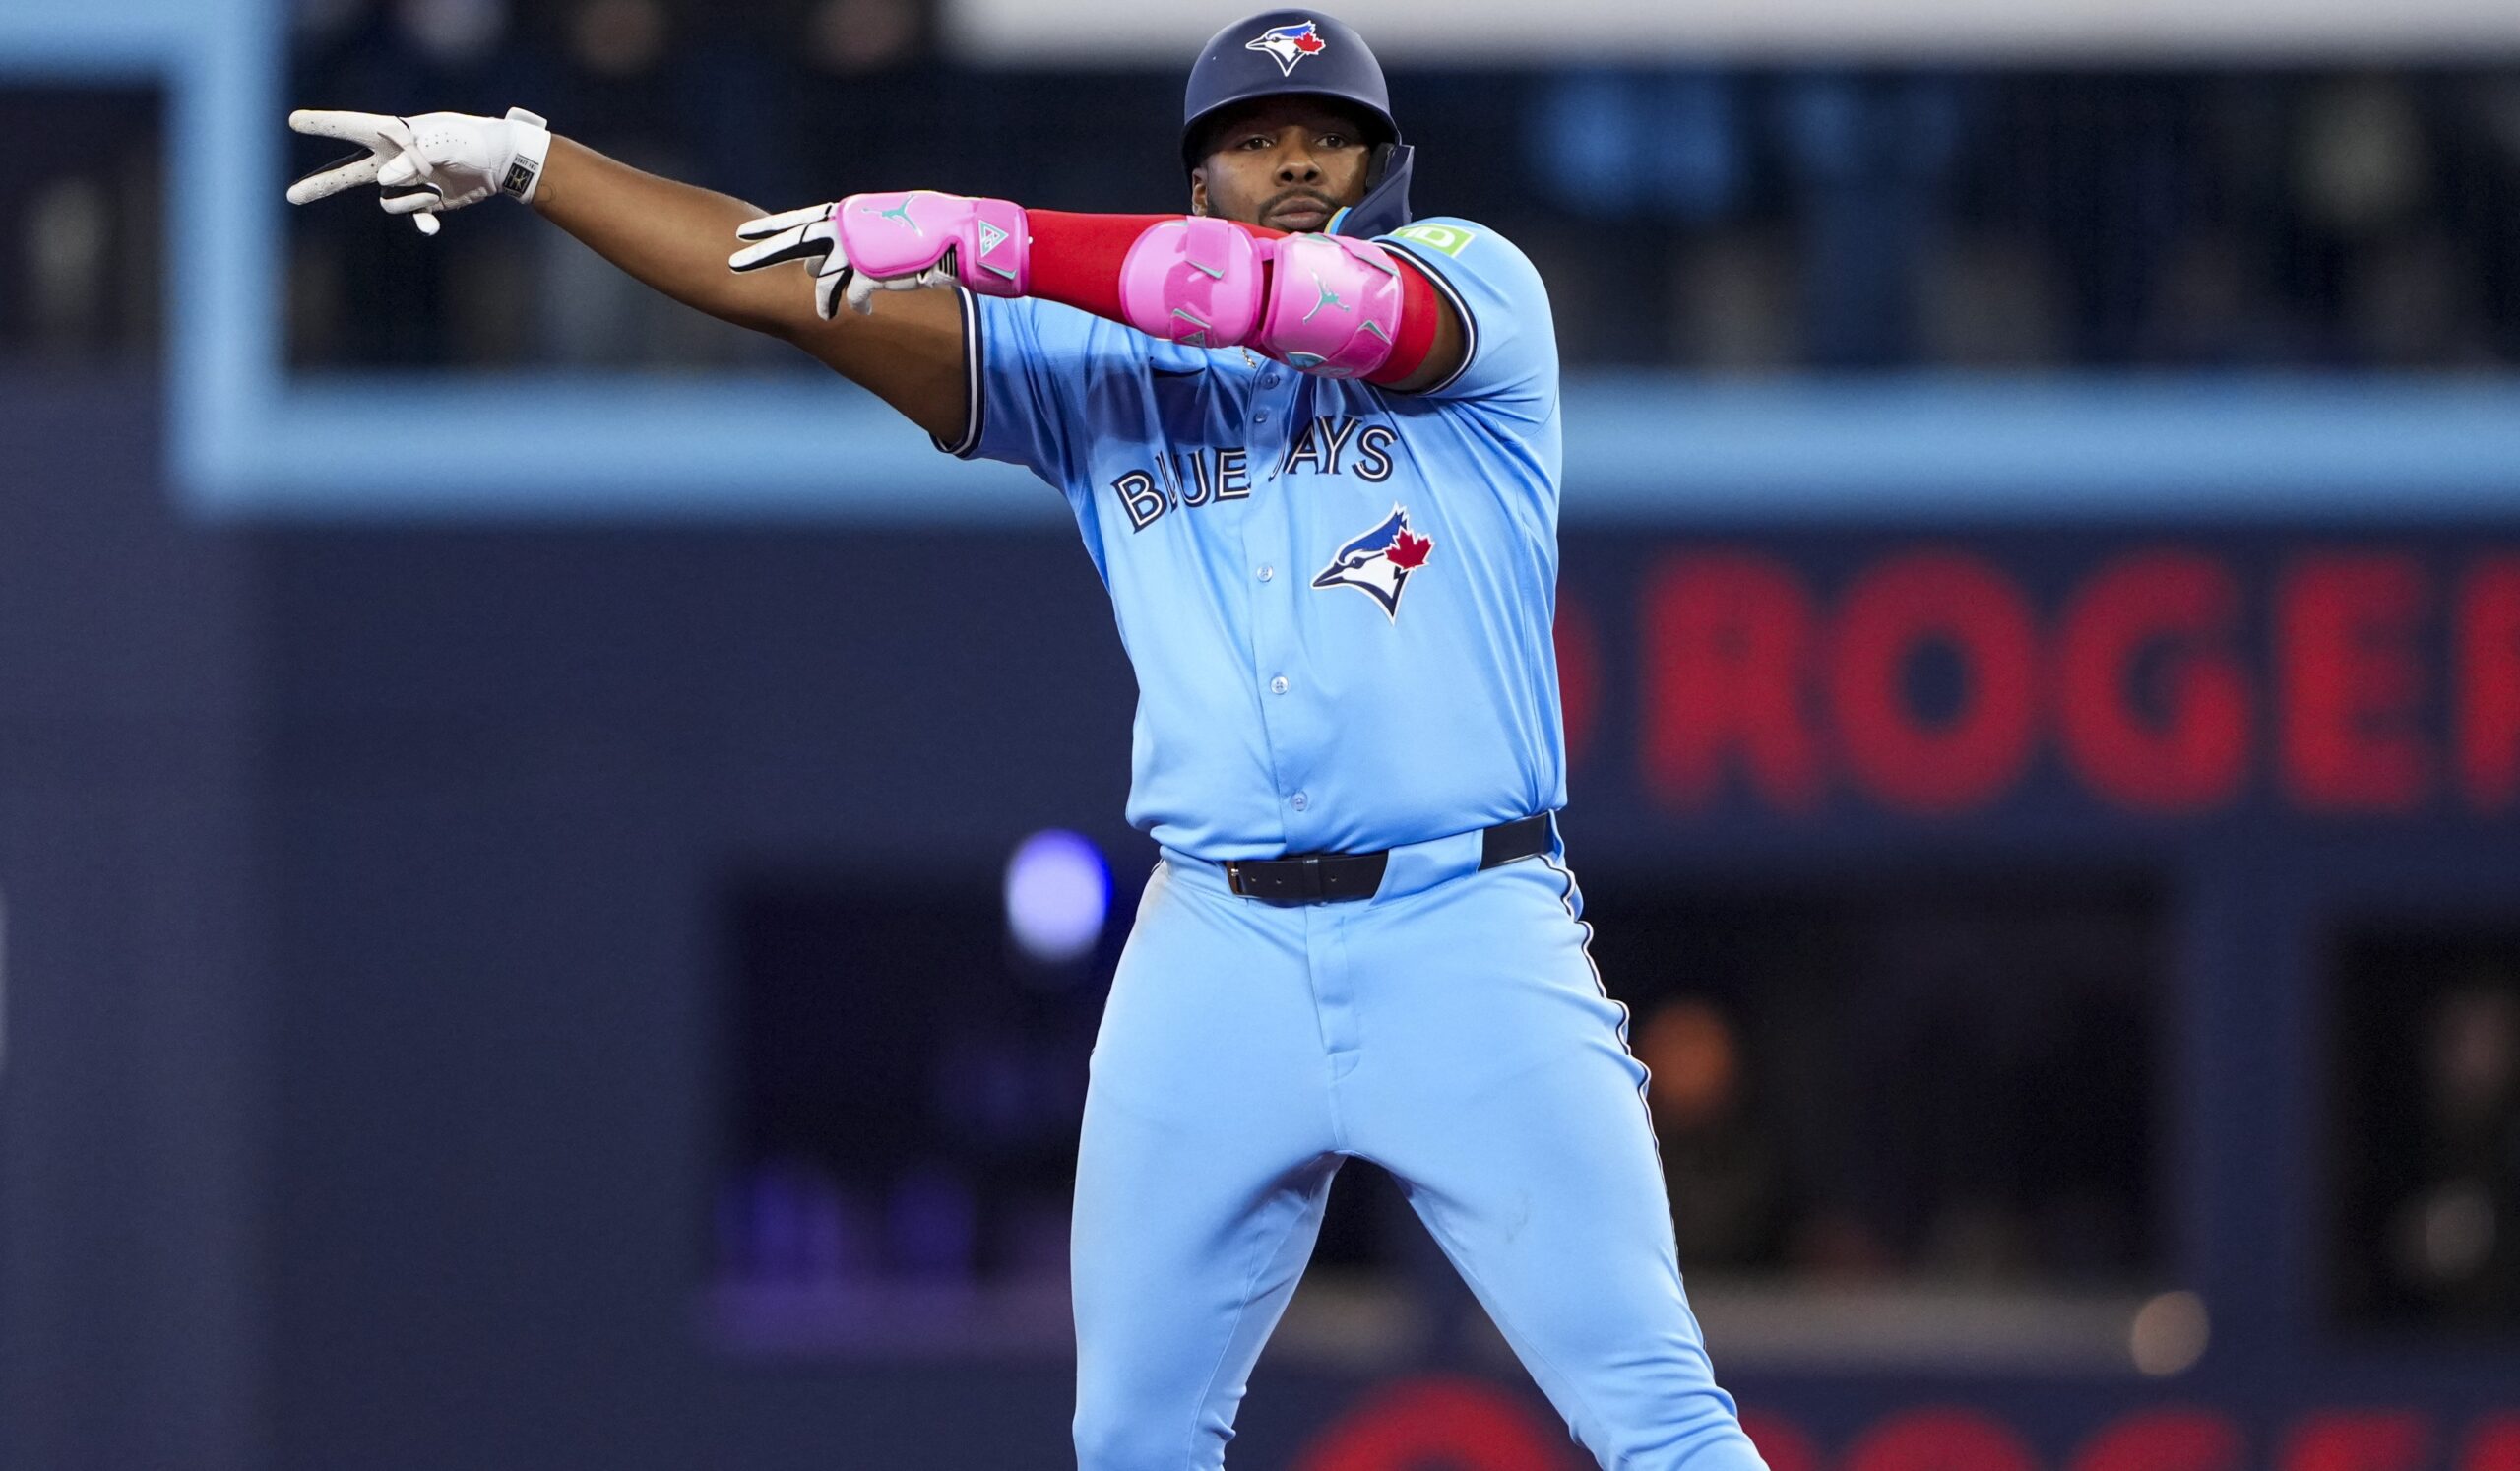
Then he changed his mind. I try to avoid the impulse to tell baseball players what to do with their careers, but I’ll say this: $500 million is a really, really good reason to abandon one’s previous position.
Guerrero’s $500 million contract extension with the Blue Jays starts next year, runs for 14 years, and contains a full no-trade clause but no opt-outs. The intention, then, is to keep Guerrero in Toronto for the rest of his career. Read the rest of this entry »
During the course of my spring training coverage (especially right at the end), I ran into the Giants affiliates a couple of times as I trailed the Brewers and Dodgers farm systems. I saw enough to make a few tweaks to the Giants prospect list, which I have brief notes on below. You can see the complete updated list over on The Board. I’ve also included notes on a few recent trades.
Toolsy Outfielders With Strikeout Risk Who Have Moved Up
Dakota Jordan’s swing has changed (mostly his posture throughout the swing), and I think it gives him a better chance to hit. I was way out on him making any kind of viable contact before last year’s draft, but he has loud showcase tools (power/speed) and now we’ll see if the proactive changes make a difference for his contact ability. He has also looked good in center field, including highlight reel play in which he collided with the wall at Papago Park, but then forgot how many outs there were and spiked the baseball:
The Terry Francona era in Cincinnati is not off to a rousing start, particularly on offense. Last week, the Reds became the first team to lose three straight 1-0 games in 65 years, and so far, they’ve lost all three series they’ve played, against the Giants, Rangers, and Brewers. Despite the promise of a good rotation headlined by Hunter Greene, and some eye-opening changes by Elly De La Cruz, it looks like it could be a long summer in Cincinnati.
The Reds are 3-7 and fourth in the NL Central entering Monday. They’ve actually outscored opponents 39-38, but two of their three wins were lopsided ones, a 14-3 blowout of the Rangers on March 31 and then an 11-7 win on Saturday over the Brewers. Between those games, they lost four straight, including a pair of 1-0 games against the Rangers on April 1 and 2, and then a third 1-0 loss to the Brewers on April 3. They actually went scoreless for 35 consecutive innings, the longest stretch that a Reds team has gone without a run since 1946. The streak began with the eighth inning on March 31 (a home game, so they didn’t bat in the ninth), ran through those three 1-0 losses, and extended until the eighth on April 4, when they were down 3-0; they scored a pair of unearned runs but fell short, 3-2.
Amid that streak, the Reds made some dubious history, becoming just the sixth AL or NL team to lose three straight 1-0 games since 1901:
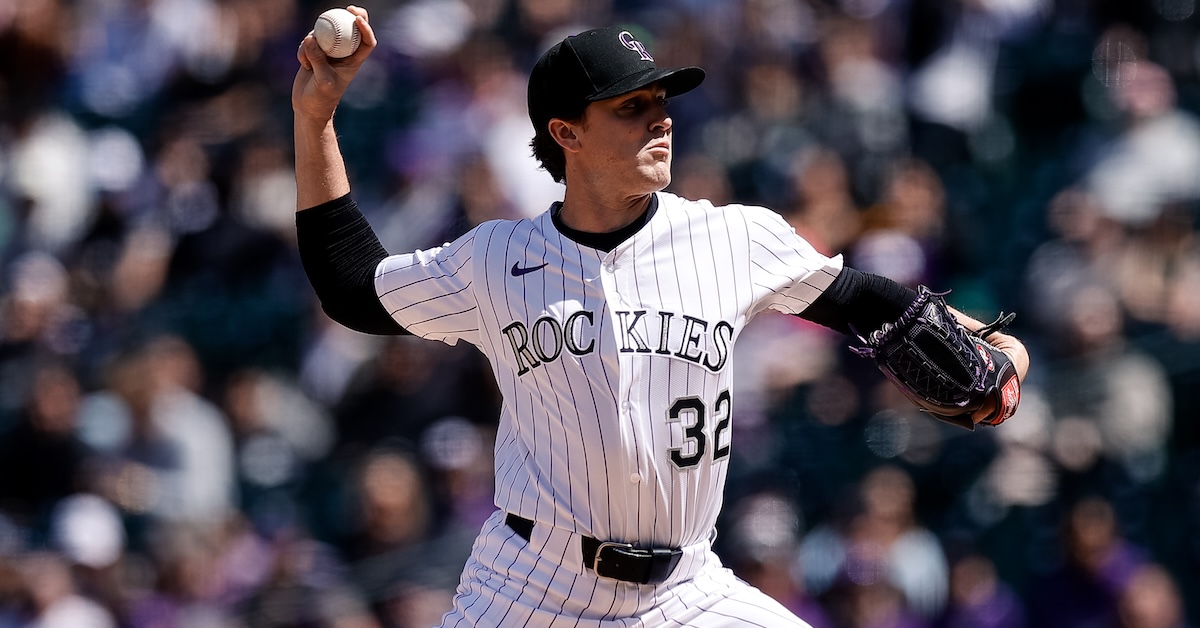
Chase Dollander made his much-anticipated debut with the Rockies on Sunday afternoon, allowing seven hits and four runs over five innings and earning his first big league win. Ranked no. 12 on our Top 100 Prospects list this spring, the 23-year-old right-hander fanned six, walked one, and surrendered a pair of home runs as Colorado outscored the Athletics 12-5 at Coors Field.
His power arsenal was on display throughout. Topping out at 99.3 mph with his high-octane heater, the 2023 first-round pick out of the University of Tennessee threw 34 four-seamers, 21 sliders (which Baseball Savant classifies as a cutter), 15 curveballs, and nine changeups. Undaunted by a premiere in the majors’ most hitter-friendly venue, he aggressively attacked the zone, throwing 49 of his 79 pitches (62.%) for strikes.
Dollander discussed his repertoire prior to the start of the regular season.
———
David Laurila: Scouting reports say you have a plus fastball, good secondaries, and that you usually command the ball well. Does that sound accurate?
Chase Dollander: “I would say so. I feel like my stuff is in a good spot right now. I do think that getting the slider a little harder and a little shorter would be good for me. But other than that, yeah, I feel like my stuff is in a good spot.”
We have all kinds of fantastic stats for tracking player performance, metrics that are descriptive, predictive and somewhere in between. Today, I would like to introduce a descriptive stat for the folks on the team who do not wear spikes. Think of this as an attempt to measure the performance of management by trying to quantify the work of the front office and coaching staff using a folky metaphor.
Oh, Puff the magic dragon lived by the sea
And frolicked in the autumn mist, in a land called Honah Lee
Baseball is a game for kids. The best of the best get to frolic in the autumn mist in a Honah Lee called the World Series. Baseball has many reasons to favor youth, some structural to the game as a business and others more existential, like Peter, Paul and Mary sing about.
Team control and the aging process conspire to make young, developing players the most valuable to the ballclub. Their income constraints mean that youngsters can rack up surplus value if they hit their ceiling, and are an inexpensive sunk cost at worst. The best baseball exists in the sweet spot between the physicality of youth and the skill earned through repetition. Not exactly revolutionary, but my stat builds from the logic that you want to play guys who can either contribute to wins this season or might develop into contributors in the future. Additionally, I am assuming that playing time at the major league level is far better for evaluation and development than the upper minors due to the quality of competition as well as the availability of data, scouting tools and other resources, though obviously that might vary depending on the org and the player. Here is where Peter, Paul and Mary, darlings of the Greenwich folk scene of the 1960s, come into play. Read the rest of this entry »
Like many of you, I was minding my own business on Saturday, March 29, when I got a text from a well-connected friend asking me what the deal was with the new bats that the Yankees were using and whether they were responsible for all those home runs. Of course, having been preoccupied with other things, I had no idea what he was talking about. But I very quickly found out, as I have since been bombarded with questions from people I haven’t heard from in ages, as well as interview requests from the media. As I write this, a week has passed, many articleshavebeen written, and lots of people have weighed in on these new bats. But while this article will appear rather late in the discussion, I am hopeful it will provide some new insights into the so-called torpedo bats. And as I am want to do, I will discuss what I have learned from a physics perspective.
Before getting into my quantitative analysis, I first want to discuss the torpedo bats more qualitatively, as they were presented in a recent FanGraphs article by Davy Andrews. With a beautiful image that pretty much tells the whole story, Davy shows three different regions of a typical baseball bat: the skinny handle (“total garbage”), the sweet spot zone, and the 3-4 inches at the tip (“more garbage”).