The bat waggle is by far the most popular way to stay loose at the plate. Presumably that’s because waiting for a pitch is one of the few situations when it’s socially acceptable to waggle something. Life just doesn’t offer that many opportunities to waggle. Also, it’s a two-fer. It doesn’t just keep you loose; it also keeps your bat loose. It’s all well and good if you’re body’s ready to hit, but good luck trying to catch up to a Justin Verlander fastball with a tight bat. (Fun Fact: It turns out that bats — you know, the actual winged creatures — have their own waggle.)
But even after you waggle your bat, those last couple seconds are tricky. You’re locked into your batting stance, and now you’re just waiting there at the mercy of the pitcher (and the pitch clock). You’ve got to do something to maintain attack readiness. Some players bounce the bat off their shoulder, or bounce a little bit deeper into their crouch a few times. They rock back and forth, raise and lower their hands, or grind the toe of their cleat into the dirt. Some even make sure their pelvis is loose. Like, really loose. Like, very, extremely, possibly even dangerously loose.
Welcome to another installment of my weekly look at five things that caught my interest in baseball. As always, I’m indebted to Zach Lowe of ESPN for the idea — his basketball column remains one of my favorite reads in all of sports. That’s all the time we have for an introduction today, though, because there’s a lot to talk about. Let’s get to it.
1. Meaningful Baseball in Baltimore
It’s been a minute. The Orioles started a comprehensive teardown in 2017 and doubled down on it by hiring Mike Elias from the Astros after the 2018 season. They’ve finished fifth, fifth, fifth, fourth, fifth, and fourth in the AL East since then. There was a lot to follow on the prospect front, but the major league team looked bleak; the closest they came to first place in that stretch was 15 games out, and that was in the abbreviated 2020 season. Last year there was a glimmer of hope – the team finished 83-79 and Adley Rutschman, a generational catching prospect, impressed in his debut. But that team didn’t quite feel complete; the front office traded players away at the deadline and kept some of its top prospects in reserve.
This year feels different, with this week’s series against the first-place Rays the highest-stakes baseball in Baltimore in quite some time. The Orioles aren’t just second in their division, they’re second in the entire American League. That series was phenomenal, close throughout and well played across the board. The Orioles took two out of three, with an aggregate 6-6 scoreline, and it felt like two good teams trading blows, not one juggernaut and one pretender facing off. Read the rest of this entry »
If you have any sense at all, you probably deactivated your Facebook account years ago, and thus liberated yourself from knowing intimate details about your distant relatives, schoolmates, and old co-workers. In this situation, it’s nevertheless helpful if your partner, or a close friend, remains plugged in. All the more so if they’re an inveterate gossip. Because even if you don’t want the fire hose of information, a little splash of water every now and then is refreshing.
Your second cousin once removed? Getting divorced for the third time, and getting really into NFTs about a year too late. The girl you asked (unsuccessfully) to junior prom? Just won a local Emmy for her work as a TV meteorologist. Booger from the sales department at your first job out of college? Newly ordained as a deacon at his church. Good for you, Booger.
As we go through life, we accumulate people according to time and context. A very small percentage of those stick and become lifelong friends; most drift away when circumstances change. Even people who are vitally important at one time — even roommates, romantic partners, confidants — float away sooner or later, to be replaced by some other person more suitable to the new social context. Read the rest of this entry »
Ben Lindbergh and Meg Rowley banter about Meg’s recovery from COVID and the belated release of the CBA, predict how well White Sox cast-off Jake Diekman will pitch for the Rays, discuss injuries to Luis Garcia, Max Fried, Tyler Mahle, and more pitchers and investigate forearm/flexor strains as potential precursors to Tommy John surgery, react to Jack Flaherty’s comments about his diminished velocity, assess the state of the Astros’, Mets’, and Braves’ rotations, celebrate the call-up of Marlins prospect Eury Pérez and speculate about the call-up of hard-hitting Reds prospect Elly De La Cruz, laud the new, old Kenley Jansen, review what the “insiders” say about Shohei Ohtani’s upcoming contract, evaluate the needs of the Orioles and Mariners, and more, plus a Past Blast (1:42:35) from 2005.
Bad injury news for a member of your rotation is always unwelcome, so the Braves had a very unhappy Wednesday, with two starting pitchers hitting the IL to go along with a loss in their series closer with the Red Sox.
In Atlanta’s current era of success since its last rebuild, there’s no pitcher that has been more crucial to the team’s fortunes than Max Fried. Since his debut in 2017, he has amassed 14.4 WAR, more than double that of any other pitcher on the roster (next up is Charlie Morton at 6.5). He’s already missed time this season due to an injury, a hamstring strain that cost him two weeks in April. The current injury, however, is far more serious, one that will measure in months rather than days or weeks.
Expectation has been Fried and Wright will both be sidelined for at least two months. With this being his second shoulder ailment of the year, Wright thinks he could be out longer than Fried.
A forearm strain is usually enough to cause serious and forlorn eyebrow-raising, but the silver lining here is that the MRI on Fried’s elbow didn’t reveal an injury severe enough to require surgery. This is especially important given that he already had Tommy John surgery back when he was a prospect with the Padres. That previous procedure cost him part of 2014 and all of ’15, and the basic truth is that though medicine has made progress and that Tommy John surgeries aren’t career-enders to the degree they used to be, repeat procedures have considerably less success. In this 2016 study of so-called revision Tommy John surgery, less than half of the pitchers looked at even pitched in 10 major league games afterward, and they saw their average career length drop in half compared to first-time patients. Read the rest of this entry »
We’re closing in on the quarter-season mark on the 2023 MLB schedule, and the Twins are off to a first-place start. Sure, that’s thanks in part to a sluggish performance of the rest of the sorry AL Central – the second-place Tigers are the fifth team out of a Wild Card spot at the moment – but Minnesota looks just about poised to run away with the division, and the team has its arms to thank. By ERA, FIP, xFIP and WAR, the Twins have one of the top three pitching staffs in baseball to this point, and despite an offense that has yet to really find its rhythm, the Twins’ run prevention efforts – led by a slew of impressive right-handed starters – have been something of a revelation.
Sonny Gray has had perhaps the sunniest start of all, allowing no more than one earned run in each of his first six starts and showing flashes of his vintage All-Star form. Newcomer Pablo López had a pair of starts he wishes he could take back at the end of April, but for the most part looks as advertised. With early injuries to Kenta Maeda and Tyler Mahle – who the Twins just announced will undergo Tommy John surgery – the depth is already being put to the test, but Bailey Ober has looked fantastic in his three outings and Louie Varland has handled his call capably, most recently allowing a single run in six frames against the Padres on Tuesday.
Then there’s 26-year-old Joe Ryan, who seems to have taken a step forward after a respectable 2.1-WAR rookie season last year. Through seven starts, the right-hander has a 2.45 ERA, 2.87 FIP, and 3.31 xFIP with 47 strikeouts and just six walks in 44 innings, leading Minnesota to a 5-2 record in those games. He’s one of just nine pitchers in the majors with as many as six quality starts; he’s allowed 1 or 0 earned runs four times and three or fewer hits four times. In just his second full season in the majors, Ryan looks as though he’s been there for years. Read the rest of this entry »
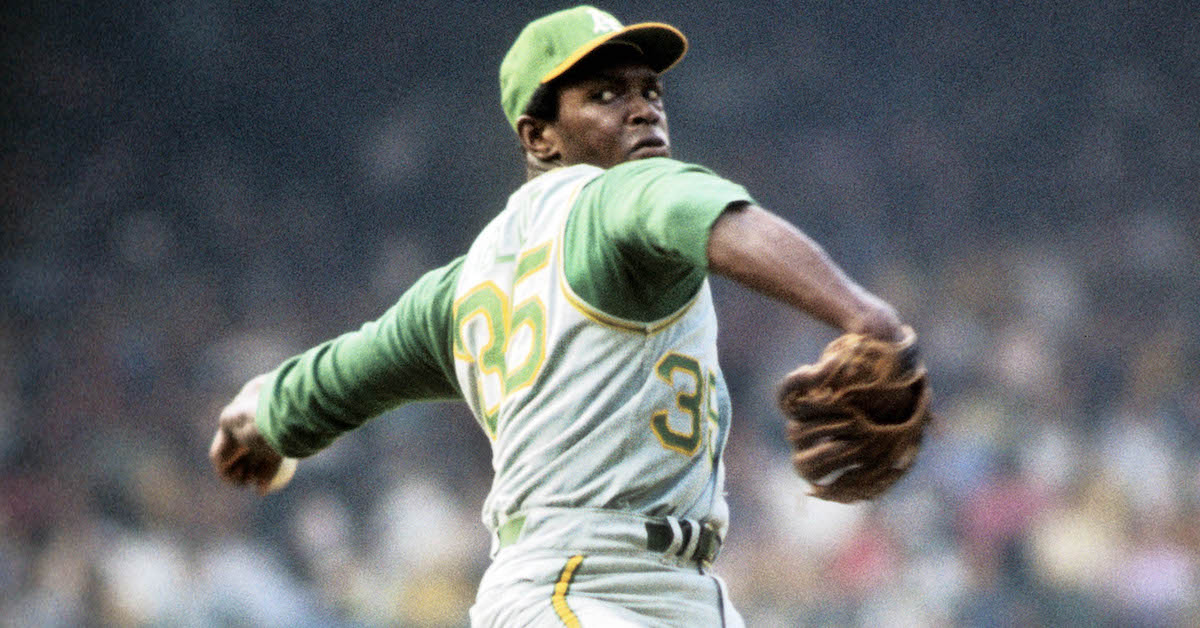
Before Matt Harvey, Fernando Valenzuela, Dwight Gooden, and Mark Fidrych, there was Vida Blue, who checked just about every box that an electrifying pitching sensation can. The fireballing lefty debuted in the majors at age 19 in 1969, pitched a no-hitter as a rookie the following year, started the All-Star Game and won MVP and Cy Young honors in his first full season while being featured on national magazine covers, and helped a flamboyant and rowdy A’s squad to three straight world championships, but not before butting heads with owner Charlie Finley over his salary, his name, and even his lack of facial hair.
Working primarily with fastballs and only occasionally mixing in curves and changeups, the green-and-gold-clad Blue was sight to behold on the mound for his high leg kick, smooth delivery, and easy velocity. “A muscle-rippling 6 ft., 190 lbs., he has none of the herky-jerky, elbow-popping moves that invariably send fastballers to the showers — or the osteopath,” wroteTIME for its August 23, 1971 cover story. “Rather he has a kind of loose, flowing grace that allows him to snap off a high, hard one with seemingly effortless ease.”
From the dizzying heights of that initial climb, it’s tough to go anyplace but down. But while Blue couldn’t replicate his phenomenal 1971 performance, when he went 24–8 with a 1.82 ERA, 301 strikeouts, and eight shutouts, he made five more All-Star teams before substance abuse problems derailed his career, resulting in a short stint in prison and a year-long suspension from baseball. Though haunted by the what-ifs that come with so many tales of too much, too soon, he did his best to rehabilitate himself, his career, and his image thereafter, maintaining his profile as a Bay Area icon and as one of the Black Aces.
RIP Vida Blue. No-hitter at 21, MVP/CY at 22, 3x World Series winner 22-24, 6x All-Star pic.twitter.com/kI9h2aJk2n
Blue passed away on May 6 at age 73. No cause of death was formally disclosed, but he was known to have been battling some form of cancer. He was frail and in need of a cane when he appeared at the Oakland Coliseum on April 16, for the 50th anniversary celebration of the 1973 champions. “I know he hung on for that last anniversary celebration like the absolute gamer he was,” wrote A’s broadcaster Dallas Braden on Twitter. Blue is the third member of the A’s dynasty to pass away this year. Third baseman and team captain Sal Bandodied in January, and reserve outfielder Jesus Alou passed away in March.
On a garishly-outfitted team that included Hall of Famers Reggie Jackson, Catfish Hunter, and Rollie Fingers, Blue was among the most colorful members. “We were the team everybody wanted to come see: the freaks with the mustaches, with the long hair, that took batting practice in black shoes but came out to play in white shoes,” he told Jason Turbow, author of the 2017 book Dynastic, Bombastic, Fantastic: Reggie, Rollie, Catfish, and Charlie Finley’s Swingin’ A’s.
Finley even tried to capitalize on Blue’s surname by offering him $2,000 to change his first name (some sources say middle name) to “True,” but Blue told him that the name he shared with his father was too important to change. “It means ‘life’ in Spanish. I loved my father. Now that he’s dead, I honor him every time the name Vida Blue appears in the headlines,” Blue toldTIME. “If Mr. Finley thinks it’s such a great name, why doesn’t he call himself True O. Finley?” Over the pitcher’s protests, the owner nonetheless instructed the A’s radio and television announcers to refer to Blue by the nickname, and had the scoreboard operator show “True Blue” as pitching until Blue asked them to stop. “I was pissed and I let him know,” he later said.
Vida Rochelle Blue Jr. was born on July 28, 1949, in Mansfield, Louisiana, a small town near Shreveport in the northwest corner of the state. He was the oldest of six children born to Vida Sr., a steelworker, and Sallie Blue. Mansfield was segregated when he was growing up; its Black high school, DeSoto High, had no baseball team, but when the principal recognized Blue’s talent, he assembled one.
Blue also starred as a quarterback in high school and was recruited by major college programs such as Notre Dame, Purdue, and Houston at a time when Black QBs were a rarity. When his father died at age 45 during his senior year, Blue concluded that despite preferring football, he could better support his family via baseball, where his pitching had caught the eye of Kansas City A’s scouts Ray Swallow and Connie Ryan. He was wild but effective; he once struck out 21 in a seven-inning no-hitter but lost because he walked 10, and overpowered his catcher as much as the opposing hitters. “There were a lot of passed balls and dropped third strikes,” coach Clyde Washington told TIME.
The A’s picked Blue in the second round of the 1967 amateur draft, signing him for a $25,000 bonus. “When you’re from Mansfield, that’s a trillion dollars,” he told the Washington Post’s Candace Buckner in 2021; the money would help put his siblings through college. After debuting in the Arizona Winter League later that year, he dominated from the outset at A-level Burlington in 1968, striking out 17 and allowing only three hits in eight innings in his debut, and later pitching a seven-inning no-hitter. He finished with a 2.49 ERA and 231 strikeouts in 152 innings.
Blue lasted just 15 games at Double-A Birmingham in 1969 before the A’s brought him to the majors. He debuted on July 20, eight days before his 20th birthday, and scuffled against the Angels, allowing five runs (three earned) and two homers in 5.1 innings. He got his first win in his next start nine days later, allowing four runs in eight innings against the Yankees. After two more starts, he spent the rest of the season in the bullpen, but he was shaky, finishing with a 6.64 ERA in 42 innings. “It was a shame to bring up a kid like that when he hasn’t pitched two pro years,” said Joe DiMaggio, then a coach with the A’s. “He throws as hard as anybody, but he hasn’t learned to pitch yet.”
Blue spent most of 1970 at Triple-A Iowa, where former All-Star Juan Pizarro took him under his wing, showing him a curveball grip and suggesting changes to his delivery. Pizarro “helped me more than any single person in my career,” Blue later said. He struck out 165 in 133 innings and posted a 2.17 ERA before the A’s called him up in September. In his second start, he threw a one-hit shutout against the Royals, walking four and striking out seven; Pat Kelly’s two-out single in the eighth ended his no-hit bid. Two starts later, on September 21, Blue no-hit the Twins, walking one and striking out nine while matched up against eventual AL Cy Young winner Jim Perry. “We never even saw the ball,” said slugger Harmon Killebrew afterward. “But we sure heard it good.”
Blue made two more starts, finishing 2–0 with a 2.09 ERA and 35 strikeouts in 38.2 innings and surpassing the 50-inning threshold that qualified him as a rookie. He was done with the minor leagues.
Oakland had won 88 games in 1969 and 89 games in ’70, finishing second in the AL West both times. With Blue ready to join Hunter and Blue Moon Odom in the rotation, the A’s were primed to take the next step. Blue drew the Opening Day start against the lowly Senators but didn’t get out of the second inning, though three days later he threw a rain-shortened, six-inning shutout, striking out 13 Royals. He followed that with a two-hit shutout of the Brewers, then threw a pair of four-hit shutouts within his next four starts. By late May, he was 10–1 with a 1.03 ERA and 10 complete games in 12 starts, prompting The New Yorker’s Roger Angell to check in at Fenway Park. “Vida Blue, I discovered, is a pitcher in a hurry. Each inning, he ran to the pitcher’s mound to begin his work and ran back to the dugout when it was done,” he wrote in a dispatch that was included in The Summer Game the following year.
“In the field, he worked with immense dispatch, barely pausing to get his catcher’s sign before firing; this habit, which he shares with Bob Gibson and a few others, adds a pleasing momentum to the game. His motion looked to be without effort or mannerism: a quick, lithe body-twist toward first base, a high lift and crook of the right leg, a swift forward stride — almost a leap — and the ball, delivered about three-quarters over the top, abruptly arrived, a flick of white at the plate, His pitches, mostly fastballs and always in or very close to the strike zone, did not look especially dangerous, but the quick, late cuts that most of the Red Sox batters were offering suggested what they were up against.”
Blue was everywhere that summer, featured on the covers of Sports Illustrated and TIME, and within LIFE Magazine as well. Roommate Tommy Davis helped him navigate the media requests, but Blue wasn’t exactly ready for the attention. “It’s a weird scene. You win a few baseball games, and all of a sudden you’re surrounded by reporters and TV men with cameras, asking things about Viet Nam and race relations and stuff about yourself,” he told TIME. “Man, I’m only a kid. I don’t know exactly who I am. I don’t have a whole philosophy of life set down.”
By the All-Star break, Blue was 17–3 with six shutouts and a 1.51 ERA, capped by 11 scoreless innings with 17 strikeouts against the Angels. He was the obvious choice to start the All-Star Game for the AL; in the NL, Dock Ellis basically daredSparky Anderson to name him as the starter, telling the media, “I doubt very seriously if they’ll start a brother from the American League and a brother from the National.” The ploy worked, and for the first time two Black pitchers started the All-Star Game. Blue supplanted Denny McLain as the second-youngest pitcher to start the Midsummer Classic, though some of the aforementioned phenoms would soon surpass him:
In the game at Tiger Stadium, Blue allowed three runs in three innings, serving up homers to Johnny Bench and Hank Aaron but getting the win — the AL’s only victory from 1963 to ’82, as it turned out. Ellis served up Jackson’s famous, massive homer off the transformer atop the ballpark and gave up another to Frank Robinson.
Blue threw a one-hit shutout against the Tigers in his first start after the break and won his 20th game via a 1–0 shutout win over the White Sox on August 7. With a shot at 30 wins, he completed five of his remaining 11 starts but notched just four more wins and faltered a bit in September. Fatigue was probably a factor; his 312 innings that year is the most by a pitcher in his age-21 season during the post-1960 expansion era, and likewise for his 24 complete games.
The A’s won 101 games and the AL West title that year, but in the franchise’s first postseason appearance since 1931, they were swept by the reigning world champion Orioles in the ALCS. Blue carried a 3–1 lead into the seventh in the opener but got into a jam, gave up three straight two-out hits, and departed on the wrong end of a 5–3 score. After the season, however, he beat out Mickey Lolich for the AL Cy Young award and Bando for the AL MVP award.
After making just $14,750 during his stellar season, Blue set his sights on a much larger payday, with his attorney Robert Gerst asking Finley for $115,000. Finley took the negotiations public and countered with a $50,000 offer. Blue lowered his demands, indicating he would sign for $85,000, but Finley wouldn’t budge, declaring his offer final. Blue held out as Marvin Miller, the executive director of the Major League Baseball Players Association, used the situation to draw attention to the game’s reserve clause, which gave the pitcher no other recourse. On March 16, Blue even called a televised press conference and — with tongue in cheek — announced he was retiring to take a job as the vice president of public relations for the Dura Steel Products Company. Finley wished him well but wouldn’t raise his offer. “Evidently he is [serious]. I have to assume that he is,” said the owner. In late April, with the season underway, commissioner Bowie Kuhn helped broker a $63,000 deal between Blue and Finley, though the stubborn owner clarified that he still hadn’t moved off $50,000; of the rest, $5,000 was as a signing bonus, and $8,000 was for his college fund.
Having missed spring training, Blue was in no condition to pitch yet. He didn’t make his first appearance until May 24 and went just 6–10 with a 2.80 ERA for a team that won 93 games. Embittered by the contract squabble, he was the only A’s player who turned down Finley’s offer of a $300 bonus by refusing to grow facial hair for the team’s Mustache Day celebration that year. It was a trying season that scarred him; in his 2011 autobiography, Vida Blue: A Life, he traced his substance abuse problems back to that season. “Along with all the glory that I’d achieved, there was a growing darkness reaching for me,” he wrote. “And the light began to dim as early as 1972.”
Blue pitched out of the bullpen during the ALCS against the Tigers, closing out the Game 5 clincher by earning a save with four shutout innings. He earned another save in the World Series opener against the Reds. After a total of eight relief appearances, he started Game 6 but took the loss; still, the A’s won Game 7, securing their first of three straight titles.
Blue returned to the rotation and pitched well, if not up to the caliber of his 1971 showing. He went 20–9 with a 3.28 ERA (109 ERA+) in 1973, striking out just 158 in 263.2 innings, but he struggled in the postseason, going 0–2 with a 7.00 ERA in 18 innings over four starts. He didn’t even make it out of the first inning in the ALCS opener against the Orioles, and in his best start, a 5.2-inning, two-run effort against the Mets in Game 5, the A’s didn’t score any runs for him. Again, however, the team prevailed in a seven-game World Series.
In 1974, after going 17–15 with a 3.25 ERA, Blue finally made a postseason start worthy of his legend, throwing a two-hit shutout against the Orioles in Game 3 of the ALCS, with Bando’s solo homer off Jim Palmer the game’s only run. This would be Blue’s only postseason win, though he pitched well in two World Series starts against the Dodgers, allowing five runs in 13.2 innings in his starts in Games 2 and 5. He left a tie game after 6.2 innings in the latter, and then Joe Rudi greeted Mike Marshall with a first-pitch homer in the bottom of the seventh, providing the decisive run that would give the A’s their threepeat.
Blue had one of his best seasons in 1975, going 22–11 with a 3.10 ERA (121 ERA+) and starting his second All-Star Game, where Dodgers Steve Garvey and Jimmy Wynn exacted a modicum of revenge for the previous fall by hitting solo homers. On September 28, the regular season’s final day, he pitched five hitless innings against the Angels; with Glenn Abbott, Paul Lindblad, and Fingers combining for four hitless innings themselves, the A’s completed just the third combined no-hitter in AL/NL history. With 98 wins (their highest total since 1971), they won their fifth straight AL West title, but Oakland couldn’t make it out of the ALCS against the Red Sox, and Blue couldn’t escape the fourth inning of Game 2 of the three-game sweep.
That winter, the momentous Messersmith-McNally decision put an end to the reserve clause, which restricted the right of players to switch teams. Faced with the necessity of either paying his stars fairly or losing them to free agency, Finley began dismantling his dynasty. He traded Jackson to the Orioles just before Opening Day, and on June 15, he sold Fingers and Rudi to the Red Sox for $2 million and Blue to the Yankees for $1.5 million. Just prior to the trade, Blue had agreed to a three-year contract worth $515,000 and received a promise that he would not be traded; within an hour, Finley reneged, claiming he was acting as the agent for the Yankees.
After deliberating for three days, Kuhn nullified the sales on the grounds that they were not “in the best interests of baseball.” Finley sued and ordered Chuck Tanner not to play the three players or even let them suit up until the team threatened to go on strike. Blue didn’t pitch for nearly three weeks, which cost him another shot at 20 wins; he finished 18–13 with a 2.35 ERA (142 ERA+), his best run prevention since 1971.
While Fingers and Rudi left via free agency after the season, Blue’s three-year contract had been ruled valid, and he spent 1977 as one of the few bright spots on a 98-loss team. In January 1978, Finley tried to sell him to the Reds for $1.75 million, but that, too, was rejected by Kuhn. Finally, on March 15, he was traded across the bay to the Giants in exchange for seven players (Gary Alexander, Dave Heaverlo, Phil Huffman, John Henry Johnson, Gary Thomasson, Alan Wirth and player-to-be-named-later Mario Guerrero) and $300,000.
Blue went 18–10 for the Giants with a 2.79 ERA in 1978. He made history that summer as the first pitcher to start the All-Star Game for both leagues (since then, Roger Clemens, Randy Johnson, Roy Halladay, and Max Scherzer have done so as well) and finished third in the Cy Young voting. He spent three more seasons with San Francisco, rebounding to make two All-Star teams after posting an uncharacteristically bad 5.01 ERA in 1979; in 1981, he became the first (and still the only) pitcher to notch wins for both All-Star teams. On March 30, 1982, he was traded to the Royals along with Bob Tufts in exchange for four players (Craig Chamberlain, Atlee Hammaker, Renie Martin and Brad Wellman); at the time, he was reportedly making $600,000 a year, signed through 1988.
Blue was merely solid in 1982; the Royals, who had taken over AL West supremacy from the A’s, won 90 games but finished second in the division, missing the playoffs for just the second time since their run began in 1976. In 1983, Blue’s career hit the skids: he went 0–5 with a 6.01 ERA, lost his rotation spot, and was released on August 5. He had even bigger problems, as he became ensnared in an FBI investigation into a Kansas City cocaine ring that intersected with baseball to such an extent that the investigation target’s basement was known as “The Cooperstown Room.” After cooperating with a federal grand jury and completing a rehab program, Blue — who had started using cocaine while with the Giants — pled guilty to possession of three grams of cocaine and received a $5,000 fine and a one-year prison sentence, with all but 90 days suspended. Teammates Willie Aikens, Jerry Martin, and Willie Wilson were also arrested for attempting to possess cocaine and similarly sentenced. Kuhn suspended all four for the 1984 season but reduced the suspensions of all but Blue upon appeal in mid-May. Blue was released from prison after serving 81 days.
After being reinstated, Blue returned to the Giants and pitched for two more seasons, one bad, the other pretty good. In 1985, he testified about the proliferation of cocaine within baseball at the Pittsburgh drug trials. On the heels of a 10–10, 3.27 ERA showing in 1986, the 37-year-old southpaw re-signed to a $300,000 contract with the A’s but retired abruptly during spring training. Soon afterwards, the Los Angeles Timesreported that he had failed three drug tests administered as part of his probation during the season and was charged with violating his parole. Federal law prevented the probation office from violating confidentiality by informing either MLB or the Giants. Blue had additionally been subject to random drug testing as a condition of his reinstatement by Kuhn’s successor as commissioner, Peter Ueberroth, but had not tested positive in that context.
“I reached the point where I had to choose between baseball and life,” Blue toldSports Illustrated’s Ron Fimrite of his decision to retire in 1997. “I needed to work full time getting myself back on ground.”
Blue wasn’t entirely done with pitching, spending 1989 and ’90 in the Senior Professional Baseball Association, after which he served as a community representative for the Giants, visiting schools to warn children about the dangers of drugs and serving as a commissioner of a youth baseball program sponsored by the team. “My problem gave me a wake-up call. Now I like seeing myself as a person who can bring some joy to others’ lives,” he told Fimrite.
His battles continued, however. After being arrested for driving under the influence of alcohol for the third time in a six-year span in 2005, he was sentenced to six months in jail but allowed to serve his sentence in a residential alcohol treatment program after completing a rehab program; doing so was also a condition of his reinstatement with the Giants. According to Buckner, he was arrested again as recently as 2016, resulting in a night in jail and the loss of driver’s license.
Blue often expressed regret about not getting elected to the Hall of Fame. Appearing first on the 1992 BBWAA ballot, he received just 5.3% of the vote, enough to stick around, but he topped out at 8.7% in his four-year run. He believed his cocaine problems cost him a shot. “That Hall of Fame thing, that’s something that I can honestly, openly say I wish I was a Hall of Famer,” he told Buckner. “And I know for a fact this drug thing impeded my road to the Hall of Fame — so far.”
While one can certainly sympathize with Blue’s regrets and imagine that without his problems he might have accumulated the career numbers to earn a spot in Cooperstown, his actual ones aren’t Hall caliber. That’s true whether considering his traditional numbers or his advanced ones, though they do compare favorably to Hunter, his longtime teammate, whose career ended at age 33 due to arm problems but who was elected in 1987, his third year of eligibility.
Vida Blue vs. Catfish Hunter — Traditional Statistics
Player
W-L
IP
SO
ERA
ERA+
Blue
209-161
3343.1
2175
3.27
108
Hunter
224-166
3449.1
2012
3.26
104
SOURCE: Baseball-Reference
Vida Blue vs. Catfish Hunter — Advanced Statistics
Player
Career WAR
Adj. Peak WAR
S-JAWS
Rk
Blue
45.1
34.3
39.7
147
Hunter
40.9
30.0
35.4
183
Hunter won 20 games more times than Blue (five to three), made more All-Star teams (eight to six), and won more championships (five to three) thanks to his time with the Yankees, which no doubt raised his profile. He had a stronger postseason resumé as well, but the lack of scandal attached to his name didn’t hurt. He owns the third-lowest S-JAWS of any AL/NL starter in the Hall, however; Blue’s score exceeds just three others besides that trio.
With or without the Hall, Blue’s legacy encompasses the thrills he provided at his peak as well as the work he put into reclaiming his life and his dignity after his drug-induced detour. He helped so many in need and inspired countless others, including future pitchers such as Santa Clara native Mark Langston, Livermore native Randy Johnson, and Oakland native Dave Stewart. “I remember watching a 19-year-old phenom dominate baseball, and at the same time alter my life,” wrote Stewart via Twitter after Blue passed away. After watching Blue, he followed in his footsteps, joining him among the Black Aces, the informal fraternity of 15 African-American pitchers who have won 20 games in a major league season, and helping the A’s to three pennants and a championship.
“I worked my tail off to polish that image back up and renew the name Vida Blue Jr.,” he told Buckner. “It’s a constant battle to do that every day.” By all accounts, he succeeded.
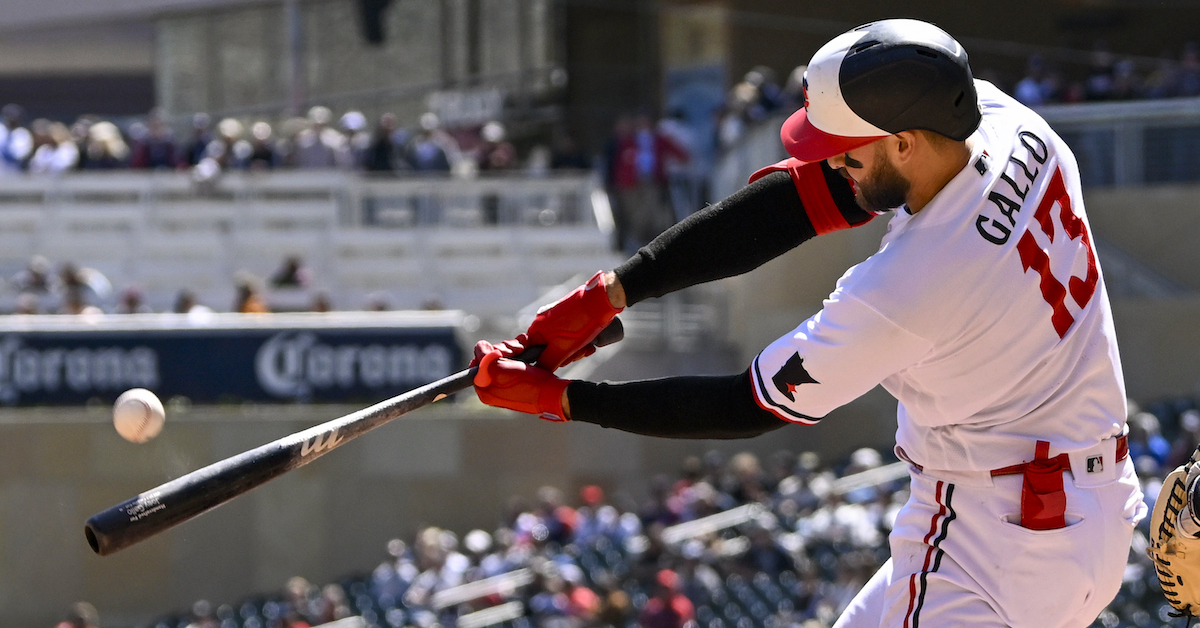
Here’s something we all know about Joey Gallo: He’s got power to spare. Even before he was a big leaguer, tales of his top-of-the-charts power made the rounds among talent evaluators and fans alike. The question was never whether his power would play in the majors, it was whether the strikeouts that came with that power would drag his production down. Those discussions didn’t stop when he made the majors for good in 2017. In fact, it’s 2023 now, and most of the same positives and negatives are still up for debate.
To wit: Through Tuesday’s games, Gallo has hit .189/.326/.541, which works out to a 137 wRC+. He’s also striking out 32.6% of the time – and that would be the lowest strikeout rate of his career. In just 89 plate appearances, he already has seven home runs. By most accounts, it would appear that Gallo is Galloing as hard as ever.
Plot twist: Gallo has made a big adjustment this year, one that seems to have steered him out of the rut he fell into in recent seasons. See, Gallo had a second carrying tool offensively, beyond the power. His thump made opposing pitchers so afraid of him that he ran up massive walk totals merely by being passably selective. In 2019, the season that saw him post his best batting line, he walked 17.5% of the time. In 2021, his second-best, he walked 18% of the time. It’s not so much that he had a perfect batting eye; rather, he just started swinging less in 2019, and pitchers avoided the zone against him to such an extreme degree that he drew piles of walks. He kept it up for a few years before starting to swing more again in 2022. Read the rest of this entry »
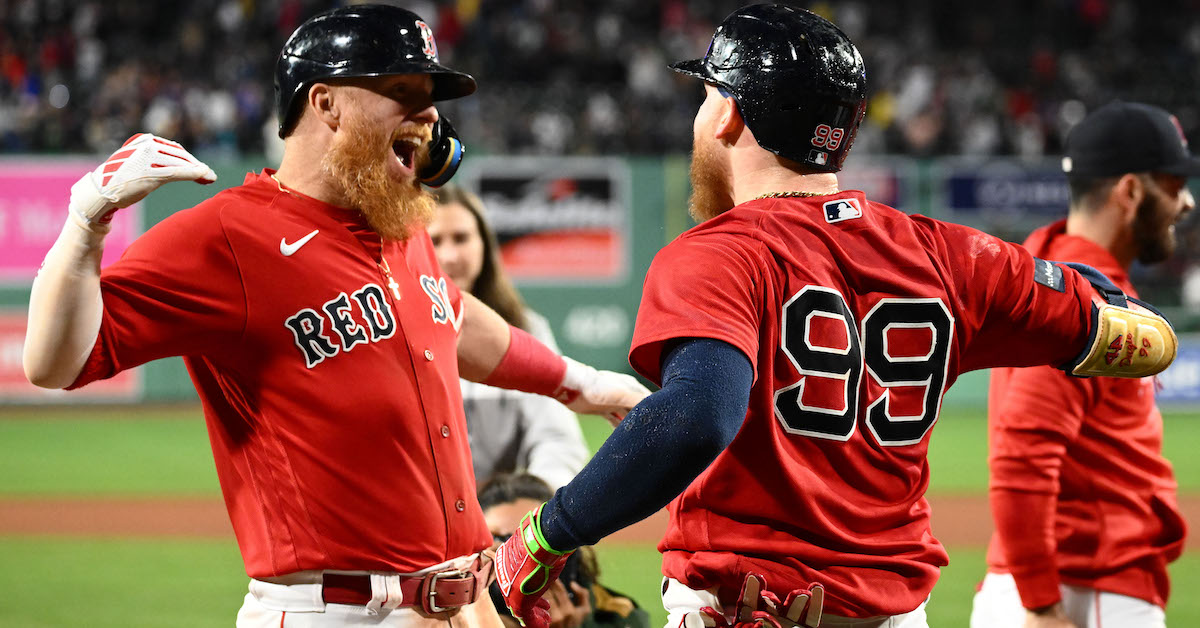
Like a riddling Batman villain, the Red Sox entered the 2023 season draped in question marks. Much of the uncertainty surrounded their rotation, which was set to include injury-prone veterans Chris Sale, Corey Kluber, and James Paxton; perennial “breakout” candidate Nick Pivetta; and converted reliever/inexperienced starter Garrett Whitlock. Moreover, the Red Sox were heading into battle without their three most valuable defensive players from the year before. Christian Vázquez, Xander Bogaerts, and Trevor Story combined for 20 DRS and 28.8 DEF in Boston last season; the rest of the team produced -51 DRS and -40.8 DEF. Reese McGuire, Enrique Hernández, and Christian Arroyo had big shoes to fill. Read the rest of this entry »