The expanded postseason field made for a distinct lack of drama as the regular season wound down. Most of the field was set by mid-September, with just a few races lasting into the final weeks of the season. But the board has been reset in the postseason. With the new Wild Card round set to begin today, here’s a look at the 12 teams in the playoffs and how they stack up against each other.
A reminder for how these rankings are calculated: first, we take the three most important components of a team — their offense (wRC+), and their starting rotation and bullpen (a 50/50 blend of FIP- and RA9-, weighted by IP share) — and combine them to create an overall team quality metric. New for this year, I’ve opted to include defense as a component, though it’s weighted less heavily than offense and pitching. Some element of team defense is captured by RA9-, but now that FanGraphs has Statcast’s OAA/RAA available on our leaderboards, I’ve chosen to include that as the defensive component for each team. Since regular season records don’t matter in the playoffs, I’ve removed the factors for win percentage and expected win percentage from the calculations.
Tier 1 – The Favorites
Team
Record
wRC+
SP-
RP-
RAA
Team Quality
World Series Odds
Dodgers
111-51
119
82
77
8
188
14.9%
Astros
106-56
112
82
78
23
184
18.0%
Despite winning 111 games during the regular season, the Dodgers’ World Series odds sit below the Astros — and the Braves too! On paper, they have a juggernaut of a team, but their deep roster is more suited to the grueling pace of a long regular season. During a short series, that depth is wasted to a certain extent. The other reason why the projection systems are discounting their chances is some uncertainty in their pitching staff. Los Angeles won’t have Walker Buehler this postseason, and Dustin May could miss the Division Series. That means leaning on Tyler Anderson and Tony Gonsolin to make critical starts. Both had phenomenal regular-season numbers, but the projections don’t fully trust them as top-tier starters, and Gonsolin only just returned after a month-long absence due to a forearm issue. There’s also some uncertainty in the bullpen, as Craig Kimbrel lost his ninth-inning role during the final month of the season. It’s never a good sign when a team enters the postseason with high-leverage roles in flux.
The Astros have fewer questions to work through. They ran away with the best record in the American League en route to their sixth consecutive playoff appearance, and the only player they’ll be missing from their roster is Michael Brantley, who injured his shoulder in June and will be sidelined until next year. To replace him, Houston acquired Trey Mancini from the Orioles at the trade deadline, though he hasn’t been able to replicate his previous success in his new digs, with a mere 77 wRC+ as an Astro. The pitching staff is once again led by Justin Verlander, who missed the team’s last two October trips. Lance McCullers Jr. will likely play a significant role as well. He injured his forearm during the 2021 postseason and was sidelined for the majority of the regular season but made eight solid starts down the stretch. Read the rest of this entry »
Ben Lindbergh and Meg Rowley banter about the beginning of the playoffs and playoff podcasting, share a few words (17:43) from the diligent author of the retiring Stephen Vogt’s exhaustive Wikipedia page, preview the four wild card series (30:54) and hype up the playoff field, meet major leaguers (1:07:25) Nate Eaton and Brian O’Keefe, and discuss two Royals firings and the coming managerial merry-go-round, plus a Past Blast (1:23:57) about 1913.
Of the 12 teams in the playoffs in 2022, only one was projected by both ZiPS and FanGraphs in the preseason as a sub-.500 team: the Cleveland Guardians. But this lone Cinderella in a sea of mean stepsisters toppled the White Sox handily this year, pulling away from the pack late to finish with an 11-game cushion in the AL Central. As the league’s No. 3 seed by virtue of winning the division, Cleveland now hosts the Tampa Bay Rays in the three-game Wild Card Series.
Broadly speaking, there are broad similarities between the Guardians and the Rays. Both play in smaller markets and, depending on how you look at the issue, have a payroll attitude somewhere on the spectrum from admirably thrifty to Ebenezer Scrooge on tax deadline day. However they got there, these teams embraced modern analytics early on, long before it was de rigeur in baseball, and have seen advantages. The Rays were the league doormat during the early, very non-sabermetric days of the franchise, but after an abrupt change in direction, they have the fourth-most wins in baseball over the last 15 years. The Guardians are not far behind.
Win-Loss Record, 2008-2022
Team
W
L
Pct
Los Angeles Dodgers
1358
970
.583
New York Yankees
1337
991
.574
St. Louis Cardinals
1289
1037
.554
Tampa Bay Rays
1267
1062
.544
Boston Red Sox
1256
1072
.540
Atlanta Braves
1225
1101
.527
Cleveland Guardians
1208
1118
.519
Milwaukee Brewers
1204
1125
.517
San Francisco Giants
1198
1130
.515
Los Angeles Angels
1195
1133
.513
Houston Astros
1179
1148
.507
Chicago Cubs
1176
1150
.506
Oakland A’s
1171
1156
.503
Toronto Blue Jays
1170
1158
.503
Philadelphia Phillies
1169
1159
.502
Texas Rangers
1159
1170
.498
New York Mets
1156
1172
.497
Washington Nationals
1143
1183
.491
Minnesota Twins
1127
1203
.484
Chicago White Sox
1120
1208
.481
Seattle Mariners
1111
1217
.477
Detroit Tigers
1108
1216
.477
Cincinnati Reds
1103
1225
.474
Arizona Diamondbacks
1096
1232
.471
Colorado Rockies
1086
1242
.466
San Diego Padres
1082
1246
.465
Pittsburgh Pirates
1063
1262
.457
Kansas City Royals
1063
1265
.457
Baltimore Orioles
1047
1280
.450
Florida Marlins
1045
1280
.449
Despite both teams regularly making the playoffs, they’ve only met in the postseason once before, in the 2013 AL Wild Card Game. Things didn’t go Cleveland’s way then, as Alex Cobb and Tampa’s bullpen combined for a shutout, causing a quick exit from October. Now Cleveland has a three-game series to get its revenge. Read the rest of this entry »
In a race for the National League batting title that ended up coming down to the final day, Jeff McNeil emerged victorious, hitting .465 (20-for-43) in his last 11 games of the season (he was a late defensive replacement Wednesday, but didn’t hit) to finish at .326, one point higher than Freddie Freeman for the highest in the majors. McNeil’s final two weeks put a bow on a career year. He finished with 5.9 WAR, 16th among major league hitters and the most by any Mets primary second baseman save Edgardo Alfonzo, who set the mark with 5.9 WAR in 1999 and then bested it with 6.4 in 2000 (of course, McNeil also spent a good chunk of time in the outfield). He started the All-Star Game at Dodger Stadium, some 100 miles from his southern California home, and now his Mets are headed to his first career postseason. It’s a good year to be Jeff McNeil.
McNeil has generated his value with a set of skills very different from those of your typical modern All-Star or 5.9-WAR player. In a home run era, he’s been as far from a power hitter as an All-Star gets. He finished 2022 with nine home runs, including two in his final three games, making him just the third player in the last decade to amass as many as 5.5 WAR without clearing the fence 10 times. He hit 23 home runs in 2019, the homer-happiest season in major league history, but even with that outlier included, he’s still gone deep in just 2.3% of his big league plate appearances.
In truth, your 2022 batting champion is among the softest-hitting big leaguers in the game, ranking in the 12th percentile in average exit velocity, the eighth percentile in hard-hit percentage, and the seventh percentile in barrel percentage. Just 13 of his 477 batted balls this season registered as barrels: Read the rest of this entry »
The 2022 season was the year to break long-standing playoff droughts. The Mariners ending their two-decade stretch of futility got the bigger headlines, but the Phillies closed out their own decade of suffering by clinching the NL’s final Wild Card berth on Monday. It didn’t come easy — under the previous playoff structure, they would have missed out on the postseason by two games — but the expanded field gives them an opportunity to make some noise in October. Their opponent will be a familiar one: the Cardinals, who eliminated the Phillies in a hard-fought Division Series the last time they were in the playoffs.
St. Louis hasn’t had to weather a lengthy playoff drought since the 1970s, qualifying for the postseason for the fourth consecutive year and winning its second division title in that span. The Cardinals also posted their third 90-plus win season in that period, with the shortened 2020 season as the only outlier. More remarkably, they haven’t finished below .500 since 2007, with 10 postseason appearances in those 15 years. As far as consistent competitors go, the Cardinals are essentially an October staple.
Team Overview: Phillies vs. Cardinals
Overview
Phillies
Cardinals
Edge
Batting (wRC+)
107 (5th in NL)
114 (3rd in NL)
Cardinals
Fielding (RAA)
-32 (14th)
17 (3rd)
Cardinals
Starting Pitching (FIP-)
87 (2nd)
102 (9th)
Phillies
Bullpen (FIP-)
91 (4th)
101 (8th)
Phillies
The Phillies’ route to their Wild Card berth wasn’t a straight one. They wandered through the first two months of the season, posting a disappointing 21–29 record, which led to the dismissal of manager Joe Girardi on June 3. But after that, they went 64–46 under interim manager Rob Thompson, the fourth-best record in the NL over the rest of the season. All that success during the summer came despite losing Bryce Harper for a significant chunk of the year. He fractured his thumb on June 25 and returned on August 26 but never truly regained his MVP form, with an 84 wRC+ over the final month and change of play.
With its superstar on the shelf, a number of Philadelphia’s veteran sluggers stepped up to lead the offense. The biggest contributor was J.T. Realmuto. As Michael Baumann covered a week ago, the veteran catcher carried the load with a 162 wRC+ in the second half, accumulating the third most WAR in that time behind Aaron Judge and Adley Rutschman. Despite his slow-ish start, Realmuto wound up posting career bests in wRC+ and WAR. Then there was Kyle Schwarber, who led the NL in home runs with 46, a surprise given his similar slow start to the season; he hit just 11 homers in the first two months of the season but exploded in June with 12 and added 23 more over the next three months.
The other big free-agent deal the Phillies handed out over the offseason hasn’t worked out as well. After posting a 122 wRC+ over the last five seasons, Nick Castellanos couldn’t find his footing in Philadelphia, slumping to a 95 wRC+, his worst year at the plate since 2015. His biggest problem was a bad case of chasing breaking balls off the plate, leading to big issues making authoritative contact. His barrel rate and hard-hit rate fell to career lows, resulting in a dismal .392 slugging percentage.
But we can’t talk about the Phillies without talking about their defense. Put simply, it’s bad. It’s not a surprise either, considering that Schwarber and Castellanos occupy the corner outfield spots. The only positive contributor in their starting lineup is second baseman Jean Segura, who graded out as a +4 in Outs Above Average this year. The Phillies’ biggest issue, though, isn’t making mistakes; they actually committed the fourth-fewest errors in the majors this year. Instead, they simply let too many batted balls find the grass, which significantly hurt their ability to prevent runs from scoring. It’s a big reason why their pitching staff posted a top-10 FIP in baseball but a team ERA that was just 18th.
Leading said pitching staff is Aaron Nola, a quiet contender for the NL Cy Young award this year. One major reason why is that the righty was able to cut his home run rate to just 9.8% this year, a huge improvement over his career rate of 13.2%. He also posted a career-low walk rate this year while still maintaining his big strikeout totals. He’ll be on the mound for Game 2 of this series. To open, the Phillies will turn to Zack Wheeler. He followed up a career year in 2021 with a season nearly as good, though he pitched 60 fewer innings. The health of his forearm was a big question mark through the end of the summer, but he managed to make it back to the mound in late September and posted three good starts to finish the regular season. If the series goes to a Game 3, Philadelphia will likely turn to Ranger Suárez, a quality starter in his own right but not up to the level of Nola or Wheeler.
Where the Phillies will lead off with their two aces, the Cardinals enter this series with less established options up top.
Ordinarily, it would be hard to imagine a Cardinals playoff series without Wainwright, but given how the final month of the season went, manager Oli Marmol may opt for hiding his veteran righty.
Cardinals Starters in September
Player
IP
K%
BB%
ERA
FIP
Adam Wainwright
28.2
9.4%
8.0%
7.22
4.37
Miles Mikolas
34
22.0%
6.8%
2.38
3.73
José Quintana
33.1
23.1%
3.3%
0.81
1.88
Jack Flaherty
28
21.6%
10.4%
3.86
4.40
Jordan Montgomery
33
23.4%
6.4%
4.36
3.90
Wainwright allowed a whopping 23 runs in his six September starts, and his strikeout and walk rates both took a turn for the worse. That performance has likely pushed him out of the picture for a Wild Card start; at best, the Cardinals could hand him the ball on an extremely short leash and have Montgomery or Flaherty ready on standby if things go south quickly.
Luckily, Mikolas and Quintana finished the regular season on strong notes; the latter, per Marmol on Thursday, will take the ball for Game 1, and the former will start Game 2, with Game 3’s starter TBD. Quintana hasn’t pitched this well since he was a member of the White Sox back in 2017 and has been even better since coming over from the Pirates at the trade deadline. Chris Gilligan looked at Quintana’s rejuvenation earlier this week and noted his transition from a pitcher who relied on strikeouts to one who induces tons of weak contact:
He has deployed his arsenal by throwing mostly outside the strike zone, elevating his fastball more and making hitters reach for curveballs and changeups. His 35.4% zone rate is the lowest in a full season of his career, around 10 percentage points lower than his typical early-career season, and the second-lowest among qualifying pitchers this year. And it’s working – he’s enticing swings on a career-high 36.2% of his pitches outside of the zone, the 10th-highest rate among qualifiers. … By drawing hitters outside the strike zone, he has significantly diminished the quality of their contact without conceding bases on balls with any sort of damaging frequency.
That leaves Montgomery, Flaherty, and Wainwright to start in a potential Game 3. Like Quintana, Montgomery holds the platoon advantage over some of Philadelphia’s more potent bats, and Flaherty’s stuff could play up in shorter outings if he were pushed to the bullpen. So the decision comes back around to what to do with Wainwright, and that’s not an easy one given how much history he has with the franchise, particularly in the playoffs.
Offensively, St. Louis has far less to worry about. Led by superstars Paul Goldschmidt and Nolan Arenado, the Cardinals had the third-best offense in the NL, scoring 4.77 runs per game. After looking like an MVP candidate for most of the season, Goldschmidt slumped a bit in September, posting a 108 wRC+ over the last month of the season, which cost him a shot at the Triple Crown after he made a run at it through the summer. Arenado, meanwhile, bounced back from a disappointing first year in St. Louis to post the best season of his career. Those two provide a fantastic one-two punch in the heart of the lineup.
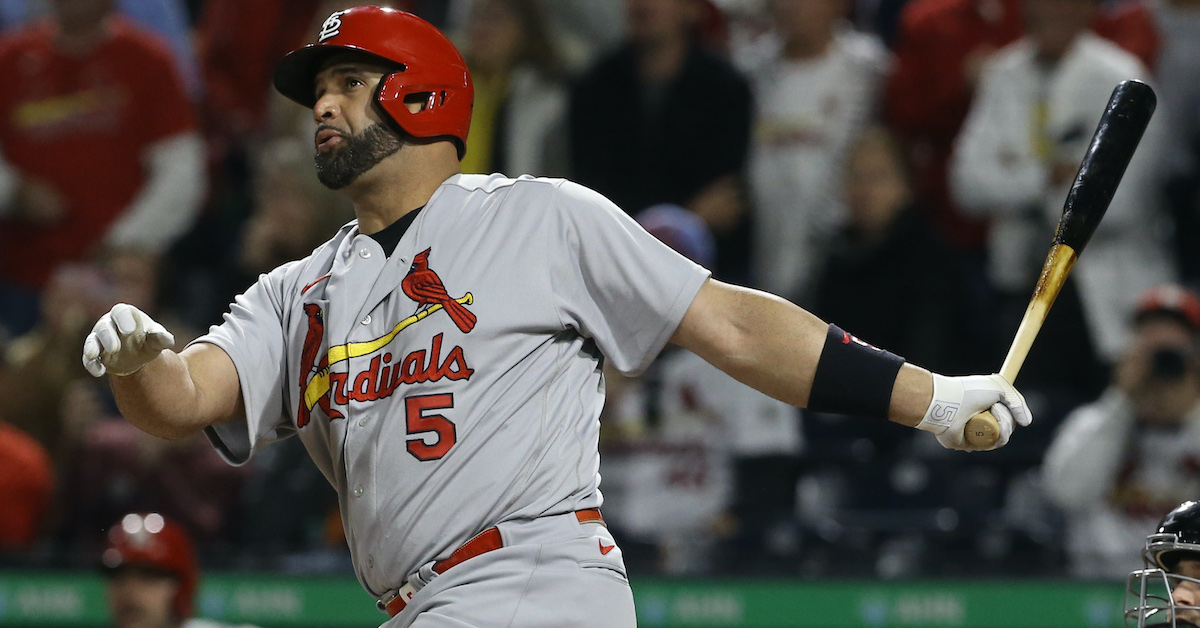
The biggest story in St. Louis, though, has to be the rejuvenation of Albert Pujols. He returned to the Cardinals for one last reunion tour after a slow and painful decline in Los Angeles but has defied time and age by becoming a key contributor as the team’s semi-regular designated hitter. He hit just six dingers during the first half of the season, but chasing his milestone 700th home run sparked a miraculous second half. He blasted 18 bombs after the All-Star break — only Judge hit more during that span — with all of his power peripherals taking a sudden turn for the better. I’m sure the Cardinals couldn’t have imagined their franchise icon leading them to the postseason again when they signed him back in the winter, but here we are.
As far as roster construction goes, these two teams found their success through very different means. St. Louis’s position group put together a cumulative 33.1 WAR, second in the NL and a testament to their quality production at the plate and phenomenal defense in the field. Philadelphia’s lineup can score runs in bunches, but the defense is atrocious. The team’s strength lies instead in a top-heavy rotation led by two of the best pitchers in the league. Also worth noting is that the Cardinals went 53–28 at home during the regular season, giving them the advantage at the outset. But these teams are more evenly matched than they appear on paper, which should make for some excellent baseball this weekend.
While the postseason drought spanning more than two decades is over, so too is the celebration in Seattle, as the Mariners travel to the other side of the continent to face the slugging, battle-tested Blue Jays, who emerged from baseball’s best division as the top wild card.
Toronto’s lineup is dangerous from top to bottom, stacked with marquee names who have thirteen combined All Star appearances (George Springer has four of his own, Matt Chapman somehow only has one). The group had the fifth-lowest strikeout rate in baseball during the regular season, ranked third in slugging, and were second only to the Dodgers in team wRC+. Except for Raimel Tapia and Whit Merrifield, every member of the Blue Jays’ regular starting lineup posted a wRC+ over 100 on the season, and Merrifield closed the season on a .361/.385/.639 heater. If Lourdes Gurriel Jr.’s hamstring is healed in time for him to be inserted in the lineup, he’s an easy offensive upgrade on Tapia, though he may not have his timing immediately due to his lack of at-bats.
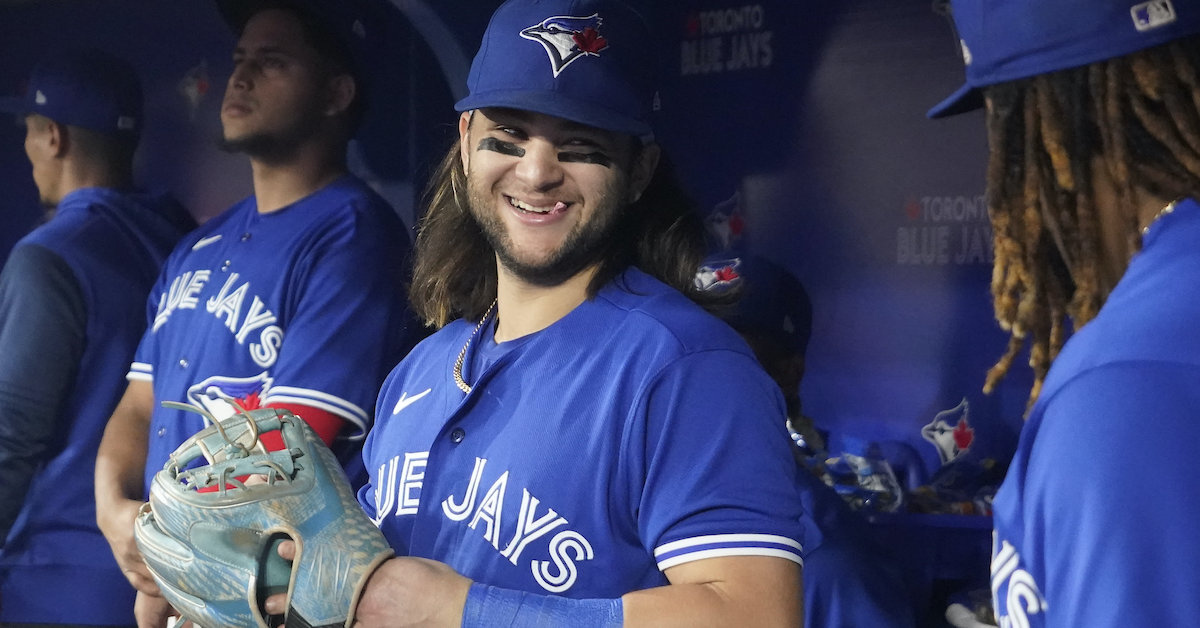
While Toronto’s lineup has undeniable star power, it may have an unexpected fault at its core. While his season, overall, was very good, Vladimir Guerrero Jr. is ice cold right now. During the last month of the season he slashed a paltry .235/.290/.390 and struggled with plate discipline. Vladdy’s chase rate during September (40%) was a full ten percentage points higher than his career norm (31%), as he struggled to lay off sliders away from him and well off the plate. Two-pitch Robbie Ray should be a great matchup for Vlad, as he doesn’t have a secondary pitch that moves away from right-handed hitters aside from an unfamiliar changeup. But the Mariners have bullpen weapons that are well-suited to exploit his recent issues in Penn Murfee, Diego Castillo, and Matt Brash, who all have sliders that finish in a spot Guerrero can’t seem to get to right now. Streaky Jays shortstop Bo Bichette has been the polar opposite, second only to Aaron Judge in WAR since the calendar flipped to September, slashing .405/.443/.664 and clubbing 19 extra-base hits during that span and entering postseason play as one of the planet’s most dangerous hitters. Read the rest of this entry »
These projections differ from the in-season projections in a few important ways. Where regular season projections are generally geared more towards a macro view of a team’s fortunes, when we get to the playoffs and have an idea of individual matchups, we can shift to more micro-level projections that reflect the very different ways players are used during the postseason. The ZiPS game matchup tool has a built-in lineup estimator that projects every pitcher’s and batter’s line against every other pitcher and batter, so there is no need to look at a team’s generalized offensive strength. We also use what I call the “full-fat ZiPS” rather than the simpler in-season model; the latter is necessary given the realities of daily updates, but isn’t come October. For some players and teams, this makes a difference. For instance, when all of the Statcast and similar data are baked in, ZiPS likes the Guardians more than it would using the in-season version.
For 2022, I’ve refined my model of bullpen usage, and ZiPS also now does a better job projecting the probability of a close game, which changes the odds of each pitcher being used. Read the rest of this entry »
Despite spending 175 of the season’s 182 days atop the NL East, building a 10.5-game lead by the end of May, and winning 101 games, the New York Mets lost out in the division race to a red-hot Atlanta Braves team that has played at a .696 clip since the start of June — and lost out via a tiebreaker, a 10-9 season series disadvantage. Now they’ll have to take the long route through the new postseason format, one that includes a potential matchup with the top-seeded, 110-win Dodgers if they advance beyond the Wild Card Series.
That can’t be taken for granted. Even with Max Scherzer and Jacob deGrom available to start in this best-of-three series, all of which will be played at Citi Field, they can’t overlook the Padres, who can offer some top-notch starting pitching themselves and who beat the Mets in four of the six meetings between the two teams. Not that such results are predictive — and it’s worth noting that the aforementioned pair combined for one start in the six games (Scherzer in a 4-1 loss opposite Yu Darvish on July 22) — but they do illustrate the range of possibilities here. The ZiPS Playoff Odds pegged this as the biggest mismatch of the Wild Card round, narrowly edging out the Mariners-Blue Jays series, but with the Padres still having a 42.4% chance of scoring an upset.
Both deGrom and Scherzer looked all too human last weekend during the Braves’ division-s(t)ealing sweep, combining to allow five home runs and seven runs in 11.2 innings. If there’s good news, it’s that manager Buck Showalter didn’t have to send deGrom to the hill in Game 162 in hopes that the Mets would win and the Braves would lose, because that would have ruled him out of the Wild Card round had they lost. Read the rest of this entry »
Cal Quantrill epitomizes the term “pitcher.” Twenty-seven years old and in his fourth big-league season, the Cleveland Guardians right-hander not only attacks hitters with a multi-pitch arsenal, he does so with a combination of aggressiveness and guile. Mixing and matching with aplomb, he’s won 23 of 32 decisions and logged a 3.16 ERA in 336 innings over the past two seasons. As my colleague Michael Baumann pointed out just last month, Quantrill isn’t overpowering, but he gets the job done.
Drafted eighth overall in 2016 by the San Diego Padres out of Stanford University, Quantrill was acquired by Cleveland at the 2020 trade deadline as part of the nine-player Mike Clevinger deal. He’s expected to start against the Tampa Bay Rays on Sunday if their Wild Card Series requires a deciding Game 3.
Quantrill discussed his evolution as a pitcher and his it’s-all-about-getting-outs approach this past weekend.
———
David Laurila: We discussed your repertoire in spring training of 2018 when you were in the Padres system. How have you changed as a pitcher since that time?
Cal Quantrill: “If we’re looking at it from a literal standpoint, I flattened out the slider and turned it into a cutter. I went to more of a 50/50 mix with the two-seam and four-seam. I’ve kind of kept a little curveball wrinkle to keep them off the hard stuff. Read the rest of this entry »
Who was the Nationals’ best player in 2022? Before you try to answer, I should acknowledge that this is not a fair question to ask. For starters, it’s a trick question. More importantly, you haven’t been watching the Nationals. You’ve been doing the best you can to avoid even thinking about the Nationals. That’s called self-care, and I commend you for it. Even the Nationals’ general manager called it “a daily grind to come here and lose baseball games.” He also called trading Juan Soto a “courageous move by ownership,” so maybe don’t listen to him.
Regardless, go ahead and give it a shot! Keibert Ruiz would be a reasonable guess. The promising young catcher posted 1.7 WAR this season. You could also be forgiven for going with Joey Meneses, who put up 1.5 WAR in just 228 plate appearances since his promotion in August. Read the rest of this entry »