Effectively Wild Episode 2357: Pinstriped Panic


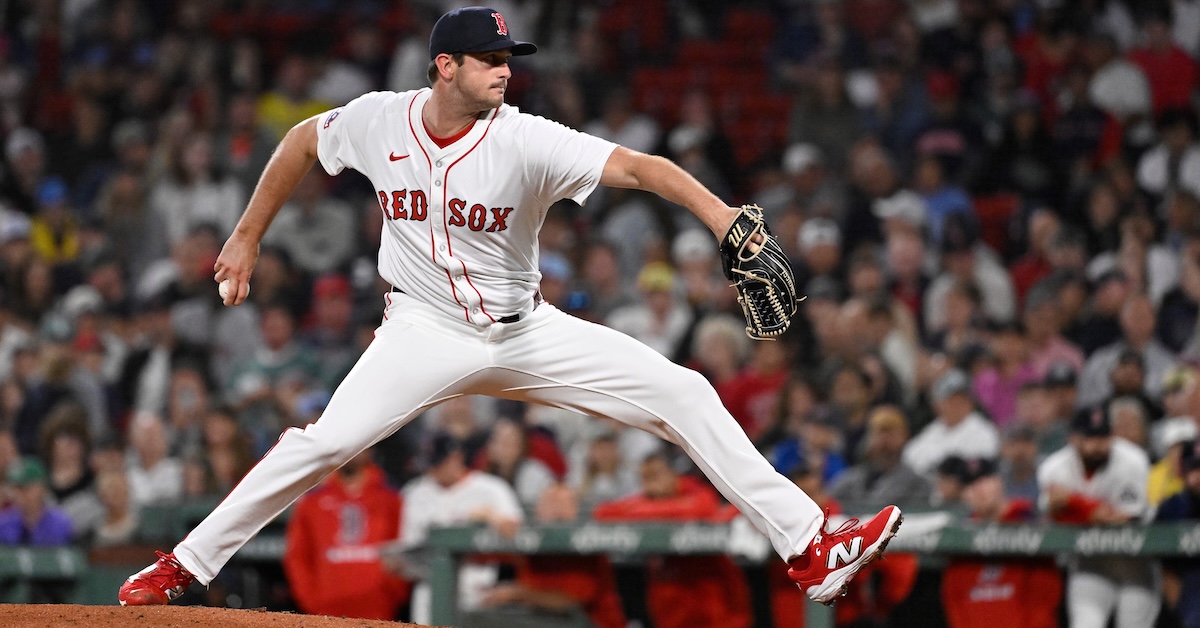
Ben Lindbergh and Meg Rowley banter about umpire Jen Pawol’s promotion to the majors, whether the MLB Speedway Classic lived up to its name, Nathan Eovaldi’s Gibsonian season, another big blow to the practice of pitcher hitting, a “breakout” question, an optimistic Twins take, the Yankees’ concerning (to Yankees fans) slide, Roman Anthony’s extension, whether MLB’s playoff picture is boring, Andrew Vaughn’s hot hitting, and the accuracy of a baseball scene on The Gilded Age.
Audio intro: Ian Phillips, “Effectively Wild Theme”
Audio outro: Liz Panella, “Effectively Wild Theme”
Link to Rockies comeback
Link to Pawol news
Link to Speedway Classic problems
Link to Speedway Classic record
Link to Gibson/Eovaldi stat
Link to Central League news
Link to Central League stats
Link to Ben on pitcher hitting
Link to Adell breakout post
Link to Sheehan on the Twins
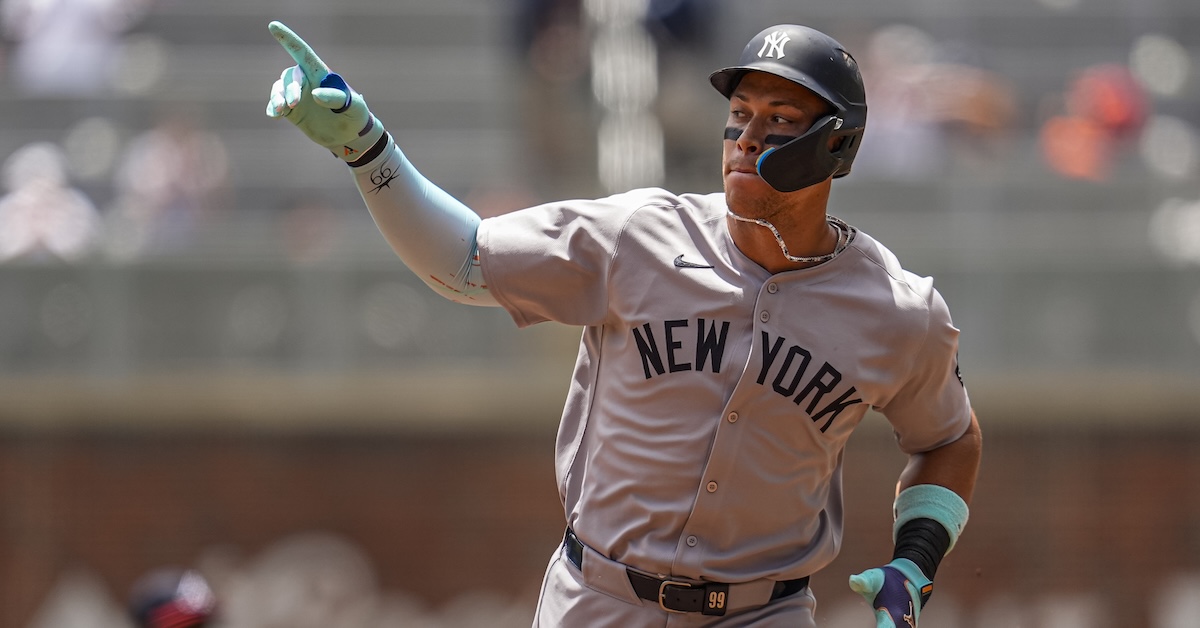
Link to Paine on the Yankees
Link to BaseRuns records
Link to FG playoff odds
Link to team baserunning
Link to team defense
Link to Sam on hustle
Link to Ben on hustle
Link to team wins since June 1
Link to MLBTR on Anthony
Link to Vaughn leaderboard
Link to Davy on the playoff odds
Link to TGA question
Link to TGA episode
Link to Richard’s Strike Four
Link to SP FIP stat
Link to notable episodes list
![]() Sponsor Us on Patreon
Sponsor Us on Patreon
![]() Give a Gift Subscription
Give a Gift Subscription
![]() Email Us: podcast@fangraphs.com
Email Us: podcast@fangraphs.com
![]() Effectively Wild Subreddit
Effectively Wild Subreddit
![]() Effectively Wild Wiki
Effectively Wild Wiki
![]() Apple Podcasts Feed
Apple Podcasts Feed
![]() Spotify Feed
Spotify Feed
![]() YouTube Playlist
YouTube Playlist
![]() Facebook Group
Facebook Group
![]() Bluesky Account
Bluesky Account
![]() Twitter Account
Twitter Account
![]() Get Our Merch!
Get Our Merch!
Podcast (effectively-wild): Play in new window | Download
Subscribe: RSS