Robbie Ray Finds the Strike Zone

When Robbie Ray walked Freddie Freeman in the first inning of his start on Tuesday evening, it was the first time he had walked a batter since April 18, ending a 20.2-inning stretch without allowing a free pass. That’s quite an accomplishment for someone who has always been known for his elite strikeout abilities and a serious lack of control. Ray’s career walk rate sits at 10.9%, a touch above league average, but over the last four years, it’s ballooned to 12.3% and reached a career worst 17.9% last year. But across six starts this season, his walk rate has fallen to 7.2%, easily a career best.
As you’d expect with such a drastic change in his control, Ray has started pounding the zone this year.
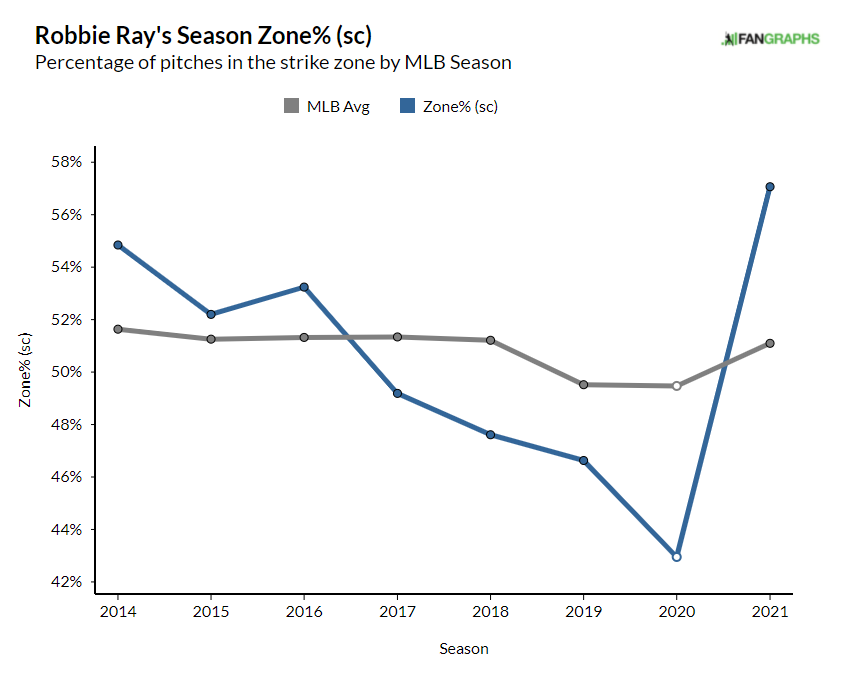
In 2020, he was tied with Shane Bieber for the lowest Zone% among all pitchers with at least 50 innings pitches at 42.6%. This season, he’s among the league leaders in Zone%, at 56.7%. During the pitch tracking era, that’s the largest increase in Zone% from one season to the next by a wide margin.
| Player | Seasons | Zone% Δ |
|---|---|---|
| Robbie Ray | 2020-2021 | 14.1% |
| Matt Albers | 2010-2011 | 12.9% |
| Randall Delgado | 2012-2013 | 12.0% |
| Aaron Nola | 2020-2021 | 10.5% |
| Luis Avilán | 2017-2018 | 10.2% |
| Aroldis Chapman | 2015-2016 | 9.9% |
| Jeff Gray | 2011-2012 | 9.8% |
| Ryan Weber | 2015-2016 | 9.7% |
| Shane Greene | 2014-2015 | 9.6% |
| Luis Castillo | 2019-2020 | 9.5% |

 Dan Szymborski
