Athletes like Elly De La Cruz can skew our perception of reality. His powerful arm makes most shortstops look like they throw with a wet noodle. His 99th-percentile sprint speed makes most other baserunners look like they’re running on sand. His tall frame, which our website somehow lists at 6-foot-2, makes that guy on Hinge who claims he’s 6-foot-2 look like he’s actually 5-foot-8. Oh, and his 13 steals of third base this year might make you think steals of third are at an all-time high, which couldn’t be further from the truth.
As a fan of highly specific baseball stats – a bold statement to make on this website, I know – I like to check in on the stolen base rates at each bag. Practically speaking, that means I pay particularly close attention to steals of third, the oft-forgotten middle child of stolen bases. Steals of third are too common to receive the same amount of attention as steals of home; at the same time, they’re infrequent enough that they’ll always be overshadowed by the sheer number of second-base steals. Steals of home are almost guaranteed to make tomorrow morning’s highlight reel. Steals of second outnumber all others and thus dictate league-wide stolen base trends every year. Steals of third are stuck in the middle, and that’s especially true this season as their siblings are taking even more of the glory than usual.
The stolen base success rate at home (16-for-29, 55.2%) is the highest it’s been since at least 1969. Indeed, it’s above 50% for only the second time in that span. In addition, runners are on pace to steal home 36 times this year, which would rank second in the divisional era and well within shouting distance of first (38 SBH in 1998). Meanwhile, the overall stolen base rate (i.e. steals per game) is also on the rise, primarily driven by an increase in steals of second. The league is on pace to steal second base 166 more times in 2024 than it did last year, a 5.6% increase, as runners continue to test the limits of the New Rules™. Read the rest of this entry »
There is no doubt the Milwaukee Brewers have outperformed expectations in 2024. Although they won the NL Central just last season and made the playoffs in five of the last six years, they were hardly postseason favorites on Opening Day. On the contrary, they were the only 2023 division winners that the majority of our staff did not pick to repeat as division champs; just four of the 25 participants in our preseason predictions exercise picked the Brewers to make the playoffs in any capacity. The only NL Central team with less support was the Pirates. Meanwhile, our playoff odds were only slightly more optimistic about Milwaukee’s chances. The Brewers had 18.1% odds to win their division and a 30.0% chance to make the postseason on Opening Day.
Sixty-seven games have passed between now and then, and over those 67 games, the Brewers have become the indisputable frontrunners in the NL Central. What once seemed like it would be the most closely contested division in the league – all five teams were projected to finish within 2.3 games of one another on April 14 – has become Milwaukee’s to lose. The Pirates, Cubs, Cardinals, and Reds are all smushed within half a game of one another, but the Brewers rest atop with a comfortable 6.5-game lead. Their divisional odds are up to 63.0%; their playoff odds, 78.6%. In the NL, only the three powerhouse clubs, the Phillies, Dodgers, and Braves, are more likely to play in October. Read the rest of this entry »
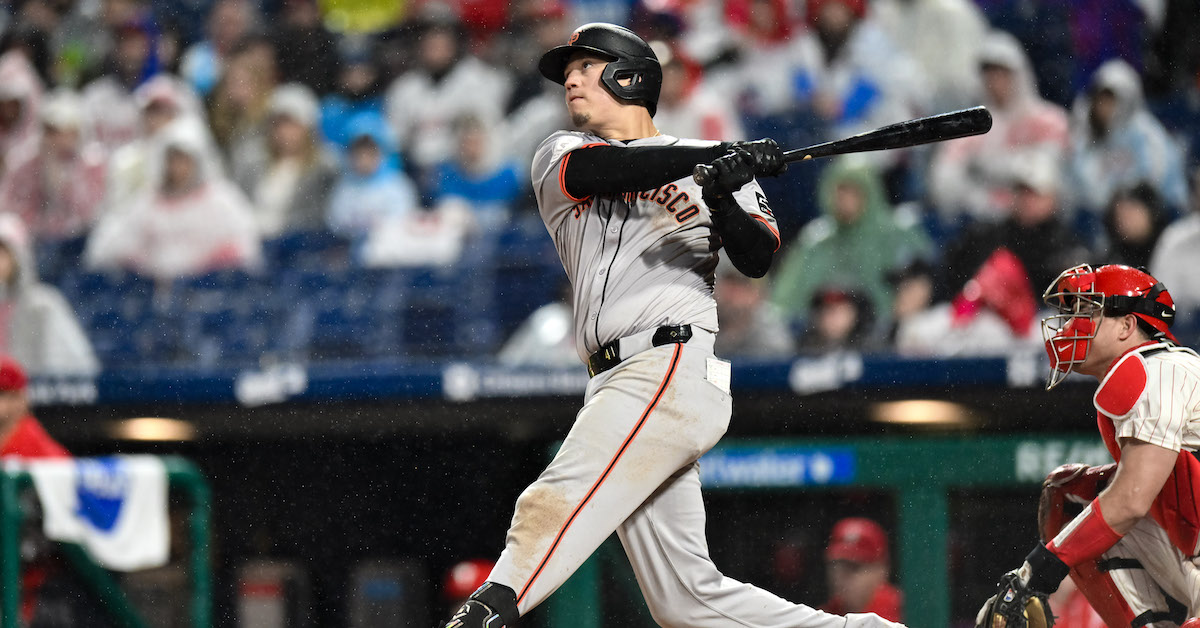
Last year, Kyle Schwarber became the first player in MLB history to drive in more than 100 runs (104, to be exact) in a season with a batting average below .200. He was also the first player to hit 40 home runs (he hit 47), score 100 runs (he had 108), or draw at least 120 walks (he drew 126) despite getting a hit in fewer than one-fifth of his at-bats. The fact that he finished tied for third in the NL in plate appearances (720) certainly helped him compile those counting stats – no other hitter has ever topped 650 PA with an average so low – but there was no denying that Schwarber was a valuable offensive player despite his league-worst .197 batting average. He became the second qualified, sub-.200 hitter in history to post an OPS above .800 and came just shy of beating 2021 Joey Gallo for the highest-ever wRC+ in a qualified, sub-.200 season; Gallo finished that year at 121, while Schwarber was at 119 in 2023.
When I hear those fun facts, my inclination is to celebrate Schwarber and his unusual accomplishments. Sure, he’d be a better ballplayer if he could bat .300 and still club 40-plus homers and draw 120-plus walks, but that’s not really saying anything. Just as chocolate cake would be better if it were chocolate cake with ice cream, Schwarber would be better with Luis Arraez’s batting average. That’s not analysis; it’s a Facebook graphic asking you to build your dream hitter with $15. The fact of the matter is that Schwarber is excellent at what he does, batting average be damned.
Unfortunately, not everyone is so inclined to focus on the positives. When Schwarber himself spoke about his season last September, he couldn’t help but lament his low batting average: “Heck, do I like seeing a .193 [batting average]? No. Do I wish I was hitting higher? Absolutely.”
Schwarber elaborated this spring, telling Scott Lauber of the Philadelphia Inquirer, “If you’d have told me I was going to hit .190-whatever and hit 47 bombs and drive in 100, score 100, and punch out 200 times, I would’ve said you’re crazy. But it happened, right? I lived it.”
In Lauber’s words, the slugger spent the winter “figuring out how to never, ever live it again.” To be clear, Schwarber understood that he was still productive at the plate last season, but he wanted to be more than a three-true-outcomes player. As he put it: “I just know that there’s more [of a] hitter in there.”
I hate to destroy the illusion of my journalistic objectivity, but I must admit the Phillies fan in me was scared by Schwarber’s comments. Except for Bryce Harper, who because of injuries played just 225 of the team’s 324 regular season games across 2022 and ’23, Schwarber was probably Philadelphia’s most dangerous bat over his first two seasons in the City of Brotherly Love. He didn’t need to change. Call me a metathesiophobic, but when it comes to a 31-year-old, nine-year veteran, I say if it ain’t broke, don’t fix it.
Yet, 60 games into the year, it certainly seems like Schwarber’s offseason efforts are paying off. His TTO% is lower (50%, down from his league-leading 53.8% in 2023) and his batting average is significantly higher than last year’s .197. In fact, his .239 batting average is only a tick below league average. Among qualified players from 2023 and 2024, only seven have seen a higher year-over-year increase. What’s more, Schwarber’s overall numbers haven’t taken a hit like I worried they would. He is enjoying another strong season at the plate with a .341 wOBA, .356 xwOBA, and 122 wRC+, all of which place him among the top 25 qualified batters in the National League.
All that being said, I haven’t seen enough to allay my preseason fears. The best way for a hitter to reduce his TTO% and increase his batting average is to cut back on strikeouts and make more contact, but that’s not what Schwarber has done. He has struck out in 29.5% of his plate appearances, right in line with his 29.9% rate last season, and his 34.1% whiff rate is a career high. Instead, the 2022 NL home run leader is sacrificing long balls for base hits. If you’re familiar with the basic rules of baseball, you’ll see why that’s a problem: The farther you make it around the bases, the better.
Schwarber is on pace for 30 home runs this year. He hit 47 last year and 46 the year before. He crushed 32 home runs during an injury-shortened 2021 campaign. Thirty homers is nothing to scoff at, but Schwarber is sending the ball out of the park at the lowest rate of his career. The same is true for doubles and, thus, extra-base hits overall. He is currently averaging an extra-base hit once every 17.3 plate appearances; his career pace entering the season was once every 10.2 PA. To be fair, power is down across the league this season; the league-average isolated power (.147) has never been lower since Schwarber debuted in 2015. Even so, his career-low .170 ISO this season is only 20% higher than league average. That’s a big step back for a slugger whose career ISO (.259) is 56% better than that of the average hitter. Similarly, his .408 slugging percentage, which would be the lowest full-season mark of his career, is only 5.4% above average. For his career, his .486 slugging is 17.7% better than the average hitter in that span.
Without the context of Schwarber’s preseason comments, the simplest explanation for his dropping power numbers might be age-related decline. However, the poster boy of the Phillies’ “ball go boom” lineup has not lost a lick of strength. His 54.9% hard-hit rate, a new career high, places him among the top 10 qualified batters in the sport. And although we can’t compare his bat speed to previous seasons, the fact that it sits in the 99th percentile makes me pretty confident he has not entered his decline phase quite yet.
Another explanation for Schwarber’s low home run rate could be his typical streakiness. He has a reputation for heating up later in the season, specifically during June, August, and September. He had a 95 wRC+ through the end of May in 2023 and a 102 wRC+ through the end of May the year before. However, his extra-base hit rate was still significantly higher during the first two months of 2022 and ’23 than it is right now. He averaged an extra-base hit once every 12.5 PA in March/April/May during his first two seasons with the Phillies; as a reminder, that number is one extra-base hit every 17.3 PA so far this year.
Instead of representing a step back or a slump, this looks like a deliberate adjustment on Schwarber’s part. Although his hard-hit rate is higher than ever, his barrel rate is a career low. His launch angle sweet spot rate is the lowest it’s been since 2020, the worst season of his career. On a related note, his groundball rate (39.6%) is significantly higher than it was during his first two seasons with the Phillies (33.8%), while his fly ball rate is significantly lower (down from 50.3% to 42.4%). Among qualified hitters from the past two seasons, he has seen the eighth-largest decrease in fly ball rate. According to a recent piece by Phillies beat writer Alex Coffey, Schwarber’s teammates and coaches have started joking that “he’s a slappy leadoff hitter now.”
For what it’s worth, Schwarber has been a better groundball hitter this season than in years past, and I can’t say I’m surprised. He’s a talented hitter, and I didn’t doubt he could change his approach if he wanted to. He said he was going to improve his directional hitting this year, and he has done exactly that, pulling fewer groundballs in favor of sending them up the middle, and he is making more hard contact on those groundballs. It’s further evidence that he’s hitting more grounders with intention, but hey, at least it’s working. Except… his BABIP on groundballs is absolutely, undeniably, without a doubt unsustainable. The league average BABIP on groundballs this season is .242. Schwarber’s career mark entering the year was .204. So far in 2024, he is running a .368 BABIP on the ground. That’s not to say Schwarber has merely been getting lucky; his .246 xBA is actually slightly higher than his actual batting average. However, he can’t keep this up. No one can maintain a BABIP on groundballs this high, especially not such a slow runner. Schwarber is due for some regression, and it when comes, he won’t be able to continue replicating his past production with his new approach.
Another thing Schwarber wanted to improve this season was his consistency. He didn’t want to prop up mediocre performances in April, May, and July with strong showings in June, August, and September. Unfortunately, baseball is inherently volatile, and he might be about to learn that BABIP is even more fickle than home run-to-fly ball ratio.
I tend to think consistency and well-roundedness are overrated. Schwarbombs, on the other hand, are a thing of beauty. Including the postseason, no batter crushed more no-doubters last season than Schwarber. Indeed, thanks to his power stroke, he has been the author of some of the most exciting moments in recent postseason memory. A common criticism of the three true outcomes is that they make baseball less interesting, aesthetically speaking. However, that criticism is more relevant for the sport as a whole, rather than specific batters. On an individual level, TTO hitters are part of the diverse landscape of players that make the sport so wonderful. As Michael Baumann put it, “One of the beautiful things about baseball, or any sport, is the emergence of varied and seemingly contradictory paths to success.”
If Schwarber continues to produce like a top 30 hitter in the National League, I doubt the Phillies will complain about his new path to success. That said, as he strives to become a jack of all trades, he runs the risk of devolving into a master of none. For the sake of his slash line – and the sake of Schwarbombs – he might be better off going back to his old ways.
We knew the best hitter in baseball this year would be a multi-positional talent. We knew he would play for one of the top teams in the league. We knew the value of his contract would begin with the words “seven hundred” and the first syllable of his last name would be a source of complex carbohydrates. What we didn’t know is that it would be Guardians catcher/outfielder/first baseman/third baseman/DH David Fry, who is making $741,100 this season and currently leads the majors (min. 50 PA) in OBP (.488), OPS (1.079), wOBA (.459), and wRC+ (204).
The Brewers took Fry in the seventh round of the 2018 draft, eventually sending him to the Guardians during the 2021-22 offseason as the player to be named later in a trade for right-hander J.C. Mejía. Fry had first appeared on the Brewers’ top prospect list ahead of the 2020 season, when Eric Longenhagen ranked him 24th in a weak system, noting the positional flexibility that made him “an interesting potential bench piece.” That assessment largely stuck as Fry rose through the minor leagues (and switched organizations), although he was downgraded from a 40 FV to a 35+ FV in 2021 and eventually fell out of the Guardians’ top 50 ahead of the 2023 season. Eric tweaked his evaluation that year, subtly downgrading Fry from “interesting potential bench piece” to “interesting 26th man candidate.” It was a fair assessment at the time; Fry was roughly a league-average hitter in his first full season at Triple-A (105 wRC+). Entering his age-27 campaign, there wasn’t much reason to bet on his upside.
Yet, Fry was hard to ignore during his first full spring in big league camp in 2023. He bookended that spring training with home runs in his first and last at-bats and hit well in between, too, finishing with a 154 wRC+ in 19 games. Although he didn’t make the Guardians’ Opening Day roster, he surely made a good impression; after a solid month back at Triple-A, he earned his call to the show. Playing catcher, first base, corner outfield, and a little bit of third (with a couple of pitching appearances to boot), Fry showed off his versatility while hitting well enough (106 wRC+) to collect major league paychecks for the rest of the year. Entering 2023, ZiPS projected a .291 wOBA from Fry, and he boosted that projection to a .306 wOBA before the start of this season. Nobody would call his performance last year a breakout, but he put himself on the inside track to play a role for Cleveland once again in 2024. Read the rest of this entry »
The catcher pickoff is one of my favorite plays in baseball. It’s impressive almost every single time. Not only do backpicks call for remarkable agility and arm strength on the catcher’s part, but they also require a Holmesian ability to read the diamond. Are any runners getting cocky? Is the defense ready for a pickoff throw? Can the team risk a throwing error? The catcher needs to make those decisions rapidly, all while still performing his regular duties behind the plate. It’s not easy.
To that point, I like catcher pickoffs so much because they’re a nice reminder of the level of talent on display in professional baseball. In all my years of childhood rec league play, I never saw a catcher pull off a backpick. I don’t think I ever saw anyone try. The chances of success were too low, and the risk of a catastrophic error was too high. Catcher pickoffs are better left to the professionals. Yet this year, even the professionals are leaving them to someone else.
Here is a supercut of every catcher pickoff so far in the 2024 season. You might notice there aren’t many:
According to the records at Baseball Reference, there have been a total of seven catcher pickoffs this year. Just past the quarter mark of the season, that puts the league on pace for 26 backpicks in 2024. Last year, there were 49. In each of the previous two seasons, we saw 51. Over the last two decades, there has never been a full season with fewer than 41 catcher pickoffs. The numbers are, perhaps, even more dramatic if you remove cross-listed pickoff/caught stealing plays. There have only been five pure catcher pickoffs this year, putting the league on pace for just 19 by season’s end:
Catcher Pickoffs Are Way Down
Year
All Catcher Pickoffs
Full-Season Pace
Pure Catcher Pickoffs
Full-Season Pace
2024
7
26
5
19
2023
49
49
34
34
2022
51
51
40
40
2021
51
51
40
40
2020
17
46
15
41
2019
67
67
50
50
SOURCE: Baseball-Reference
In 2023, the league leaders in catcher pickoffs were Keibert Ruiz (6), Patrick Bailey (4), and Francisco Alvarez (4). In 2022 and ’23 combined, the leaders were Ruiz (10), Jose Trevino (7), and Elias Díaz (6). While three of those five catchers have spent time on the IL this season, that group has still combined to catch 933.1 innings over 115 games. That’s nearly equivalent to a full season of work behind the dish. They have yet to pick off a single runner.
Here’s another fun way to think about how few catcher pickoffs we’ve seen in 2024. So far this year, there have been more successful steals of home plate (9) than successful catcher pickoffs (7). That’s partly because steals at home are up, but still, this simply doesn’t happen. Like, ever:
Data via Baseball Reference
Entering the 2023 season, I thought we might see an uptick in backpicks. I was hardly alone. Willson Contreras, one of the greatest backpick artists of his generation, took note of the fact that the new disengagement rules did not limit catcher pickoff attempts. He said the Cardinals would have to be “smart” regarding “when our catchers backpick runners.” Manager Oliver Marmol sang a similar tune, praising his new catcher’s pickoff abilities. He said Contreras would “play a big part” in preventing runners from “stretching out” their primary and secondary leads. More catchers, such as Sean Murphy (“Yeah, that means we’ll throw more”), and managers, including Gabe Kapler (“We’re emphasizing backpicks”), made similar remarks.
A few months into the 2023 season, Kiri Oler looked at the data and concluded that “the numbers suggest catchers could be throwing behind runners significantly more in the name of keeping runners on edge.” She found that backpicks were a much more effective tool for discouraging stolen bases than traditional pitcher pickoff throws. Yet, if catchers were throwing behind runners any more often, they weren’t earning any more pickoffs. League-wide catcher pickoff totals were remarkably consistent from 2021 to ’23. Now, in the second season under the new disengagement rules, catcher pickoffs are disappearing.
This disappearing act is especially noteworthy considering average catcher pop times have gotten quicker in recent years (at least as of Ben Clemens’s piece on the stolen base rate from last month). What’s more, it’s not as if runners have been extra cautious on the bases this season; if anything, it’s the opposite. The stolen base attempt rate is slightly up, while the stolen base success rate is slightly down. Similarly, runners are making outs on base (OOB) and taking extra bases (XBT%) at similar rates to last season, according to Baseball Reference.
Most interestingly, the decline in catcher pickoffs has not resulted in fewer pickoffs overall. Ninety-nine runners have been picked off this season, putting the league on pace for 368 pickoffs by the time the calendar flips to October. That would be the highest total in a single season since 2012. Needless to say, this means pitcher pickoffs are on the rise. If current trends hold, pitchers alone will finish the season with more pickoffs (342) than pitchers and catchers combined in 2023 (341). Pitchers have not surpassed the 300-pickoff mark since 2012; they’re on pace to smash past that threshold in 2024.
On the one hand, it makes sense that pitchers would improve their pickoff throws with a full season of new disengagement rule experience under their belts. That said, it stands to reason that runners, too, would get better at making the most of the new rules. A recent article from The Athletic noted that “stolen-base percentages actually went down with each pickoff attempt last season, perhaps because baserunners were not yet attuned to exploiting the new rules. This season, runners are taking fuller advantage. According to STATS Perform, the stolen-base percentage after zero pickoff [attempts] is .77 percent. After one, it’s .81. After two, .87.”
Thus, while pitchers are getting better at picking off runners, the penalty of a failed pitcher pickoff attempt has increased. That being so, you might think catcher pickoffs would rise as a result. Runners’ taking more aggressive leads provides the opportunity, while the disengagement limit for pitchers provides the motive. The case is solid. Nevertheless, things certainly haven’t played out that way. What’s up with that?
Perhaps it isn’t really about the pickoffs, at least not directly. Instead, catchers might simply be placing greater emphasis on a different aspect of their game: framing. Teams knew pitch framing was important long before they had any metrics to quantify it. Now that we have the numbers, framing is more in vogue than ever. As a result, it’s likely teams are prioritizing framing over other strategies (i.e. pickoffs) in spring training, game plans, and the moment. I’ve already described how difficult a backpick can be. Now imagine trying to pull one off while simultaneously attempting to steal a strike. It’s all but impossible. If anything, I’d think backpicks have the opposite effect; pitches in the strike zone are probably more likely to be called balls on catcher pickoff attempts. Indeed, Noah Woodward found just that in a piece for his Substack, The Advance Scout. Woodward also suggests that the one-knee-down catching stance, known to help with pitch framing, makes it harder for catchers to pull off backpicks. As this catching setup rises in popularity, it makes sense that we would see fewer catcher pickoffs.
Good pitch framing isn’t nearly as exciting as a successful backpick, nor is an extra called strike nearly as beneficial as a pickoff. Ultimately, however, there’s more value to be gained from framing than backpicks over the course of the season. If a catcher can only do one or the other, it’s not hard to see why framing wins out. Even Willson Contreras seems to agree. Contreras recorded 28 pickoffs from 2016-22 with the Cubs. Throwing behind runners was his signature skill. Yet, ever since he signed with the Cardinals – who encouraged him to work on his framing and switch to a one-knee-down position – he has not picked off a single runner. The evidence may be circumstantial, but it’s still compelling.
If catchers are really letting pickoffs fall by the wayside in an effort to steal more strikes, it’s worth remembering that pitchers are picking up the slack. In other words, it might be a win-win. Since the disengagement limits were introduced, pitchers have been picking runners off with greater efficiency than before. That means pitcher pickoff attempts are less detrimental than we might have thought. Meanwhile, catcher pickoff throws still come with significant risk attached; as Kiri explained in her piece last year, the probability of an error is significantly higher on a catcher pickoff throw than a pitcher pickoff throw. Furthermore, while each pitcher disengagement marginally increases the chances of a successful steal, a throwing error all but guarantees the runner an extra base. Therefore, if pitchers can successfully pick runners off at a high enough rate, pitcher pickoff throws might be a safer option for the defense than backpick attempts. Hence the win on both fronts; catchers can be more efficient when they focus on framing over pickoffs, and pickoffs might still be more efficient coming from pitchers rather than catchers.
It will take a lot more data before we can say with any certainty that catchers are truly moving away from backpicks. After all, we’re only seven weeks into the season. Moreover, catcher pickoffs are always so low in number that the league-wide backpick pace could skyrocket quickly. But hey, if we always waited to write about trends until they were undeniable, we wouldn’t be doing a very good job telling the story of the season as it plays out. Pickoffs, both the catcher and pitcher variety, are something to keep a close eye on for the rest of the year. That shouldn’t be hard to do — pickoffs are pretty fun to watch.
Jeremy Peña is off to an excellent start. He’s also been one of the least productive hitters in baseball. How’s that for a lede?
If I told you that without any additional context, perhaps you’d think Peña was struggling at the plate but making up for it in the field. Yet, the former Gold Glove winner currently has -2 OAA and -5 DRS on the season. So much for that theory. Much to the contrary, Peña is on fire at the plate. Over the first six weeks of the 2024 campaign, he is batting .313 with a 129 wRC+. And while his .351 BABIP is likely unsustainable, his .327 xBA ranks second among qualified American League batters. His .363 xwOBA ranks in the 80th percentile, a big step up from his .305 xwOBA (22nd percentile) in 2023. Most impressive, he has cut his strikeout rate down to just 14.0%, ninth lowest in the AL. His strikeout rate has improved from the 30th percentile in his 2022 rookie campaign to the 61st percentile last season, and now it sits in the 92nd percentile in year three.
However, if you glance up from those percentiles on Peña’s Baseball Savant page, you might be surprised by the most important number of them all: His batting run value is zero. The line on the value spectrum is the faintest shade of blue, sitting about a quarter of an inch closer to “poor” than “great.” That doesn’t seem right. Indeed, out of 485 batters to see a pitch this year, Peña is the only one with a wOBA and xwOBA above .350 and a negative batting run value, according to Savant. It’s not hard to understand why he’s an outlier. Typically, when a player is hitting anywhere close to as well as Peña, he provides at least some positive value to his club.
Metrics like wOBA and xwOBA are context neutral, while Baseball Savant calculates run value by considering the runners on base, the number of outs, and the ball and strike count for each discrete event. If you take that general methodology a step further and also consider the inning and the score, you get a statistic like Win Probability Added (WPA) – although Peña might ask that we please, please stop taking the methodology a step further. According to WPA, Peña has cost the Astros far more than he has given back in 2024. Houston ranks second to last in the AL with -3.82 offensive WPA this season. Peña (-1.03) is responsible for more than a quarter of that negative WPA. Only two players have contributed to the team’s misfortunes more than Peña: the now-optioned José Abreu and a deeply slumpingAlex Bregman. Read the rest of this entry »
In the modern game, pinch-hitting is seen as something of a lost art. This likely started with teams prioritizing roster spots for extra bullpen arms over spare position players. With that came a heavier emphasis on positional flexibility off the bench, rather than plus contact skills (think Ross Gload) or a big bopping bat (à la Matt Stairs). As an angry Facebook commenter might tell you, it’s one more way that sabermetrics has ruined America’s pastime. Yet, the numbers bear it out; the best arm is often a fresh arm, while conversely, fresh bats off the bench tend to perform significantly worse than their counterparts in the starting lineup. Ahead of the 2020 season, Ben Clemens found that the pinch-hitting penalty, first theorized in 2006, still held 14 years later. Contemplating Ben’s findings, Patrick Dubuque of Baseball Prospectuspenned a line that stuck deep in my brain: “Pinch-hitters are just difficult to justify, except when they’re mandatory.”
Pinch-hitters were mandatory far less often in 2020 after the universal DH came into play. However, the age of the universal DH is also the age of expanded rosters and pitcher limits, and those new roster rules may just have saved the pinch-hitter from a slow demise. Pinch-hitters are rarely mandatory anymore, but they haven’t disappeared as much as you might think. Read the rest of this entry »
Mike Trout decided he was going to be more aggressive on the bases this year. Last season, Trout lamented that he missed the days when he was a true stolen base threat. It couldn’t have been easy for the former steals leader to watch the effects of the new rules play out around him. Like Mr. Incredible stuck in a dead-end office job, Trout longed for the glory days. I’d imagine that feeling was made all the more painful because he knew deep down that he still had the skills to achieve greatness.
Things are different this season. Last year, the Angels ranked last in the American League in stolen bases. This year, they rank third. They have a new manager and several new coaches. Trout is never one to spark controversy, and he hasn’t blamed any of his past managers for holding him back. Still, former Angels manager Phil Nevinmade it clear he wasn’t all that interested in his players stealing last year, while new skipper Ron Washington and first base coach Bo Porter have already spoken about their team taking a more aggressive approach on the bases. Both mentioned Trout in particular, and Trout himself has confirmed that aggressive baserunning is a bigger part of the “game plan” for 2024. Read the rest of this entry »
Dating back to August 31, 2023, the Padres have the best record in baseball. They have the second-highest run differential in that time, trailing only the Brewers, against whom they just took two out of three on the road. To be clear, these are fun facts for the jumbotron rather than meaningful or predictive metrics. After all, the Padres of late 2023 look quite a bit different from the Padres of early 2024, and their performance from last September is doing most of the heavy lifting. Even so, it’s enough to make you stop and think, “Hey, these Padres are still pretty good!”
That’s not to say the Padres ever looked like a bad team. However, it would have been easy to write them off, at least subconsciously, after last year’s disappointing performance and the offseason that followed. The Padres ranked second in the NL in pitching WAR and third in position player WAR last season, yet they finished just 82-80. And although they were able to secure a winning record on the final day of the regular season, they certainly lost more than they gained over the winter. As their three biggest competitors in the NL West added six of our top nine free agents (and 10 of our top 21), the Padres lost their best hitter (Juan Soto), their closer (Josh Hader), their ace (Blake Snell), and three more capable arms from the rotation (Seth Lugo, Michael Wacha, and Nick Martinez), all while slashing payroll by nearly $90 million. Read the rest of this entry »
Up until now, the Rockies had made very little noise this offseason. After agreeing to extensions with Germán Márquez and Charlie Blackmon just before the 2023 season wrapped up, Colorado spent a mere $3.5 million on major league free agent deals in the six months since, the fewest of any team in the majors. Yet, at the tail end of a long, quiet winter, the Rockies finally made headlines, when on Sunday they signed 22-year-old Ezequiel Tovar to a long-term contract extension. The deal, which begins right away, will pay Tovar $63.5 million over the next seven years. After that, the Rockies have a $20.5 million team option for 2031, the shortstop’s age-29 season.
Across three offseasons at the helm for Colorado, general manager Bill Schmidt has largely avoided multi-year free agent deals, with one notable exception: Kris Bryant and the seven-year, $182 million pact he signed before the 2022 season. Over the past two winters, the Rockies are one of only three teams not to have signed a single multi-year free agent deal; the other two clubs, the Pirates and Orioles, have outspent Colorado by totals of $37.71 million and $10.13 million, respectively. However, free agency isn’t the only way for teams to keep players around for longer periods of time. Under Schmidt, the Rockies have signed eight players to multi-year extensions; only the Braves have extended more players on multi-year deals in that span. Atlanta has gotten far more extension attention, but this is how Colorado operates, too.
Even so, the Tovar deal represents a different approach for the Rockies because it is the first time that Schmidt has extended a player with fewer than four years of service. It’s also the longest extension the Rockies have awarded since February 2019, when they signed Nolan Arenado to an eight-year, $260 million deal that began in 2020. Moreover, while we have started to see more and more pre-arb players signing long-term extensions around the majors, many of those players either are stars or have star potential. Perhaps the only good comp for Tovar’s extension is the eight-year, $50 million deal Keibert Ruiz signed with the Nationals after putting up a 91 wRC+ and 1.8 WAR in 2022, his first full season. Then again, even Ruiz arguably had a higher ceiling at the time. Tovar might be in a class of his own when it comes to low-ceiling, high-floor youngsters signing lucrative long-term deals.
Entering the 2023 season, Eric Longenhagen and Tess Taruskin ranked Tovar no. 41 on our Top 100 Prospects list, describing him as “a fantastic defensive shortstop” with “poor plate discipline” that “somewhat undermines his excellent bat-to-ball skill.” One year later, Tovar is no longer a prospect, but that remains the prevailing report. He finished his debut season with the lowest walk rate and the second-highest O-Swing% among qualified NL batters. He also finished with 16 OAA and 13 DRS; the only shortstop to outpace him in both metrics was Dansby Swanson. Despite his 70 wRC+, worst among qualified NL hitters, Tovar finished his rookie season with 1.6 WAR. That’s hardly star-level performance, but a 1.6-WAR player is still a big league regular.
Let’s get the bad stuff out of the way first: Tovar’s offensive numbers last season were pitiful. One of the only areas in which he was above average was batting average, and Coors Field likely inflated that number. His plate discipline was dreadful, as expected, but so were his contact skills, which came as something of a surprise. Tovar ranked 66th out of 72 qualified NL hitters in contact rate, and he wasn’t just whiffing on pitches outside the zone. While his O-Contact% was poor, his Z-Contact% also came in below league average.
On the bright side, when he did manage to put the ball in play, Tovar showed flashes of his promising hit tool. His .378 xwOBAcon was a few ticks above league average, thanks to his line drive tendencies. He ranked in the 71st percentile in Baseball Savant’s Sweet-Spot% and finished seventh among qualified NL players in line drive rate. If he can make more contact, especially on pitches in the strike zone, his offensive numbers will improve even if he never adds a lick of discipline to his game. If he can improve his plate discipline, then all the better. For what it’s worth, he significantly improved his walk rate during his final season in the minor leagues, prompting his Double-A manager, Chris Denorfia, to rave about Tovar’s growth. “He’s made this developmental jump,” Denorfia told David Laurila in 2022. “Something clicked to where he’s recognizing situations where pitchers are going to try to get him to chase.” Plate discipline is a different animal in the majors than in the minors, but still, it’s worth acknowledging that this is a skill he has successfully improved in the past.
Tovar also showed off 69th-percentile sprint speed in 2023. He won’t ever be a weapon on the basepaths, but with speed like that, he should be a better base runner than his numbers last year would suggest; he went 11-for-16 on stolen base attempts and was worth -0.6 BsR. Long story short, this is a player with much more offensive potential than we saw last season, and he has a strong enough glove to allow him to nurse his growing pains at the highest level while still contributing positive value to his club.
Courtesy of Dan Szymborski, here is what the ZiPS projections envision for Tovar over the next eight years:
ZiPS Projection – Ezequiel Tovar
Year
BA
OBP
SLG
AB
R
H
2B
3B
HR
RBI
BB
SO
SB
OPS+
WAR
2024
.259
.300
.424
552
75
143
32
4
17
76
28
142
11
87
2.2
2025
.263
.306
.438
562
79
148
33
4
19
81
30
138
11
91
2.6
2026
.266
.310
.442
568
82
151
34
3
20
84
32
133
11
94
2.9
2027
.267
.313
.448
572
85
153
34
3
21
86
34
129
10
96
3.1
2028
.267
.313
.446
574
85
153
34
3
21
87
35
125
10
96
3.1
2029
.266
.314
.445
571
86
152
33
3
21
86
36
122
9
96
3.2
2030
.268
.317
.449
563
85
151
33
3
21
86
36
121
8
97
3.2
2031
.270
.318
.453
552
84
149
32
3
21
84
35
119
8
99
3.2
With projections like that, ZiPS would give Tovar $92 million over seven years. That’s more than he’ll make even if the Rockies pick up his team option for an eighth year.
With all that in mind, it’s easy to see why the Rockies offered Tovar a long-term extension. We’ve already seen his floor, and it’s rather sturdy — he can be a valuable player even if he’s the worst hitter in the league. The Rockies could do a heck of a lot worse than pay $9 million per year for seven seasons of a 1.5-win shortstop. What’s more, it won’t take much for this deal to pay dividends in Colorado. If Tovar’s hit tool progresses against big league pitching, he would blossom into an above-average shortstop throughout his twenties.
As for Tovar, his youth has gifted him the rare opportunity to cash in now without giving up the chance to sign another long-term deal. His $63.5 million guarantee is more than the vast majority of players will earn in their careers, yet he can still reach free agency before his 30th birthday. If Colorado picks up its club option, Tovar will have to wait another year to test the open market. Yet, if the Rockies are comfortable paying $20.5 million for his services (even the Rockies, and even in 2031 dollars), that suggests Tovar will be playing well enough to cash in on the free agent market at 30 years old. The two or three free agent years he is losing aren’t nothing, especially for a glove-first player. Still, Tovar had to sacrifice something for lifelong financial security, and it’s not difficult to understand why he made that choice.
Ultimately, this is a rock solid move for both sides. The Rockies are betting they secured three additional years with an excellent shortstop at price tag well below market value. If that doesn’t work out, they’re only slightly overpaying one of the better defensive players in baseball. Meanwhile, Tovar gets to work out his kinks at the MLB level without ever having to worry about money, and if everything goes according to plan, he can still sign a lucrative free agent deal in the 2030s. Now, both sides can get to work on what they need to do next: Tovar will try to improve his plate discipline, while the Rockies will look to acquire, develop, and yes, extend the stars who can help them escape the NL West basement.