After having typically appeared in the hallowed pages of Baseball Think Factory, Dan Szymborski’s ZiPS projections have now been released at FanGraphs for more than half a decade. The exercise continues this offseason. Below are the projections for the Washington Nationals.
Batters
When I saw the Washington Nationals towards the end of the randomly generated ZiPS order back around Thanksgiving, I thought to myself, “There’s no way that Bryce Harper appears in those projections unless he re-signs.” But here we are! Even more surprising is the degree to which ZiPS has fallen in love with Juan Soto, leaving Bryce Harper as merely the second-ranked player on the Nationals’ list. Young players don’t get the Ken Griffey Jr. offensive comp very often. In fact, I think Soto is the first player to get Jr. as his top comp at this early an age. Comps to Griffey in his thirties tend to be more common (Edwin Encarnacion got him as his No. 3 comp).
What you have here is a lineup in which the cream is very…uh…creamy. Soto’s projections rank him the No. 1 left fielder in baseball among the teams whose projections have gone live and I don’t think I’m giving any spoilers away by saying that neither Kyle Schwarber or Brett Gardner will have better projections. Anthony Rendon won’t drop below fifth among third baseman and there’s nobody left to push Trea Turner below the bronze at shortstop. That give the Nationals three players with a mean projection that makes them legitimate stars. The supporting cast is pretty good, too: Eaton’s at the back of the top 10 if he can stay healthy, ZiPS projects a decent bounce back campaign from Brian Dozier, and catcher and first base don’t drag the team down. Victor Robles isn’t projected to make as big a splash as Juan Soto, but is still soothsayed as an above average center fielder as a rookie.
Pitchers
The pitching bears a resemblance with the lineup in that the highs here are very high. You could do a lot worse than your top three starters having Greg Maddux–Bret Saberhagen–Andy Pettitte as a set of comps. And as weird as it sounds, ZiPS may even be slightly underrating Patrick Corbin; if I used a beta version of ZiPS that is probably a year away from going live, Corbin’s 3.63 ERA would drop to 3.42 and he’d go from the 16th pitcher ranked so far to the 12th. The difference is the full implementation of plate discipline data, which shows Corbin was the second-hardest starting pitcher (min. 100 innings) to make contact against in 2018. It’s easy to cruise on your team’s defense or a lucky BABIP; it’s much harder to cruise by fooling batters, and Corbin doesn’t use a novel trick that might cause him to have a short shelf life.
After the top three starters, ZiPS is unimpressed with Anibal Sanchez and Jeremy Hellickson. ZiPS would actually slightly prefer that the Nats use Erick Fedde and Joe Ross in those slots, but none of them are all that exciting. Ross was at one point, and he’s young enough to still recover, but his career was waylaid considerably by injury.
The bullpen is pretty much the same story. After Sean Doolittle (who has the 7th best projected ERA+ in baseball so far, though Yankees ‘pen is still to come) and Trevor Rosenthal, there’s a whole lot of meh going on. The only relief pitcher who really makes the computer feel a little flush is Austin Adams (there are two Austin Adami), a reliever with the classic mid 90s-fastball/slider combo and another classic trait of many hard-throwing minor league relievers: frequent control issues. Last year, Adams made real progress with his control, getting his walk rate under four in Triple-A while striking out 15 batters per nine innings, though Washington showed little interest in seeing what Adams can do. Washington never really seemed to have much faith in Felipe Vazquez or Blake Treinen either. One would think they’d have learned their lessons about not being more curious about hard-throwing strikeout machine relievers with command issues.
Bench and Prospects
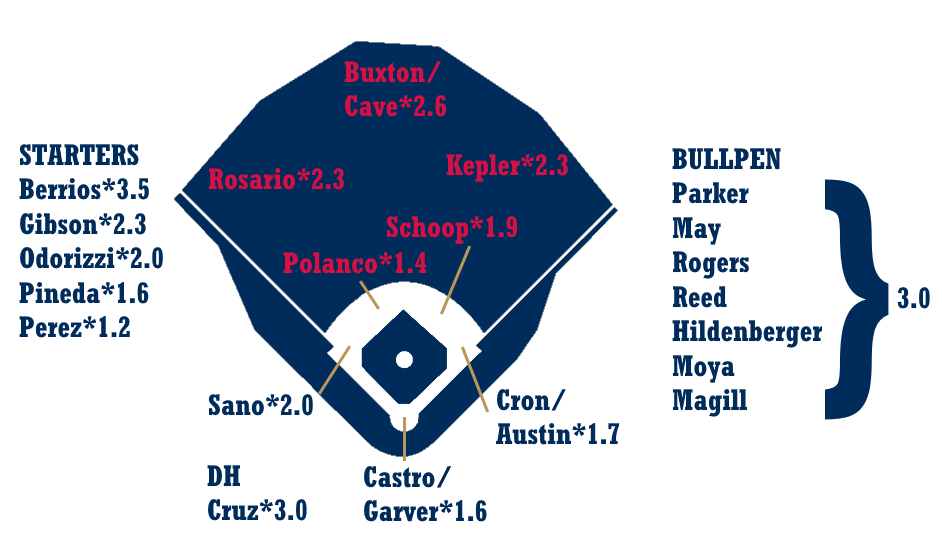
ZiPS has the Nationals with the most WAR in the NL East, but does not similarly project them to be the first-place team. Simply put, ZiPS is unimpressed with team’s depth overall. This is due both to the reserves and the back of the bullpen, but also a minor league system that is likely to provide little in the way of additional reinforcements. Now, Robles is still technically a prospect, but he’s already considered here as a starter, not a reinforcement, and of the center field time split in the depth chart WARtoon, it’s Robles who makes up the bulk of the value rather than Michael Taylor.
The one exception is Carter Kieboom, a player who ZiPS thinks could backstop an injured infielder quite adequately, and certainly be an upgrade from Wilmer Difo, who would be the likely replacement if injury strikes a Turner or a Rendon (something which has happened before). Long-term, ZiPS projects a lot of power upside from Kieboom, thinking he’ll get into the twenties in home runs a year fairly easily, with peak WARs that suggest multiple All-Star appearances.
After that, there’s very little in short-term value. The next-best position player in the minors for the Nats, at least in terms of how ZiPS views 2019, is catcher Tres Barrera, projected to hit .228/.287/.355 for a 0.3 WAR in just under 300 plate appearances (which will almost certainly all be in the majors in 2019). And really, if a catcher was injured, whichever of Kurt Suzuki and Yan Gomes is healthy is likely to simply take over most of the additional playing time.
One pedantic note for 2019: for the WAR graphic, I’m using FanGraphs’ depth chart playing time, not the playing time ZiPS spits out, so there will be occasional differences in WAR totals.
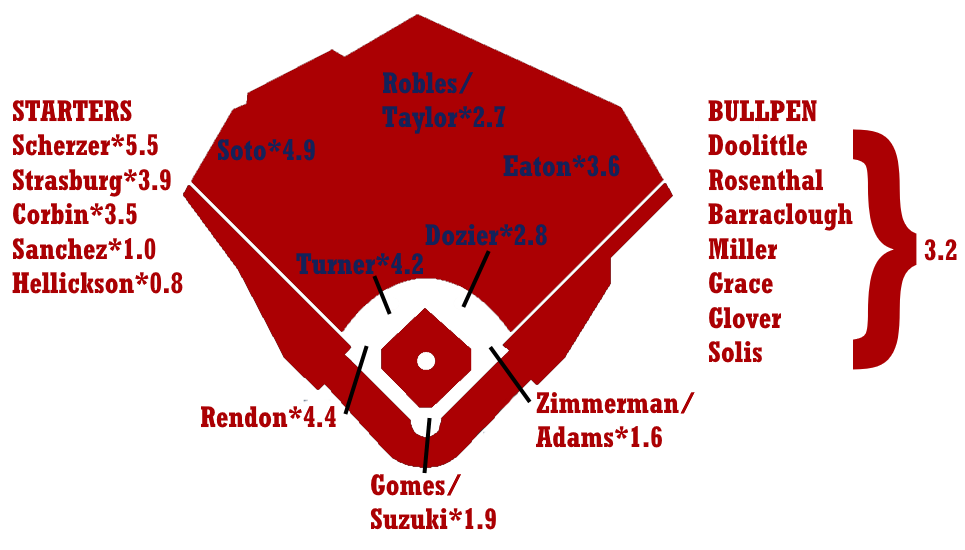
Ballpark graphic courtesy Eephus League. Depth charts constructed by way of those listed here at site.
Batters – Counting Stats
| Player |
B |
Age |
PO |
G |
AB |
R |
H |
2B |
3B |
HR |
RBI |
BB |
SO |
SB |
CS |
| Juan Soto |
L |
20 |
LF |
153 |
558 |
106 |
165 |
31 |
4 |
36 |
112 |
98 |
130 |
8 |
4 |
| Bryce Harper |
L |
26 |
RF |
149 |
516 |
104 |
140 |
30 |
1 |
35 |
109 |
119 |
153 |
14 |
5 |
| Trea Turner |
R |
26 |
SS |
156 |
621 |
96 |
171 |
30 |
9 |
19 |
75 |
56 |
132 |
45 |
9 |
| Anthony Rendon |
R |
29 |
3B |
140 |
522 |
80 |
147 |
38 |
2 |
21 |
88 |
62 |
90 |
5 |
2 |
| Adam Eaton |
L |
30 |
RF |
119 |
452 |
71 |
133 |
24 |
6 |
9 |
48 |
45 |
87 |
11 |
4 |
| Brian Dozier |
R |
32 |
2B |
142 |
552 |
87 |
138 |
32 |
4 |
25 |
83 |
61 |
127 |
12 |
4 |
| Victor Robles |
R |
22 |
CF |
122 |
454 |
57 |
117 |
25 |
6 |
10 |
53 |
36 |
95 |
28 |
12 |
| Carter Kieboom |
R |
21 |
SS |
120 |
482 |
64 |
116 |
24 |
1 |
15 |
56 |
46 |
125 |
7 |
3 |
| Matt Adams |
L |
30 |
1B |
118 |
305 |
39 |
77 |
16 |
0 |
18 |
62 |
25 |
78 |
0 |
0 |
| Kurt Suzuki |
R |
35 |
C |
95 |
316 |
36 |
83 |
18 |
0 |
9 |
49 |
19 |
43 |
0 |
0 |
| Yan Gomes |
R |
31 |
C |
103 |
361 |
42 |
86 |
19 |
0 |
13 |
49 |
20 |
102 |
0 |
0 |
| Wilmer Difo |
B |
27 |
2B |
138 |
423 |
55 |
105 |
17 |
5 |
7 |
40 |
33 |
91 |
14 |
4 |
| Michael A. Taylor |
R |
28 |
CF |
124 |
381 |
46 |
89 |
19 |
2 |
11 |
40 |
30 |
133 |
22 |
6 |
| Ryan Zimmerman |
R |
34 |
1B |
104 |
370 |
51 |
96 |
21 |
1 |
17 |
66 |
32 |
86 |
2 |
1 |
| Matt Wieters |
B |
33 |
C |
96 |
320 |
32 |
76 |
14 |
0 |
9 |
43 |
31 |
69 |
0 |
0 |
| Matt Reynolds |
R |
28 |
SS |
106 |
338 |
41 |
78 |
19 |
3 |
5 |
33 |
31 |
95 |
4 |
2 |
| Moises Sierra |
R |
30 |
RF |
100 |
334 |
39 |
85 |
16 |
1 |
8 |
38 |
25 |
78 |
6 |
4 |
| Tres Barrera |
R |
24 |
C |
69 |
259 |
28 |
59 |
13 |
1 |
6 |
25 |
17 |
66 |
2 |
0 |
| Spencer Kieboom |
R |
28 |
C |
77 |
244 |
28 |
56 |
12 |
0 |
4 |
24 |
26 |
50 |
0 |
0 |
| Adrian Sanchez |
B |
28 |
SS |
108 |
348 |
35 |
86 |
19 |
2 |
4 |
33 |
16 |
64 |
8 |
5 |
| Howie Kendrick |
R |
35 |
2B |
92 |
331 |
41 |
92 |
18 |
2 |
6 |
34 |
22 |
67 |
6 |
3 |
| Jacob Wilson |
R |
28 |
3B |
112 |
394 |
46 |
89 |
20 |
1 |
10 |
45 |
34 |
102 |
2 |
2 |
| Pedro Severino |
R |
25 |
C |
100 |
324 |
32 |
75 |
13 |
1 |
7 |
33 |
20 |
70 |
2 |
1 |
| Miguel Montero |
L |
35 |
C |
78 |
218 |
24 |
48 |
7 |
0 |
7 |
29 |
30 |
64 |
1 |
0 |
| Jason Martinson |
R |
30 |
3B |
95 |
348 |
39 |
65 |
12 |
2 |
14 |
42 |
27 |
167 |
4 |
3 |
| Jake Noll |
R |
25 |
3B |
129 |
491 |
54 |
118 |
17 |
3 |
10 |
50 |
24 |
103 |
6 |
3 |
| Luis Sardinas |
B |
26 |
SS |
103 |
348 |
38 |
90 |
13 |
2 |
5 |
33 |
16 |
63 |
6 |
4 |
| Austin Davidson |
L |
26 |
1B |
106 |
355 |
43 |
84 |
18 |
3 |
8 |
39 |
34 |
79 |
5 |
4 |
| Brandon Snyder |
R |
32 |
3B |
108 |
376 |
47 |
84 |
19 |
2 |
14 |
50 |
31 |
141 |
3 |
1 |
| Irving Falu |
B |
36 |
2B |
100 |
361 |
37 |
91 |
14 |
2 |
4 |
34 |
24 |
39 |
7 |
5 |
| Raudy Read |
R |
25 |
C |
91 |
342 |
36 |
82 |
19 |
2 |
7 |
37 |
18 |
76 |
2 |
1 |
| Hunter Jones |
R |
27 |
CF |
114 |
422 |
45 |
97 |
15 |
5 |
6 |
38 |
31 |
105 |
12 |
5 |
| Drew Ward |
L |
24 |
1B |
118 |
408 |
51 |
88 |
19 |
2 |
11 |
46 |
50 |
153 |
1 |
2 |
| Matt Hague |
R |
33 |
1B |
92 |
341 |
39 |
87 |
18 |
0 |
6 |
34 |
34 |
61 |
2 |
1 |
| Alec Keller |
L |
27 |
LF |
98 |
369 |
39 |
94 |
15 |
4 |
2 |
30 |
22 |
76 |
5 |
4 |
| Yadiel Hernandez |
L |
31 |
LF |
117 |
411 |
50 |
101 |
16 |
1 |
12 |
47 |
42 |
106 |
3 |
2 |
| Bengie Gonzalez |
R |
29 |
SS |
107 |
361 |
36 |
81 |
16 |
2 |
3 |
28 |
28 |
76 |
7 |
4 |
| Andrew Stevenson |
L |
25 |
CF |
133 |
445 |
49 |
105 |
14 |
4 |
5 |
38 |
33 |
117 |
17 |
9 |
| Jose Marmolejos |
L |
26 |
1B |
127 |
486 |
55 |
118 |
25 |
3 |
10 |
53 |
37 |
121 |
0 |
1 |
| Tyler Goeddel |
R |
26 |
LF |
99 |
321 |
36 |
73 |
12 |
3 |
5 |
31 |
28 |
87 |
8 |
3 |
| Michael Almanzar |
R |
28 |
3B |
102 |
362 |
34 |
82 |
18 |
1 |
7 |
36 |
17 |
98 |
0 |
1 |
| Chris Dominguez |
R |
32 |
1B |
88 |
293 |
32 |
67 |
14 |
1 |
10 |
35 |
11 |
98 |
6 |
3 |
| Khayyan Norfork |
R |
30 |
2B |
75 |
220 |
22 |
48 |
8 |
0 |
2 |
16 |
16 |
63 |
3 |
1 |
| Taylor Gushue |
B |
25 |
C |
96 |
349 |
36 |
70 |
14 |
1 |
9 |
38 |
27 |
110 |
0 |
1 |
| Zach Collier |
L |
28 |
RF |
95 |
305 |
32 |
60 |
13 |
4 |
5 |
29 |
28 |
117 |
4 |
4 |
| Chuck Taylor |
B |
25 |
LF |
124 |
486 |
54 |
118 |
21 |
3 |
5 |
44 |
43 |
101 |
3 |
4 |
| Dan Gamache |
L |
28 |
2B |
117 |
396 |
41 |
90 |
17 |
1 |
5 |
34 |
36 |
117 |
1 |
4 |
| Rafael Bautista |
R |
26 |
CF |
97 |
361 |
37 |
85 |
9 |
3 |
2 |
23 |
20 |
79 |
19 |
6 |
| Telmito Agustin |
L |
22 |
LF |
105 |
370 |
40 |
84 |
15 |
3 |
8 |
36 |
21 |
105 |
9 |
6 |
| Adam Brett Walker |
R |
27 |
LF |
93 |
336 |
42 |
62 |
14 |
2 |
18 |
55 |
28 |
169 |
4 |
1 |
| Osvaldo Abreu |
R |
25 |
SS |
119 |
430 |
45 |
89 |
18 |
3 |
7 |
38 |
33 |
136 |
7 |
6 |
Batters – Rate Stats
| Player |
PA |
BA |
OBP |
SLG |
OPS+ |
ISO |
BABIP |
RC/27 |
Def |
WAR |
No. 1 Comp |
| Juan Soto |
658 |
.296 |
.400 |
.559 |
149 |
.263 |
.329 |
8.6 |
-6 |
5.1 |
Ken Griffey |
| Bryce Harper |
646 |
.271 |
.407 |
.537 |
146 |
.266 |
.320 |
8.2 |
-4 |
4.7 |
Elbie Fletcher |
| Trea Turner |
685 |
.275 |
.337 |
.444 |
103 |
.169 |
.323 |
6.1 |
3 |
4.4 |
Rafael Furcal |
| Anthony Rendon |
597 |
.282 |
.360 |
.483 |
119 |
.201 |
.307 |
6.6 |
6 |
4.4 |
Davey Johnson |
| Adam Eaton |
513 |
.294 |
.371 |
.434 |
111 |
.139 |
.348 |
6.2 |
7 |
3.0 |
Pat Kelly |
| Brian Dozier |
623 |
.250 |
.329 |
.458 |
104 |
.208 |
.283 |
5.5 |
-2 |
2.8 |
Jose Valentin |
| Victor Robles |
510 |
.258 |
.329 |
.405 |
92 |
.148 |
.307 |
5.0 |
7 |
2.4 |
Milton Bradley |
| Carter Kieboom |
534 |
.241 |
.311 |
.388 |
83 |
.147 |
.295 |
4.3 |
0 |
1.5 |
Michael Young |
| Matt Adams |
334 |
.252 |
.311 |
.482 |
104 |
.230 |
.282 |
5.4 |
5 |
1.3 |
Daryle Ward |
| Kurt Suzuki |
350 |
.263 |
.321 |
.405 |
89 |
.142 |
.280 |
4.8 |
-1 |
1.2 |
Mike Lieberthal |
| Yan Gomes |
391 |
.238 |
.289 |
.399 |
79 |
.161 |
.297 |
4.1 |
3 |
1.1 |
Nelson Santovenia |
| Wilmer Difo |
464 |
.248 |
.304 |
.362 |
74 |
.113 |
.302 |
4.1 |
6 |
1.0 |
Derek Wathan |
| Michael A. Taylor |
414 |
.234 |
.291 |
.381 |
75 |
.147 |
.329 |
4.2 |
3 |
0.8 |
Damon Mashore |
| Ryan Zimmerman |
410 |
.259 |
.320 |
.459 |
102 |
.200 |
.296 |
5.4 |
-2 |
0.8 |
Hubie Brooks |
| Matt Wieters |
357 |
.238 |
.306 |
.366 |
76 |
.128 |
.277 |
4.0 |
-1 |
0.6 |
Scott Servais |
| Matt Reynolds |
375 |
.231 |
.299 |
.349 |
70 |
.118 |
.307 |
3.7 |
1 |
0.5 |
Edgar Gonzalez |
| Moises Sierra |
366 |
.254 |
.314 |
.380 |
82 |
.126 |
.310 |
4.3 |
3 |
0.4 |
Kevin Romine |
| Tres Barrera |
283 |
.228 |
.287 |
.355 |
68 |
.127 |
.283 |
3.6 |
0 |
0.3 |
David Duff |
| Spencer Kieboom |
272 |
.230 |
.305 |
.328 |
67 |
.098 |
.274 |
3.5 |
0 |
0.3 |
Bill Dobrolsky |
| Adrian Sanchez |
371 |
.247 |
.283 |
.348 |
65 |
.101 |
.293 |
3.5 |
2 |
0.2 |
Greg Fulton |
| Howie Kendrick |
359 |
.278 |
.329 |
.399 |
90 |
.121 |
.333 |
4.9 |
-8 |
0.2 |
Dave Concepcion |
| Jacob Wilson |
442 |
.226 |
.293 |
.358 |
70 |
.132 |
.280 |
3.6 |
1 |
0.1 |
Craig Walck |
| Pedro Severino |
350 |
.231 |
.281 |
.343 |
63 |
.111 |
.275 |
3.4 |
0 |
0.1 |
Brandon Marsters |
| Miguel Montero |
253 |
.220 |
.320 |
.349 |
76 |
.128 |
.279 |
3.9 |
-5 |
0.0 |
Chad Kreuter |
| Jason Martinson |
383 |
.187 |
.255 |
.353 |
58 |
.167 |
.305 |
2.9 |
6 |
0.0 |
Sean Mcnally |
| Jake Noll |
527 |
.240 |
.281 |
.348 |
65 |
.108 |
.286 |
3.5 |
4 |
0.0 |
Pat Osborn |
| Luis Sardinas |
372 |
.259 |
.294 |
.351 |
69 |
.092 |
.304 |
3.7 |
-2 |
0.0 |
Tom Veryzer |
| Austin Davidson |
398 |
.237 |
.310 |
.372 |
78 |
.135 |
.284 |
4.0 |
2 |
0.0 |
Matt Bowser |
| Brandon Snyder |
414 |
.223 |
.287 |
.396 |
77 |
.173 |
.317 |
4.0 |
-5 |
0.0 |
Steve Scarsone |
| Irving Falu |
391 |
.252 |
.299 |
.335 |
67 |
.083 |
.274 |
3.5 |
1 |
0.0 |
Casey Candaele |
| Raudy Read |
364 |
.240 |
.280 |
.368 |
69 |
.129 |
.290 |
3.7 |
-4 |
0.0 |
Neil Wilson |
| Hunter Jones |
466 |
.230 |
.292 |
.332 |
64 |
.102 |
.293 |
3.4 |
1 |
-0.1 |
Choo Freeman |
| Drew Ward |
464 |
.216 |
.306 |
.353 |
73 |
.137 |
.316 |
3.6 |
3 |
-0.2 |
Lucas Duda |
| Matt Hague |
382 |
.255 |
.325 |
.361 |
80 |
.106 |
.296 |
4.2 |
-2 |
-0.2 |
Royce Huffman |
| Alec Keller |
397 |
.255 |
.299 |
.333 |
66 |
.079 |
.316 |
3.5 |
5 |
-0.2 |
Raul Tovar |
| Yadiel Hernandez |
456 |
.246 |
.316 |
.377 |
82 |
.131 |
.304 |
4.2 |
-4 |
-0.3 |
Stu Pederson |
| Bengie Gonzalez |
395 |
.224 |
.280 |
.305 |
54 |
.080 |
.277 |
2.9 |
1 |
-0.4 |
Keith Johns |
| Andrew Stevenson |
486 |
.236 |
.292 |
.319 |
61 |
.083 |
.310 |
3.3 |
0 |
-0.4 |
Keiunta Span |
| Jose Marmolejos |
531 |
.243 |
.298 |
.368 |
74 |
.126 |
.304 |
3.9 |
1 |
-0.4 |
Juan Tejeda |
| Tyler Goeddel |
357 |
.227 |
.299 |
.330 |
65 |
.103 |
.297 |
3.5 |
0 |
-0.5 |
Casey Craig |
| Michael Almanzar |
385 |
.227 |
.265 |
.340 |
58 |
.113 |
.292 |
3.1 |
2 |
-0.5 |
Colin Dixon |
| Chris Dominguez |
312 |
.229 |
.266 |
.386 |
69 |
.157 |
.308 |
3.6 |
1 |
-0.5 |
Darrell Whitmore |
| Khayyan Norfork |
243 |
.218 |
.282 |
.282 |
49 |
.064 |
.297 |
2.8 |
0 |
-0.5 |
Gary Green |
| Taylor Gushue |
383 |
.201 |
.261 |
.324 |
53 |
.123 |
.265 |
2.8 |
-2 |
-0.6 |
Alan Probst |
| Zach Collier |
339 |
.197 |
.272 |
.315 |
54 |
.118 |
.301 |
2.7 |
4 |
-0.7 |
Kevin Koslofski |
| Chuck Taylor |
537 |
.243 |
.309 |
.329 |
68 |
.086 |
.297 |
3.5 |
0 |
-0.7 |
Scott Melvin |
| Dan Gamache |
438 |
.227 |
.295 |
.313 |
61 |
.086 |
.310 |
3.0 |
-3 |
-0.8 |
John Hotchkiss |
| Rafael Bautista |
391 |
.235 |
.281 |
.294 |
52 |
.058 |
.296 |
3.1 |
-3 |
-0.9 |
Fernando Ramsey |
| Telmito Agustin |
399 |
.227 |
.273 |
.349 |
62 |
.122 |
.296 |
3.2 |
-1 |
-1.1 |
Lonnie Maclin |
| Adam Brett Walker |
370 |
.185 |
.249 |
.399 |
66 |
.214 |
.295 |
3.3 |
-6 |
-1.1 |
Kirk Asche |
| Osvaldo Abreu |
472 |
.207 |
.269 |
.312 |
52 |
.105 |
.286 |
2.7 |
-5 |
-1.2 |
Erick Monzon |
Pitchers – Counting Stats
| Player |
T |
Age |
W |
L |
ERA |
G |
GS |
IP |
H |
ER |
HR |
BB |
SO |
| Max Scherzer |
R |
34 |
15 |
7 |
2.98 |
30 |
30 |
193.3 |
148 |
64 |
23 |
50 |
248 |
| Patrick Corbin |
L |
29 |
12 |
8 |
3.63 |
32 |
31 |
181.0 |
171 |
73 |
21 |
50 |
195 |
| Stephen Strasburg |
R |
30 |
12 |
7 |
3.34 |
25 |
25 |
145.3 |
127 |
54 |
16 |
38 |
165 |
| Erick Fedde |
R |
26 |
6 |
6 |
4.50 |
25 |
22 |
112.0 |
118 |
56 |
14 |
39 |
95 |
| Sean Doolittle |
L |
32 |
3 |
1 |
2.95 |
43 |
0 |
39.7 |
31 |
13 |
6 |
7 |
51 |
| Joe Ross |
R |
26 |
6 |
5 |
4.53 |
18 |
18 |
89.3 |
96 |
45 |
13 |
27 |
69 |
| Jeremy Hellickson |
R |
32 |
7 |
7 |
4.74 |
22 |
22 |
114.0 |
120 |
60 |
19 |
31 |
80 |
| Anibal Sanchez |
R |
35 |
6 |
7 |
4.93 |
25 |
22 |
118.7 |
121 |
65 |
18 |
40 |
115 |
| Austin Voth |
R |
27 |
7 |
8 |
4.98 |
26 |
24 |
124.7 |
133 |
69 |
19 |
52 |
99 |
| Logan Darnell |
L |
30 |
6 |
7 |
5.09 |
22 |
18 |
99.0 |
117 |
56 |
15 |
33 |
58 |
| Austin L. Adams |
R |
28 |
3 |
2 |
3.83 |
43 |
0 |
51.7 |
40 |
22 |
4 |
37 |
68 |
| Austen Williams |
R |
26 |
6 |
6 |
4.78 |
32 |
12 |
92.3 |
98 |
49 |
14 |
33 |
79 |
| Trevor Rosenthal |
R |
29 |
3 |
2 |
3.48 |
36 |
0 |
33.7 |
29 |
13 |
3 |
17 |
46 |
| Justin Miller |
R |
32 |
5 |
3 |
3.86 |
53 |
0 |
56.0 |
51 |
24 |
8 |
18 |
62 |
| Tyler Mapes |
R |
27 |
6 |
7 |
5.08 |
22 |
19 |
106.3 |
123 |
60 |
16 |
35 |
63 |
| Matt Grace |
L |
30 |
2 |
1 |
3.99 |
54 |
1 |
58.7 |
61 |
26 |
5 |
18 |
41 |
| Vidal Nuno |
L |
31 |
3 |
3 |
4.66 |
33 |
6 |
65.7 |
71 |
34 |
13 |
16 |
56 |
| Sterling Sharp |
R |
24 |
8 |
9 |
5.21 |
26 |
26 |
133.0 |
157 |
77 |
18 |
51 |
74 |
| Andrew Istler |
R |
26 |
4 |
4 |
4.21 |
42 |
1 |
66.3 |
68 |
31 |
7 |
23 |
53 |
| Scott Copeland |
R |
31 |
7 |
8 |
5.35 |
21 |
21 |
109.3 |
124 |
65 |
17 |
50 |
73 |
| Kyle Barraclough |
R |
29 |
4 |
3 |
4.10 |
65 |
0 |
59.3 |
49 |
27 |
5 |
40 |
69 |
| Wander Suero |
R |
27 |
4 |
3 |
4.16 |
53 |
0 |
62.7 |
63 |
29 |
7 |
22 |
55 |
| Brady Dragmire |
R |
26 |
6 |
7 |
5.42 |
29 |
18 |
116.3 |
141 |
70 |
18 |
44 |
64 |
| Henderson Alvarez |
R |
29 |
3 |
3 |
5.21 |
10 |
9 |
48.3 |
56 |
28 |
7 |
17 |
24 |
| Dakota Bacus |
R |
28 |
3 |
3 |
4.82 |
26 |
4 |
56.0 |
57 |
30 |
8 |
27 |
48 |
| Koda Glover |
R |
26 |
3 |
2 |
4.32 |
40 |
0 |
41.7 |
41 |
20 |
5 |
15 |
38 |
| Aaron Barrett |
R |
31 |
1 |
1 |
4.12 |
23 |
0 |
19.7 |
18 |
9 |
2 |
10 |
19 |
| Cesar Vargas |
R |
27 |
4 |
5 |
5.42 |
25 |
15 |
86.3 |
96 |
52 |
13 |
47 |
63 |
| Jhon Romero |
R |
24 |
2 |
1 |
4.50 |
41 |
0 |
56.0 |
55 |
28 |
6 |
29 |
50 |
| Jordan Mills |
L |
27 |
3 |
3 |
4.66 |
39 |
0 |
48.3 |
49 |
25 |
5 |
28 |
41 |
| Jaron Long |
R |
27 |
7 |
9 |
5.57 |
25 |
20 |
124.3 |
152 |
77 |
23 |
33 |
68 |
| Joaquin Benoit |
R |
41 |
3 |
2 |
4.68 |
35 |
0 |
32.7 |
31 |
17 |
5 |
15 |
28 |
| Sammy Solis |
L |
30 |
2 |
2 |
4.70 |
57 |
0 |
46.0 |
45 |
24 |
7 |
22 |
48 |
| Josh Edgin |
L |
32 |
3 |
3 |
4.81 |
46 |
0 |
39.3 |
38 |
21 |
6 |
22 |
41 |
| J.J. Hoover |
R |
31 |
3 |
3 |
4.86 |
54 |
0 |
50.0 |
49 |
27 |
8 |
28 |
52 |
| David Goforth |
R |
30 |
3 |
4 |
5.37 |
42 |
2 |
58.7 |
65 |
35 |
8 |
31 |
41 |
| Kyle McGowin |
R |
27 |
6 |
9 |
5.90 |
25 |
23 |
122.0 |
137 |
80 |
27 |
48 |
105 |
| Wil Crowe |
R |
24 |
6 |
9 |
5.83 |
22 |
21 |
100.3 |
115 |
65 |
17 |
56 |
74 |
| Tanner Rainey |
R |
26 |
4 |
4 |
5.30 |
54 |
0 |
54.3 |
47 |
32 |
8 |
46 |
66 |
| Jimmy Cordero |
R |
27 |
3 |
4 |
5.40 |
57 |
0 |
60.0 |
62 |
36 |
8 |
40 |
50 |
| James Bourque |
R |
25 |
4 |
5 |
5.81 |
31 |
9 |
69.7 |
76 |
45 |
13 |
39 |
62 |
| John Simms |
R |
27 |
5 |
7 |
5.83 |
25 |
15 |
92.7 |
105 |
60 |
18 |
41 |
66 |
| Ronald Pena |
R |
27 |
2 |
3 |
5.55 |
36 |
0 |
47.0 |
49 |
29 |
8 |
29 |
43 |
| Roman Mendez |
R |
28 |
4 |
5 |
5.69 |
41 |
0 |
49.0 |
52 |
31 |
10 |
25 |
44 |
| Bryan Harper |
L |
29 |
2 |
3 |
6.38 |
42 |
0 |
42.3 |
48 |
30 |
8 |
31 |
33 |
| Luis Reyes |
R |
24 |
6 |
10 |
6.62 |
19 |
19 |
89.7 |
109 |
66 |
19 |
51 |
55 |
Pitchers – Rate Stats
| Player |
TBF |
K/9 |
BB/9 |
HR/9 |
BABIP |
ERA+ |
ERA- |
FIP |
WAR |
No. 1 Comp |
| Max Scherzer |
775 |
11.54 |
2.33 |
1.07 |
.280 |
142 |
70 |
3.03 |
5.1 |
Greg Maddux |
| Patrick Corbin |
756 |
9.70 |
2.49 |
1.04 |
.309 |
117 |
86 |
3.40 |
3.4 |
Andy Pettitte |
| Stephen Strasburg |
597 |
10.22 |
2.35 |
0.99 |
.298 |
127 |
79 |
3.20 |
3.2 |
Bret Saberhagen |
| Erick Fedde |
490 |
7.63 |
3.13 |
1.13 |
.309 |
94 |
106 |
4.26 |
1.1 |
Mike LaCoss |
| Sean Doolittle |
156 |
11.57 |
1.59 |
1.36 |
.275 |
149 |
67 |
3.15 |
0.9 |
Billy Wagner |
| Joe Ross |
388 |
6.95 |
2.72 |
1.31 |
.302 |
94 |
107 |
4.54 |
0.9 |
Mark Knudson |
| Jeremy Hellickson |
490 |
6.32 |
2.45 |
1.50 |
.285 |
90 |
112 |
4.89 |
0.8 |
Glenn Abbott |
| Anibal Sanchez |
512 |
8.72 |
3.03 |
1.37 |
.307 |
89 |
113 |
4.27 |
0.8 |
Rick Helling |
| Austin Voth |
556 |
7.15 |
3.75 |
1.37 |
.300 |
85 |
117 |
4.94 |
0.6 |
Kevin Hodges |
| Logan Darnell |
445 |
5.27 |
3.00 |
1.36 |
.306 |
86 |
116 |
5.13 |
0.5 |
Dave Otto |
| Austin L. Adams |
232 |
11.85 |
6.45 |
0.70 |
.300 |
114 |
87 |
3.85 |
0.5 |
Jim Kern |
| Austen Williams |
406 |
7.70 |
3.22 |
1.36 |
.305 |
89 |
113 |
4.64 |
0.4 |
Doug Potestio |
| Trevor Rosenthal |
147 |
12.30 |
4.54 |
0.80 |
.329 |
122 |
82 |
3.27 |
0.4 |
Ernie Camacho |
| Justin Miller |
235 |
9.96 |
2.89 |
1.29 |
.297 |
110 |
91 |
3.86 |
0.4 |
Bert Roberge |
| Tyler Mapes |
474 |
5.33 |
2.96 |
1.35 |
.302 |
84 |
120 |
5.08 |
0.4 |
Steve Finch |
| Matt Grace |
253 |
6.29 |
2.76 |
0.77 |
.301 |
106 |
94 |
3.93 |
0.4 |
Dave Tomlin |
| Vidal Nuno |
282 |
7.68 |
2.19 |
1.78 |
.299 |
94 |
106 |
4.89 |
0.4 |
Sam Zoldak |
| Sterling Sharp |
605 |
5.01 |
3.45 |
1.22 |
.307 |
81 |
123 |
5.15 |
0.3 |
Jake Joseph |
| Andrew Istler |
289 |
7.19 |
3.12 |
0.95 |
.302 |
101 |
99 |
4.14 |
0.3 |
Adrian Devine |
| Scott Copeland |
499 |
6.01 |
4.12 |
1.40 |
.303 |
82 |
122 |
5.37 |
0.3 |
Dick Fowler |
| Kyle Barraclough |
266 |
10.47 |
6.07 |
0.76 |
.295 |
104 |
97 |
4.09 |
0.3 |
Jack Meyer |
| Wander Suero |
272 |
7.90 |
3.16 |
1.01 |
.304 |
102 |
98 |
4.09 |
0.2 |
Rafael Montalvo |
| Brady Dragmire |
531 |
4.95 |
3.40 |
1.39 |
.309 |
81 |
124 |
5.38 |
0.1 |
Tony Peguero |
| Henderson Alvarez |
216 |
4.47 |
3.17 |
1.30 |
.295 |
81 |
123 |
5.22 |
0.1 |
Stephen Whitmyer |
| Dakota Bacus |
251 |
7.71 |
4.34 |
1.29 |
.297 |
88 |
114 |
4.90 |
0.1 |
Mike Bumstead |
| Koda Glover |
179 |
8.21 |
3.24 |
1.08 |
.300 |
98 |
102 |
4.04 |
0.1 |
Trey Witte |
| Aaron Barrett |
87 |
8.69 |
4.58 |
0.92 |
.291 |
103 |
97 |
4.22 |
0.1 |
Kevin Gryboski |
| Cesar Vargas |
400 |
6.57 |
4.90 |
1.36 |
.305 |
81 |
124 |
5.46 |
0.1 |
Danny Kolb |
| Jhon Romero |
251 |
8.04 |
4.66 |
0.96 |
.301 |
94 |
106 |
4.47 |
0.0 |
Sam Nahem |
| Jordan Mills |
221 |
7.63 |
5.21 |
0.93 |
.306 |
94 |
106 |
4.72 |
0.0 |
Brian Adams |
| Jaron Long |
555 |
4.92 |
2.39 |
1.66 |
.304 |
79 |
127 |
5.43 |
0.0 |
Heath Totten |
| Joaquin Benoit |
143 |
7.71 |
4.13 |
1.38 |
.277 |
91 |
110 |
4.89 |
-0.1 |
Don McMahon |
| Sammy Solis |
204 |
9.39 |
4.30 |
1.37 |
.304 |
90 |
111 |
4.61 |
-0.1 |
Randy Choate |
| Josh Edgin |
178 |
9.38 |
5.03 |
1.37 |
.302 |
88 |
113 |
4.96 |
-0.1 |
Sean Fesh |
| J.J. Hoover |
226 |
9.36 |
5.04 |
1.44 |
.301 |
87 |
115 |
4.95 |
-0.2 |
Mike Cook |
| David Goforth |
270 |
6.29 |
4.76 |
1.23 |
.305 |
79 |
127 |
5.26 |
-0.4 |
Jim Todd |
| Kyle McGowin |
549 |
7.75 |
3.54 |
1.99 |
.304 |
74 |
135 |
5.66 |
-0.4 |
Pete Janicki |
| Wil Crowe |
470 |
6.64 |
5.02 |
1.52 |
.309 |
73 |
137 |
5.73 |
-0.5 |
Chad Paronto |
| Tanner Rainey |
256 |
10.93 |
7.62 |
1.33 |
.293 |
80 |
125 |
5.34 |
-0.5 |
Josh Banks |
| Jimmy Cordero |
281 |
7.50 |
6.00 |
1.20 |
.300 |
81 |
123 |
5.37 |
-0.5 |
Ken Wright |
| James Bourque |
323 |
8.01 |
5.04 |
1.68 |
.307 |
73 |
137 |
5.65 |
-0.5 |
Eulogio Delacruz |
| John Simms |
422 |
6.41 |
3.98 |
1.75 |
.298 |
73 |
137 |
5.74 |
-0.5 |
Wes Wilkerson |
| Ronald Pena |
219 |
8.23 |
5.55 |
1.53 |
.301 |
76 |
131 |
5.58 |
-0.5 |
Rick Greene |
| Roman Mendez |
223 |
8.08 |
4.59 |
1.84 |
.298 |
77 |
130 |
5.72 |
-0.6 |
Mario Ramos |
| Bryan Harper |
206 |
7.02 |
6.59 |
1.70 |
.305 |
67 |
150 |
6.46 |
-0.9 |
Scott Forster |
| Luis Reyes |
427 |
5.52 |
5.12 |
1.91 |
.303 |
64 |
156 |
6.55 |
-1.2 |
Mark Woodyard |
Disclaimer: ZiPS projections are computer-based projections of performance. Performances have not been allocated to predicted playing time in the majors — many of the players listed above are unlikely to play in the majors at all in 2019. ZiPS is projecting equivalent production — a .240 ZiPS projection may end up being .280 in AAA or .300 in AA, for example. Whether or not a player will play is one of many non-statistical factors one has to take into account when predicting the future.
Players are listed with their most recent teams, unless I have made a mistake. This is very possible, as a lot of minor-league signings go generally unreported in the offseason.
ZiPS’ projections are based on the American League having a 4.29 ERA and the National League having a 4.15 ERA.
Players who are expected to be out due to injury are still projected. More information is always better than less information, and a computer isn’t the tool that should project the injury status of, for example, a pitcher who has had Tommy John surgery.
Both hitters and pitchers are ranked by projected zWAR — which is to say, WAR values as calculated by me, Dan Szymborski, whose surname is spelled with a z. WAR values might differ slightly from those which appear in full release of ZiPS. Finally, I will advise anyone against — and might karate chop anyone guilty of — merely adding up WAR totals on a depth chart to produce projected team WAR.