There probably isn’t a good way to pitch to Juan Soto. The man is simply impossible: End up an inch outside the zone, and he’ll take the pitch in stride, celebrating the occasion with his signature shuffle. End up anywhere near his comfort zone, and he’ll lace it into the outfield for a double, or worse, over the fence for a home run. You just have to pray and hope that Soto messes up his timing. He’s been blessed with a preternatural knack for plate discipline to go along with legitimate power, and to wrap up this sentence, he’s very good.
At the same time, pitchers must be doing something right, because so far, Soto is having the worst season of his career. With a 125 wRC+ as of this writing that might be other hitters’ best marks, Soto looks merely mortal in 2022. So what’s going on? I don’t claim to have all of or even necessarily the right answers, but I have a few ideas.
Before proceeding any further, I need to stress that Soto’s underperformance is largely a product of bad luck, plain and simple. Soto has a .207 BABIP. Nobody has a .207 BABIP! Even Joey Gallo has a .256 BABIP. Batting average on balls in play is mysteriously down in 2022, but that’s nowhere near enough to explain why Soto’s been a bottom-dweller in this regard. Another quirk from this year: Nearly everyone is lagging behind their expected wOBA because Statcast metrics have not been calibrated to the new offensive environment. Even so, the gap between Soto’s actual and expected wOBA is the 28th-largest in baseball. Soto isn’t really behaving like an inferior version of himself. The contact is there. The discipline is there. We’re still in June, and there’s plenty of time for a correction to occur. Read the rest of this entry »
The Learning and Developing a Pitch series is back for another season, and we’re once again hearing from pitchers on a notable weapon in their arsenal. Today’s installment features Detroit Tigers left-hander Andrew “Big Country” Chafin on his signature slider.
Chafin has a keep-it-simple-stupid [K.I.S.S.] approach to his best pitch, and it’s hard to argue with success. Since the start of last season, the mustachioed southpaw boasts a 2.17 ERA and 2.78 FIP over 94 relief outings, allowing just 62 hits and fanning 88 batters in 87 innings. Chafin has thrown his breaking ball 35.8% of the time this year.
———
Andrew Chafin: “I hold a curveball grip, throw it as hard as I can, and it comes out a slider. So, is it a curveball or a slider? I guess whatever it does is what it is. Really, I don’t care what people call it as long as the hitters swing and miss. If that happens, I’m happy.
“I want to say I started learning [a breaking ball] in my junior year of high school, give or take. I don’t remember who I was working with in particular, I just found a grip that felt comfortable, and I tried to make it spin. There’s nothing special about how I grip it or throw it. Read the rest of this entry »
Who is baseball’s most irreplaceable player in 2022? This doesn’t mean the most valuable player, and in terms of the playoff hunt, the hardest player to replace isn’t necessarily the best one. Some teams are either cruising to the playoffs or effectively eliminated in practice, if not in purely mathematical terms (hello, Tigers and Royals). To answer this question, I ran the updated ZiPS projected standings after Tuesday’s games and then re-ran the entire simulation with the assumption that each relevant player missed the rest of the season due to injury.
For the NL, ZiPS estimates that nine teams remain plausible playoff contenders, which I define as having a 5% chance of making MLB’s new 12-team playoff format. The exceptions are the Diamondbacks, Cubs, Rockies, Pirates, Nationals, and Reds. Seven of the nine remaining teams are above 50%, with only the Phillies (27%) and Marlins (8%) between a coin flip and that arbitrarily chosen 5% threshold. Let’s jump right into the NL’s top 10 list.
Burnes was always going to make this top 10 list, but Brandon Woodruff‘s ankle injury and Freddy Peralta‘s more significant shoulder injury push him into the top slot. The hit may even be more severe than the -11% listed here; ZiPS puts a lot of stock in Aaron Ashby’s presence, but any kind of forearm pain for a pitcher should lead fans to look sadly into the middle distance. Nobody on the Brewers comes even close to Burnes in playoff impact, so a nasty surprise here ought to make them very aggressive about picking up a pitcher. After all, we’re already into the Chi Chi González portion of the depth chart.
Ronald Acuña Jr. has a better projection than Olson, but ZiPS sees Atlanta’s options at first base to be relatively bleak. That was one of the team’s biggest questions back when Freddie Freeman was a free agent, and though Atlanta has patched together DH somewhat, all bets are off with a serious Olson injury. In the event he goes down, I expect it’s more likely that Austin Riley plays first with Phil Gosselin playing third than Adam Duvall or Eddie Rosario getting shifted to first, but since ZiPS isn’t a Gosselin-stanner, it thinks that’s only shuffling a hole around. Read the rest of this entry »
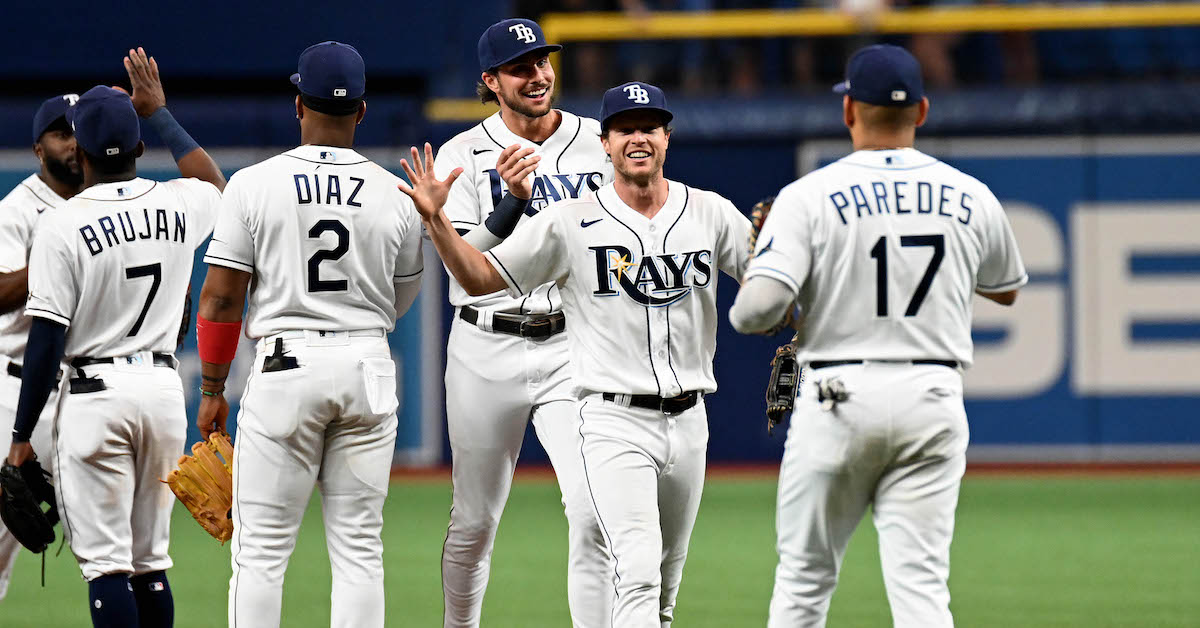
You can call the Rays unlucky, if you’d like. After amassing the second-most WAR from position players in all of baseball last year, 2022 has been a huge step back. They’re 18th in the league, with an aggregate wRC+ below 100, and injuries have taken a huge toll on the lineup they planned to run out at the start of the year.
Wander Franco, their wunderkind shortstop, hasn’t played since May 30. Brandon Lowe, perhaps the best hitter on the team, has been out two weeks longer than Franco. Manuel Margot had been picking up some of the offensive slack, but now he’s out with a knee injury that may cause him to miss significant time, and fellow outfielder Kevin Kiermaier hit the IL the same day. Mike Zunino was ineffective and is now hurt. Josh Lowe and Taylor Walls, two of the team’s top reinforcements coming into the year, have a combined 51 wRC+. Read the rest of this entry »
Miguel Cabrera, Albert Pujols, and Joey Votto are three of the best hitters of our generation. All are future Hall of Famers. They are also aging veterans. The illustrious threesome has combined to play 58 big league seasons, with Votto the baby of the bunch at 38 years old. Cabrera is 39. Pujols is 42. Their cumulative experience is nearly as notable as their prodigious statistical accomplishments.
What is it like to work with legends like Cabrera, Pujols, and Votto? I asked that question to their current hitting coaches: Detroit’s Scott Coolbaugh, St. Louis’ Jeff Albert, and Cincinnati’s Alan Zinter.
———
Scott Coolbaugh on Miguel Cabrera
“It’s a privilege and an honor to be around somebody as good as Miggy. He’s obviously a future Hall of Famer. To accomplish the things he’s been able to is eye-opening. I obviously haven’t been around him his whole career — just the last few years — but the way he goes about his business, and the enjoyment he has in the game… he’s still a young kid, even though he’s 39 years old. He treats it like a game. He has fun with it. He keeps it simple.
“Everybody is in awe of how pure of a right-handed hitter he is, how pure his swing is. The things he can do with the baseball a lot of guys have worked hard to do just one time. He does it on a consistent basis. It makes you a better coach to be around somebody like that, to see how he goes about it, and hear what his thoughts are. To sit in a cage and have the conversations with him… and sometimes it’s not even about hitting. It’s about how simple he keeps the game. Read the rest of this entry »
Who is baseball’s most irreplaceable player in 2022? This doesn’t mean the most valuable player, and in terms of the playoff hunt, the hardest player to replace isn’t necessarily the best one. Some teams are either cruising to the playoffs or effectively eliminated in practice, if not in purely mathematical terms (hello, Tigers and Royals). To answer this question, I ran the updated ZiPS projected standings after Tuesday’s games and then re-ran the entire simulation with the assumption that each relevant player missed the rest of the season due to injury.
For the AL, ZiPS estimates that 10 teams remain plausible playoff contenders, which I define as having a 5% chance of making MLB’s new 12-team playoff format. The exceptions are the Tigers, Royals, A’s, and Orioles. After this quartet, there’s a significant jump to the Rangers at 9% and the Angels at 10%. Sorry, there are no Yankees and Astros on this list with their respective big leads in their divisions. Let’s jump right into the AL’s top 10 list.
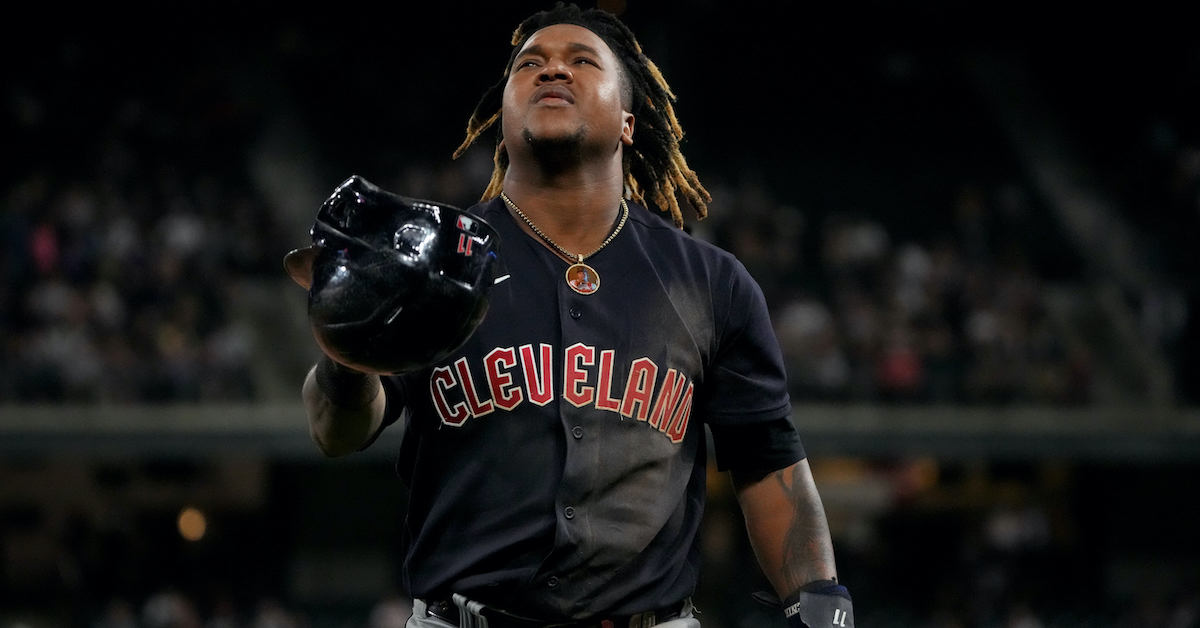
ZiPS projects the Guardians as only the third-best team in the weak AL Central despite currently being part of a first-place tie, which gives them about a coin flip’s chance to make the expanded playoffs. While both Andrés Giménez and Shane Bieber project to finish the season in All-Star territory at over four WAR, Ramírez remains the player who most drives Cleveland and the only one who could figure in the MVP race. Ernie Clement is the most likely player to step in if Ramírez was lost for the year — he’s already filling in for him — and that’s a massive downgrade for a team that generally needs things to go right in order to make the playoffs.
The fact that Devers ranks so highly should get the Red Sox thinking when the subject of a possible extension for their star third baseman comes up. Boston has surged back into the playoff picture in recent weeks, but its playoff hopes still rest on the edge of a knife, and the in-house replacements for Devers are a weak group. Bobby Dalbec and the returning Christian Arroyo would likely take over at third unless the team decided to move Enrique Hernández to the position. Suffice it to say that Boston’s not giving Devers a lot of time off to play some designated hitter. Read the rest of this entry »
What is your favorite baseball memory? I posed that question to 10 major league players, and in nearly every instance, the response began with a question of their own: “Does it have to be from my own career?” While all were happy to share one (or more) meaningful memory from their time in the big leagues, it was primarily magic moments from their days as fans and/or young amateurs that stood out the most.
“I have two. Being able to have all of my family members at the All-Star game with me in San Diego in 2016 is one. The other is having my family with me in London, England for the Red Sox-Yankees rivalry series [in 2019]. They were all with me for the [2018] World Series as well, so there are actually three: All-Star Game, World Series, and being able to travel all the way to London, halfway around the world, to watch me play. In no particular order, those would be my favorite baseball memories.” Read the rest of this entry »
The Yankees lost a rollercoaster game to the Blue Jays in Toronto on Sunday, bringing their nine-game winning streak to an end. The streak — the team’s second-longest of the season — helped the Yankees open up a double-digit lead in the American League East; even with the loss, New York is 49-17, 11 games ahead of Toronto (38-28). Two and a half months into the season, the Yankees’ performance has called to mind those of other recent powerhouses, including their hallowed 1998 squad. Given that they’ve matched the 1998 team’s record through 66 games, it’s worth taking a closer look.
The Yankees not only have the majors’ highest winning percentage (.742) and largest run differential (143), they’re miles ahead of the competition. Their winning percentage is 95 points higher than that of the second-ranked Mets (.647), who are playing at a 105-win clip, while their run differential is 29 runs better than the second-ranked Dodgers (114). Through 66 games, they’re tied for the fourth-highest win total of the live-ball era (since 1920):
Best Records Through 66 Games Since 1920
Tm
Year
W
L
Win%
Final W
Final L
Final Win%
Result
SEA
2001
52
14
.788
116
46
.716
Lost ALCS
NYY
1928
50
16
.758
101
53
.656
Won WS
NYY
1939
50
16
.758
106
45
.702
Won WS
PHA
1929
49
17
.742
104
46
.693
Won WS
BRO
1955
49
17
.742
98
55
.641
Won WS
DET
1984
49
17
.742
104
58
.642
Won WS
NYY
1998
49
17
.742
114
48
.704
Won WS
NYY
2022
49
17
.742
—
—
—
—
BAL
1969
48
18
.727
109
53
.673
Lost WS
PHA
1931
47
19
.712
107
45
.704
Lost WS
NYY
1932
47
19
.712
107
47
.695
Won WS
BRO
1942
47
19
.712
104
50
.675
2nd NL
BRO
1952
47
19
.712
96
57
.627
Lost WS
PHI
1976
47
19
.712
101
61
.623
Lost NLCS
SOURCE: Baseball-Reference
This shouldn’t be a surprise, given that just two weeks ago I noted that the Yankees’ start was the best since those 2001 Mariners. Of the other 13 teams with at least 47 wins through 66 games, 12 made the postseason and 10 the World Series, with seven winning the Fall Classic. But as you can see, most of those teams precede the expansion era, with its 162-game seasons (which began in 1961-62) and postseason playoffs (which began in 1969). For a more modern perspective, here’s a look at the best 66-game starts from the Wild Card Era (which began in 1995):
Best Records Through 66 Games Since 1995
Tm
Year
W
L
Win%
Final W
Final L
Final Win%
Result
SEA
2001
52
14
.788
116
46
.716
Lost ALCS
NYY
1998
49
17
.742
114
48
.704
Won WS
NYY
2022
49
17
.742
—
—
—
—
CLE
1995
46
20
.697
100
44
.694
Lost WS
BAL
1997
46
20
.697
98
64
.605
Lost ALCS
CHC
2016
46
20
.697
103
58
.640
Won WS
ATL
1998
45
21
.682
106
56
.654
Lost NLCS
CLE
1999
45
21
.682
97
65
.599
Lost ALDS
ATL
2003
45
21
.682
101
61
.623
Lost NLDS
NYY
2018
45
21
.682
100
62
.617
Lost ALDS
LAD
2019
45
21
.682
106
56
.654
Lost NLDS
SOURCE: Baseball-Reference
All 10 teams besides these Yankees made the playoffs, but only two won the World Series, which is either an argument that many of these teams peaked too early or an indictment (or at least an acknowledgment) of the tournament-like nature of the period’s postseason, where five games mean more than 162. It is nonetheless worth noting that those 10 other teams finished the year with a collective .650 winning percentage, the equivalent of a 105-win season. These were some kick-ass squads.
The current Yankees may not have the top spot on either of those lists, but they’ve matched the 1998 Yankees to this point. Their .742 winning percentage puts them on pace to win 120 games, which would surpass the 2001 Mariners and 1906 Cubs for the single-season record. Some other hypotheticals:
If the Yankees go 48-48 (.500) the rest of the way, they would finish 97-65 (.599).
If they go 55-41 (.573) the rest of the way, they would finish 104-58 (.642), their best record since 1998. This is one win ahead of the record that we have them forecast for via our Projected Standings.
If they go 60-36 (.625) the rest of the way, they would finish 109-53 (.673), surpassing the 2018 Red Sox (108-54) for the best record for any team since the 2001 Mariners.
If they go 66-30 (.688) the rest of the way, they would finish 115-47 (.710), surpassing the 1998 Yankees for the highest win total in franchise history, while if they go 67-29 (.698), they would finish 116-46 (.716), surpassing the 1927 Yankees (110-44, .714) for the highest winning percentage in franchise history.
If they go 68-28 (.708) the rest of the way, they would finish 117-45 (.722), surpassing both the 2001 Mariners in wins and the AL record-holding 1954 Indians in winning percentage (.721, via a 111-43 record).
If they go 75-21 (.781) the rest of the way, they would finish with a .765 winning percentage (124-38), topping the 1906 Cubs’ .763 (116-36) for the all-time record.
I don’t advise holding your breath in anticipation of any of this beyond perhaps the first couple of bullet points. That said, I will note that only the last of those scenarios listed above would require the Yankees to improve upon what they’ve already done.
Prior to losing on Sunday, the Yankees had won 16 of 17 games and 42 of their past 52, with that longer streak bookended by their winning streaks of 11 games (April 22–May 3) and nine (June 9–18). Their 40-10 record over a 50-game stretch has been surpassed by only a small handful of teams in the Wild Card era, namely the 1998 Yankees (41-9), 2002 A’s (41-9), ’13 Dodgers (42-8), ’17 Cleveland (42-8), and ’17 Dodgers (43-7). The 1997 Yankees, 2001 Mariners, ’02 Giants, and ’01 and ’05 A’s all topped out at 40-10 over their best 50-game stretches. Note that most of these teams had several overlapping stretches with the same record.
Lest anyone think that the current Yankees have been playing only the majors’ dregs during those runs, their two long winning streaks have included three-game sweeps of the Guardians and Rays, and series wins over the Blue Jays (twice) and Twins — all teams in playoff positions now. They’re 18-7 against those teams; they have yet to play the Astros, the other AL team occupying a playoff slot. Overall, they’re 20-8 against teams with a .500 or better record, and 24-11 within the AL East, a division that has three other teams with a .537 winning percentage or better, two of which would qualify for the playoffs.
The Yankees can win all types of ways. They’re 14-3 in blowout games, those decided by five or more runs; their .824 winning percentage in that context is the majors’ best, though both the Dodgers (16-4) and Twins (16-14) have more wins (and losses) in such games. Meanwhile, they’re 14-5 in one-run games, where their .736 winning percentage is again tops, though the Blue Jays (17-8) have more wins (and losses) in such games.
In terms of run differential, the Yankees have outscored opponents by 143 runs, 2.17 per game, the fourth-largest margin of the live-ball era, and they have the second-best Pythagorean record of that period:
Highest Pythagorean Winning Percentages Since 1901
Team
Year
W
L
W-L%
Dif/Gm
pythW-L%
Result
NYY
1939
106
45
.702
2.70
.734
Won WS
NYY
2022
49
17
.742
2.17
.731
—
LAD
2020
43
17
.717
2.27
.712
Won WS
NYY
1927
110
44
.714
2.43
.709
Won WS
NYY
1942
103
51
.669
1.91
.698
Lost WS
STL
1944
105
49
.682
1.80
.697
Won WS
STL
1942
106
48
.688
1.76
.696
Won WS
LAD
2022
40
25
.615
1.78
.687
—
BAL
1969
109
53
.673
1.62
.679
Lost WS
HOU
2018
103
59
.636
1.62
.675
Lost ALCS
SEA
2001
116
46
.716
1.85
.672
Lost ALCS
CLE
1948
97
58
.626
1.74
.672
Won WS
LAD
2021
106
56
.654
1.66
.672
Lost NLCS
CLE
1954
111
43
.721
1.55
.672
Lost WS
NYY
1998
114
48
.704
1.91
.670
Won WS
PHA
1929
104
46
.693
1.89
.668
Won WS
NYY
1953
99
52
.656
1.68
.668
Won WS
NYY
1936
102
51
.667
2.15
.666
Won WS
NYY
1937
102
52
.662
1.96
.666
Won WS
CHC
2016
103
58
.640
1.56
.665
Won WS
SOURCE: Baseball-Reference
Since I’m comparing a team that has played 66 games against ones that played 154 or 162, I left the 2020 Dodgers in the mix, as they serve to remind that extremes can be reached in smaller samples. That said, the second-highest Pythagorean winning percentage from that pandemic-shortened season belonged to the Padres, whose .633 is just 64th among all teams since 1920, so it’s not like the leaderboard was overrun due to my choice or that those Dodgers’ dominance was illusory.
(Note that Baseball Reference, from which all of this data was culled, uses the 1.83 exponent in its Pythagorean formula [(RS^1.83 + RA^1.83)/(RS^1.83)], whereas our site uses the PythagenPat formula, in which the exponent is derived from the league’s per-game scoring environment via the formula X = ((RS + RA)/G)^.285. By the latter formula, the Yankees’ Pythagenpat winning percentage is .730, though when I started writing this the difference was a few points larger. No matter; by either formula, they’re only about one win shy their actual record, which is to say that whatever they’re doing isn’t particularly fluky.)
Inevitably, since they’ve matched the 1998 Yankees’ record to this point, the comparisons have already begun, particularly in a YES Network broadcast booth that often features David Cone and/or Paul O’Neill. Yes, it’s hard to set aside what we now know about the way that the careers of the “Core Four” — Hall of Famers Derek Jeter and Mariano Rivera plus Andy Pettitte and Jorge Posada — as well as the memorable supporting cast (including Hall of Fame manager Joe Torre), turned out. While all but Posada had played critical roles in the team’s championship two years earlier, the Core Four and the rest of their roster had not yet solidified their places in history circa 1998. Those Yankees were merely on their way to becoming the dynasty that would win four titles in five years, with some even bigger campaigns and legend-defining October performances awaiting them individually.
Keep in mind that in 1998, AL teams averaged 5.01 runs per game, whereas this year, they’re averaging 4.17 per game, so any comparison of raw statistics is misleading; one needs to adjust for the scoring context. With that, the numbers tell us that so far, the current Yankees have been better on both sides of the ball relative to the league — particularly on the run prevention side.
1998 Yankees vs. 2022 Yankees
Yr
R/G
PA
AVG
OBP
SLG
wRC+
WAR
WAR/650 PA
1998
5.96
6444
.288
.364
.460
116
36.1
3.6
2022
5.15
2496
.249
.328
.444
122
14.8
3.9
Starters
Yr
RA/G
IP
ERA
ERA-
FIP
FIP-
WAR
WAR/200 IP
1998
4.05
1061.1
3.85
85
4.11
91
18.4
3.5
2022
2.98
366.2
2.80
73
3.26
80
8.0
4.4
Bullpen
Yr
RA/G
IP
ERA
ERA-
FIP
FIP-
WAR
WAR/200 IP
1998
4.05
395.1
3.76
83
4.24
94
2.8
1.4
2022
2.98
225.2
2.95
77
3.20
79
3.4
3.0
On the offensive side, the 1998 squad was certainly more balanced, with left field (where Chad Curtis shared the job with Tim Raines, with Ricky Ledee, Darryl Strawberry, and Shane Spencer also making notable contributions) the only one without a regular with a wRC+ of 100 or better. Bernie Williams (158 wC+) led the way on the offensive side but played in just 128 games due to a knee injury. Behind him were a quartet of full-timers in the 122-129 wRC+ range in O’Neill, Jeter, Scott Brosius, and Tino Martinez, as well as a roster with incredible depth, with Torre able to call upon the likes of Strawberry, Raines, and later in the year Spencer and Chili Davis. Jeter topped the team with 6.2 WAR, with O’Neill (5.4), Brosius (5.0) and Williams (4.9) not far behind.
That team didn’t have anybody performing in the stratosphere of Aaron Judge, who’s hitting for a 189 wRC+ and is currently on pace for 61 homers and 9.3 WAR. Three other full-timers have a wRC+ of 135 or higher in Anthony Rizzo (142), Giancarlo Stanton (140) and Gleyber Torres (137), and catcher Jose Trevino (132) has been nearly as good in part-time duty. Yet this lineup has gotten underwhelming offensive contributions from left field (Joey Gallo‘s 96 wRC+) and shortstop (Isiah Kiner-Falefa’s 86 wRC+), and center fielder Aaron Hicks (90 wRC+) struggled so much early that Judge has started there 30 times.
As for the pitching, I wrote about the current Yankees’ rotation recently. The unit has been the key to the Yankees’ success thus far, consistently turning in good-to-great starts. All five starters — Gerrit Cole, Nestor Cortes, Jordan Montgomery, Jameson Taillon, and Luis Severino — currently have an ERA- ranging from 51 (Cortes) to 87 (Severino), and a FIP- ranging from 70 to 92 (same guys), which is to say that they’ve been substantially better than league average. The 1998 Yankees’ big three (Cone, David Wells, and Orlando Hernandez) were every bit as good, but Pettitte (95 ERA-, 95 FIP-) was not at his best that year, and Hideki Irabu (88 ERA-, 115 FIP-) and fill-in Ramiro Mendoza (85 ERA-, 97 FIP- in 14 starts) were solid but more erratic. The older group averaged almost a full inning more per turn (6.55 vs. 5.56), but on a per-inning basis, the younger group has been stingier — and more valuable, at least as measured by our version of WAR.
That’s true of the bullpen as well, where it’s important to note that for as good as Rivera had already become, the 1998 season was not his best; his 77 FIP-, as strong as it was, would stand as the worst of his career besides his rookie season, 15 points higher than his eventual career mark. Lefty setup man Mike Stanton (120 ERA-, 103 FIP-), whose 79.1 innings was second among the relievers, was uncharacteristically subpar, and righty Jeff Nelson (84 ERA-, 87 FIP-) was only healthy enough to throw 40.1 innings; he missed over two months due to lower back woes.
While this year’s unit has lacked a dominant Aroldis Chapman, Clay Holmes (7 ERA-, 38 FIP-, and no, those aren’t misprints) has been ungodly thanks to his incredible sinker; in fact, his streak of consecutive scoreless outings (29) and innings (31.1) recently surpassed Rivera’s franchise records, set in 1999. Michael King (63 ERA-, 45 FIP-) has been dominant in a multi-inning role thanks to his four-pitch mix. The real question is whether the unit can continue to withstand the losses of Chad Green to Tommy John surgery and Jonathan Loaisiga to a shoulder strain, and whether Chapman is past his Achilles woes. It may take more than what’s on hand to keep this unit afloat.
It’s a long summer, and the season still has nearly 100 games to go. Regression lurks around every corner for a team playing at such a blistering clip as these Yankees; a losing streak or a couple of sluggish weeks at any point could put an end to the type of history-minded comparisons I’m making. On the other hand, continued play at this pace could invite more detailed comparisons than the thumbnail sketch I’ve provided. These Yankees’ pace and performances to date tell us that they have a chance to join the pantheon of great ball clubs. Solidifying their spot will be another matter.
Among catchers this season, Willson Contreras has been the talk of the baseball town. It’s easy to understand why: Here’s a fan favorite suddenly having a career-best season in a walk year. That grabs everyone’s attention. Suddenly, fans of others teams find themselves hoping that their favorite club will land him at the deadline or possibly this offseason. On the sabermetric side, there’s mounting evidence that Contreras has indeed taken a step forward. A catcher with this much offensive upside is a rarity, and with a robust 161 wRC+, the veteran has turned himself into prized jewel.
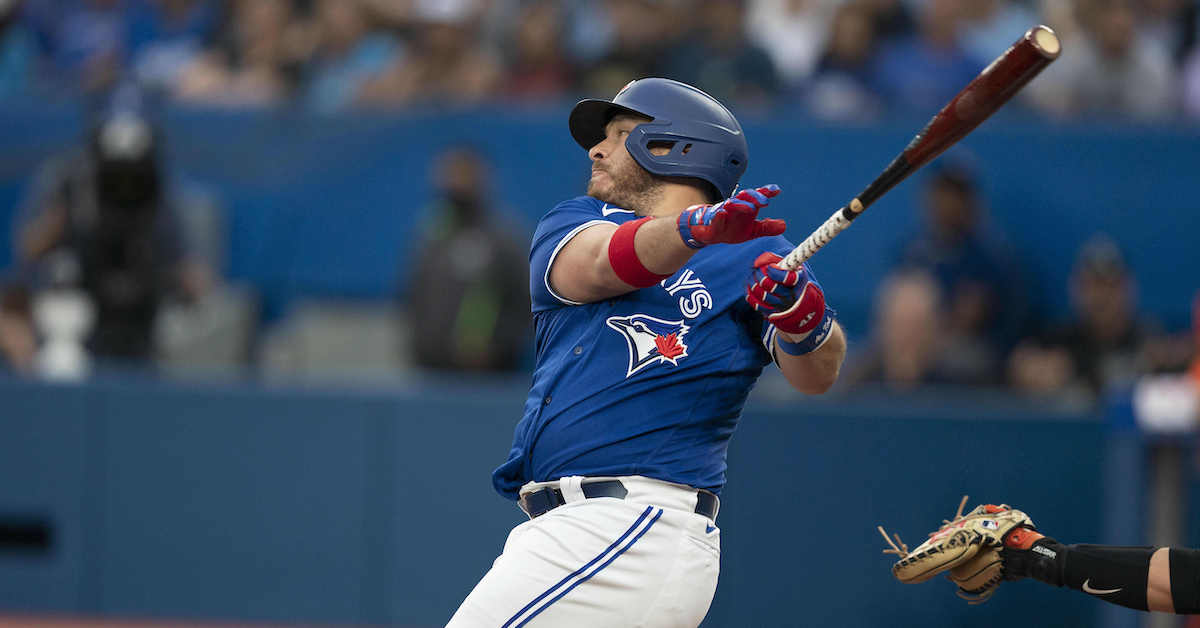
But enough about the Cubs or Contreras. Do you know who’s second in catcher wRC+ this season? That’s right, it’s Alejandro Kirk, who’s been the Blue Jays’ primary backstop ever since Danny Jansen headed to the IL with a fractured finger. His 146 wRC+ isn’t too far behind Contreras’, and the corresponding triple slash is a beauty: a .311/.392/.469 line is somewhat of a rarity in today’s game.
Kirk’s output might not be so surprising if you paid attention to his minor league numbers. Starting with Rookie ball in 2017, he raked at every level to which he was assigned, notching more walks than strikeouts, which led to a well-deserved big-league promotion in 2020. The Blue Jays gave him a proper chance the following year, and while he was serviceable, a 106 wRC+ in 189 plate appearances didn’t exactly leave a strong impression. This year, however, Kirk looks like the unstoppable force his minor league track record suggested he could be. Read the rest of this entry »
The St. Louis Cardinals played Friday night’s game in Boston with one catcher. Iván Herrera had been called up from Triple-A to replace the newly-sidelined Yadier Molina, but cancelled flights delayed his arrival. The highly-regarded prospect didn’t get to Fenway Park until the final inning of a 6-5 Red Sox win.
Asked who would have been used in an emergency had Andrew Knizner been injured, St. Louis manager Oliver Marmol named three possibilities: Edmundo Sosa, Brendan Donovan, and Nick Wittgren. That Marmol added, “Not necessarily in that order,” is intriguing, if not suggestive. Sosa and Donovan are infielders. Wittgren toes the rubber.
Might we have seen Wittgren, a 31-year-old pitcher with no professional experience at any another position, donning the tools of ignorance? It’s a definite possibility. Prior to the game, Marmol approached Wittgren and asked, “How do you think you’d do catching?” Wittgren replied that he’d be perfectly fine. Marmol responded with “I think so too.”
According to The St. Louis Post-Dispatch’s Derrick Goold, Wittgren isn’t the first Cardinals pitcher to be designated (or at least hinted) as an emergency catcher. Jason Motte, who worked out of the St. Louis bullpen from 2008-2014 previously claimed that distinction. Even so, Motte had caught in the minor leagues. Wittgren would have been a novice.