Brad Keller and Drew Pomeranz Are Rejuvenated Relievers in Chicago
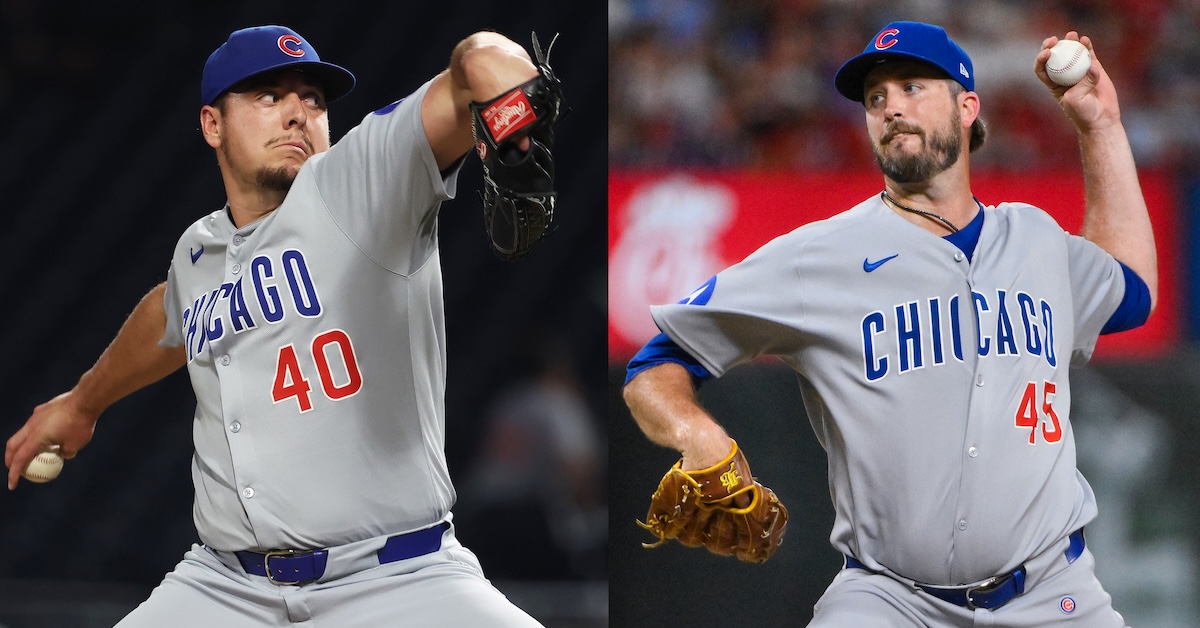
Brad Keller and Drew Pomeranz have been bullpen stalwarts for the Chicago Cubs this season. The former made a club-high 68 appearances during the regular season and pitched to a 2.07 ERA and a 2.94 FIP over 69 2/3 innings, while the latter toed the rubber 57 times and put up a 2.17 ERA and a 3.36 FIP over 49 2/3 innings. Working primarily in setup roles, the right-left duo combined for six wins, four saves, and 39 holds. Not bad for a pair of hurlers who were essentially reclamation projects when they reported to spring training.
Now with his fourth team in the past three seasons, Keller was 9-22 with a 5.05 ERA from 2022 to 2024. Moreover, one year ago, he lost all four decisions while logging a 5.44 ERA. As for Pomeranz’s recent numbers… well, there weren’t any. Hampered by multiple arm injuries, the southpaw hadn’t taken the mound in a big league game since August 2021. At age 36, he had quite possibly reached the end of the road.
Keller’s path has included injury-related speed bumps as well. Most notable was the righty being diagnosed with Thoracic Outlet Syndrome, which required him to go under the knife after the 2023 season. Read the rest of this entry »