The calendar has flipped over to May, and a handful of teams have jumped out ahead in the standings. Behind them sit a huge mass of mediocre ballclubs all jostling for position but struggling to stand out in one way or another.
Last year, we revamped our power rankings using a modified Elo rating system. If you’re familiar with chess rankings or FiveThirtyEight’s defunct sports section, you’ll know that Elo is an elegant solution that measures teams’ relative strength and is very reactive to recent performance. To avoid overweighting recent results during the season, we weigh each team’s raw Elo rank using our coin flip playoff odds (specifically, we regress the playoff odds by 50% and weigh those against the raw Elo ranking, increasing in weight as the season progresses to a maximum of 25%). The weighted Elo ranks are then displayed as “Power Score” in the tables below. As the best and worst teams sort themselves out throughout the season, they’ll filter to the top and bottom of the rankings, while the exercise will remain reactive to hot streaks or cold snaps.
First up are the full rankings, presented in a sortable table. Below that, I’ve grouped the teams into tiers with comments on a handful of clubs. You’ll notice that the official ordinal rankings don’t always match the tiers — there are times where I take editorial liberties when grouping teams together — but generally, the ordering is consistent. One thing to note: The playoff odds listed in the tables below are our standard Depth Charts odds, not the coin flip odds that are used in the ranking formula.
Complete Power Rankings
| Rank |
Team |
Record |
Elo |
Opponent Elo |
Playoff Odds |
Power Score |
Δ |
| 1 |
Dodgers |
23-11 |
1610 |
1500 |
98.4% |
1610 |
0 |
| 2 |
Cubs |
21-14 |
1565 |
1541 |
76.3% |
1564 |
1 |
| 3 |
Mariners |
20-13 |
1559 |
1501 |
80.1% |
1560 |
4 |
| 4 |
Padres |
22-11 |
1556 |
1500 |
59.3% |
1559 |
6 |
| 5 |
Tigers |
22-13 |
1553 |
1494 |
84.2% |
1556 |
-1 |
| 6 |
Mets |
22-13 |
1549 |
1485 |
79.1% |
1551 |
-4 |
| 7 |
Phillies |
19-15 |
1544 |
1508 |
70.0% |
1541 |
2 |
| 8 |
Giants |
22-13 |
1535 |
1489 |
54.9% |
1537 |
-3 |
| 9 |
Braves |
15-18 |
1535 |
1508 |
64.6% |
1528 |
-1 |
| 10 |
Yankees |
19-15 |
1528 |
1499 |
80.6% |
1527 |
-4 |
| 11 |
Guardians |
20-14 |
1525 |
1489 |
41.0% |
1526 |
5 |
| 12 |
Diamondbacks |
18-16 |
1530 |
1512 |
51.4% |
1526 |
-1 |
| 13 |
Royals |
19-16 |
1523 |
1488 |
41.9% |
1522 |
5 |
| 14 |
Astros |
17-16 |
1515 |
1498 |
54.8% |
1512 |
-1 |
| 15 |
Athletics |
19-16 |
1499 |
1477 |
22.2% |
1499 |
7 |
| 16 |
Rangers |
17-18 |
1502 |
1517 |
39.6% |
1498 |
-4 |
| 17 |
Rays |
16-18 |
1501 |
1510 |
23.9% |
1496 |
-2 |
| 18 |
Red Sox |
18-18 |
1496 |
1477 |
50.3% |
1493 |
-4 |
| 19 |
Blue Jays |
16-18 |
1496 |
1515 |
31.2% |
1492 |
0 |
| 20 |
Reds |
18-17 |
1486 |
1479 |
11.7% |
1484 |
-3 |
| 21 |
Cardinals |
16-19 |
1489 |
1515 |
13.1% |
1483 |
2 |
| 22 |
Brewers |
17-18 |
1485 |
1484 |
17.6% |
1481 |
-2 |
| 23 |
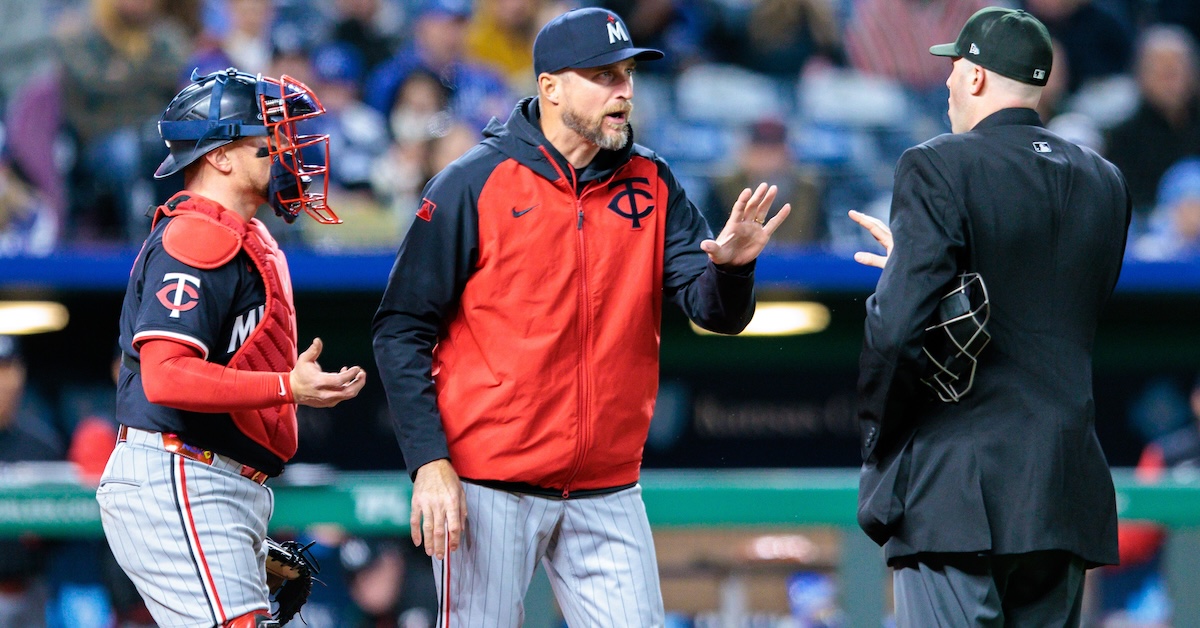
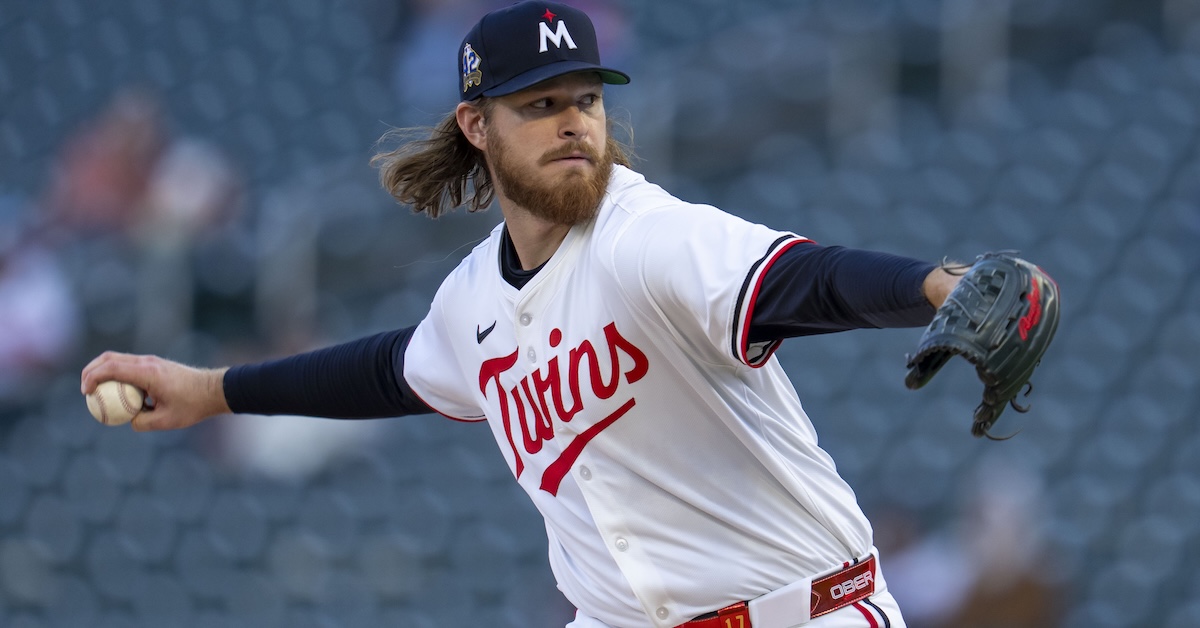
Twins |
15-20 |
1483 |
1484 |
35.5% |
1477 |
-2 |
| 24 |
Orioles |
13-20 |
1471 |
1506 |
13.4% |
1464 |
1 |
| 25 |
Nationals |
16-19 |
1466 |
1506 |
1.3% |
1461 |
-1 |
| 26 |
Angels |
13-20 |
1433 |
1496 |
1.3% |
1428 |
0 |
| 27 |
Marlins |
13-20 |
1432 |
1522 |
0.2% |
1427 |
0 |
| 28 |
Pirates |
12-23 |
1434 |
1501 |
2.1% |
1426 |
0 |
| 29 |
White Sox |
10-24 |
1369 |
1490 |
0.0% |
1365 |
0 |
| 30 |
Rockies |
6-28 |
1332 |
1515 |
0.0% |
1328 |
0 |
…
Tier 1 – The Dodgers
| Team |
Record |
Elo |
Opponent Elo |
Playoff Odds |
Power Score |
| Dodgers |
23-11 |
1610 |
1500 |
98.4% |
1610 |
The Dodgers had their seven-game win streak snapped on Sunday night, but that surge gave them the best record in baseball and a half-game lead over the Padres in the NL West. However, for as well as they’ve played this season, the Dodgers still have their issues, especially on the injury front. Last week began with Tyler Glasnow landing on the IL with shoulder inflammation — he was shut down from throwing for 10-14 days, and the Dodgers are expected to be cautious with him as he works his way back — and then Tommy Edman followed him a few days later after he hurt his right ankle on a slide. It’s the same ankle that Edman sprained last year while he was recovering from offseason wrist surgery and delayed his season debut until August; he did not sprain it this time around, and the Dodgers expect him to return as soon as he’s eligible to come off the IL on Saturday. The lineup hardly skipped a beat without the surprisingly powerful switch-hitter; Los Angeles put up double-digit runs in three games last week.
Tier 2 – On the Cusp of Greatness
| Team |
Record |
Elo |
Opponent Elo |
Playoff Odds |
Power Score |
| Cubs |
21-14 |
1565 |
1541 |
76.3% |
1564 |
| Mariners |
20-13 |
1559 |
1501 |
80.1% |
1560 |
| Padres |
22-11 |
1556 |
1500 |
59.3% |
1559 |
| Tigers |
22-13 |
1553 |
1494 |
84.2% |
1556 |
| Mets |
22-13 |
1549 |
1485 |
79.1% |
1551 |
The Cubs won both of their series against the Pirates and Brewers last week, beating up on some division rivals and pushing their lead in the NL Central to three games, the largest in baseball. They could be facing some more injury trouble as Shota Imanaga exited his start on Sunday with a hamstring injury. Not to be outdone, the Padres completed a perfect week with five straight wins. That streak got San Diego back on track after a pretty poor end to April. On the flip side, the Mets lost both of their series last week.
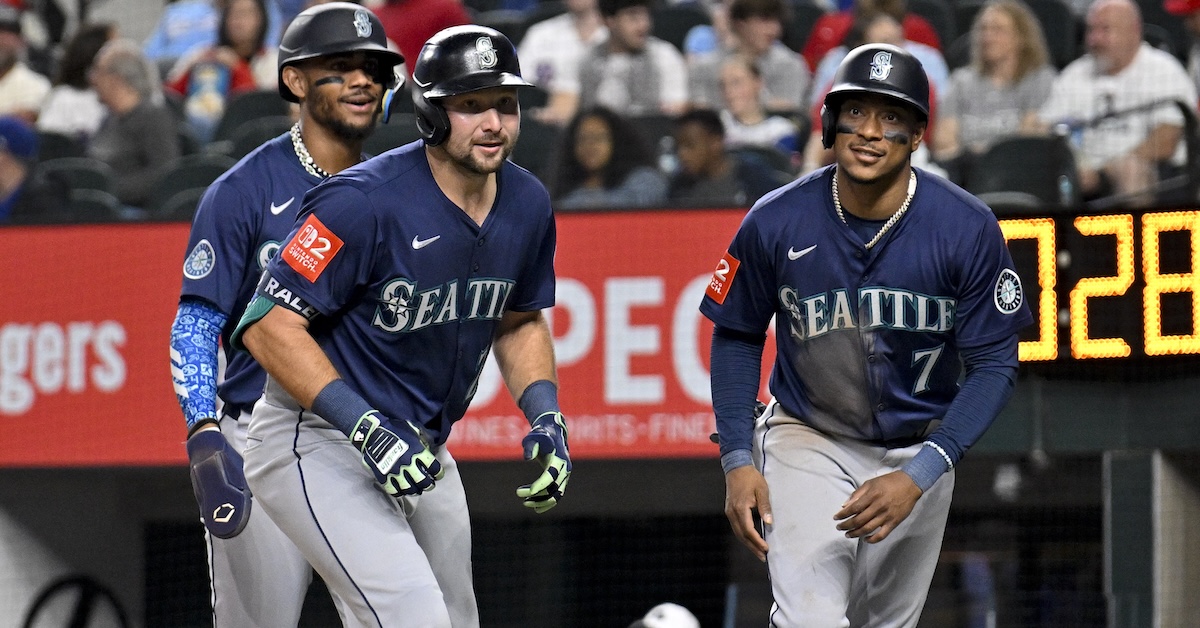
The Mariners’ ascent has continued despite some choppy seas. Not only did they lose Logan Gilbert to a minor forearm injury, but Luke Raley and Dylan Moore joined him on the IL last week, sapping the lineup of two key contributors. No matter, because Jorge Polanco is doing his best Aaron Judge impression, Cal Raleigh is leading the league in home runs, and role player Leo Rivas is enjoying some surprising success (182 wRC+ in 15 games). More importantly, key setup man Matt Brash was just activated off the IL over the weekend after rehabbing from Tommy John surgery, and George Kirby made his first rehab start as he works his way back from a spring shoulder injury.
Javier Báez lives! The erstwhile shortstop made the transition from the infield to center field a few weeks ago and has suddenly thrived in the new role. He’s collected hits in every game he’s started at his new position. Last week, he clubbed home runs in three straight games and his resurgence is a big reason why the Tigers have maintained the best record in the AL.
Tier 3 – Solid Contenders
| Team |
Record |
Elo |
Opponent Elo |
Playoff Odds |
Power Score |
| Phillies |
19-15 |
1544 |
1508 |
70.0% |
1541 |
| Giants |
22-13 |
1535 |
1489 |
54.9% |
1537 |
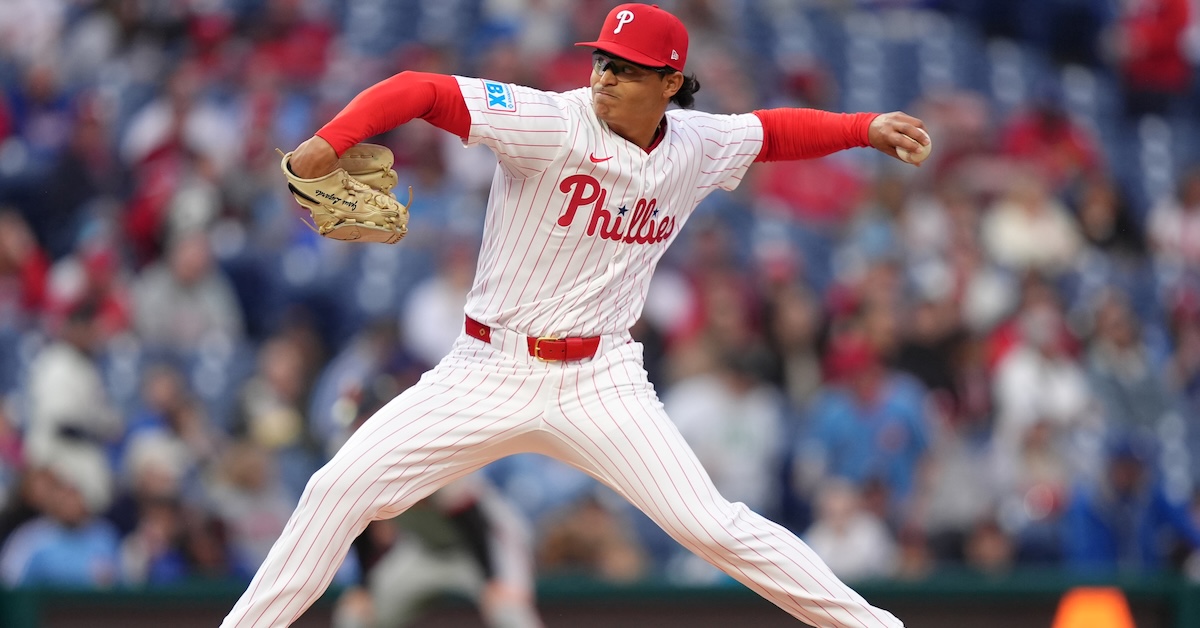
The Phillies could use some bullpen help. On Tuesday, Orion Kerkering blew a save against the Nationals when he allowed four runs in the top of the ninth inning, though his offense picked him up with two runs in the home half to walk it off. Philadelphia wasn’t so lucky on Sunday. This time it was José Alvarado who gave up four runs — one in the ninth and three in the 10th — leading to an ugly extra-innings loss to the Diamondbacks. By league- and park-adjusted ERA, the Phillies have the sixth-worst relief corps in baseball right now. Even so, despite the bullpen woes, they’ve won six of their last eight games and enter this week just 2.5 games behind the Mets in the NL East standings.
The Giants are no longer in first place, though they’ve mostly kept pace with the surging Dodgers and Padres. San Francisco enters this week as the third-place team in the NL West, but the club is just 1.5 games out of first. That early-season success isn’t much of a mirage, either. The Giants’ actual record is just a game better than their Pythagorean record and two games better than their BaseRuns record. Meanwhile, it seems shortstop Willy Adames is finally heating up. Last week, he slashed .348/.483/.826 with three home runs and a 251 wRC+ in 29 plate appearances.
Tier 4 – The Melee
| Team |
Record |
Elo |
Opponent Elo |
Playoff Odds |
Power Score |
| Braves |
15-18 |
1535 |
1508 |
64.6% |
1528 |
| Yankees |
19-15 |
1528 |
1499 |
80.6% |
1527 |
| Guardians |
20-14 |
1525 |
1489 |
41.0% |
1526 |
| Diamondbacks |
18-16 |
1530 |
1512 |
51.4% |
1526 |
| Royals |
19-16 |
1523 |
1488 |
41.9% |
1522 |
| Astros |
17-16 |
1515 |
1498 |
54.8% |
1512 |
Last week was a bit of a mixed bag for the two NL teams in this tier, as both the Braves and Diamondbacks went 3-3 and maintained their places on the fringe of the playoff picture. Arizona salvaged its weekend series with a wild Sunday win over the Phillies to go along with a series win over the Mets. All eyes are on ace Corbin Burnes, who is skipping his start this week due to a sore shoulder. Atlanta, meanwhile, escaped Colorado with a series victory but lost two of three against the Dodgers over the weekend.
Aaron Judge can’t do it all. He extended his hitting streak to 14 games on Sunday — and on the season he has a ludicrous .423/.510/.777 slash line with 11 home runs, a 261 wRC+ and 3.4 WAR — but the Yankees lost both of their series last week to the Orioles and Rays. Luckily for New York, though, no one else in the AL East was able to take advantage of the hiccup; despite going 2-4 last week, the Yankees enter Monday’s series opener against the Padres with the same two-game lead that they held a week ago.
The Royals blasted seven home runs in their victory over the Orioles on Sunday; they had hit 18 total as a team heading into that contest. Following the barrage, they are now tied with the Pirates for the second-fewest homers in baseball. However, that lack of power hasn’t held them back over the last two weeks. Kansas City has won four straight series and is 11-2 during this stretch.
Tier 5 – The Muddy Middle
| Team |
Record |
Elo |
Opponent Elo |
Playoff Odds |
Power Score |
| Athletics |
19-16 |
1499 |
1477 |
22.2% |
1499 |
| Rangers |
17-18 |
1502 |
1517 |
39.6% |
1498 |
| Rays |
16-18 |
1501 |
1510 |
23.9% |
1496 |
| Red Sox |
18-18 |
1496 |
1477 |
50.3% |
1493 |
| Blue Jays |
16-18 |
1496 |
1515 |
31.2% |
1492 |
The Rangers fired offensive coordinator Donnie Ecker on Sunday, the second domino to fall after they demoted key offseason acquisition Jake Burger on Friday. Texas has lost five straight series and scored more than four runs just three times in its last 16 games, a truly miserable stretch. Meanwhile, the Athletics have become road warriors after going 5-2 on their latest trip — which included a huge series win over the Rangers — and pushing their record to 13-7 away from Sacramento. We’ll see if they can keep up their winning ways when they return home this week for series against the Mariners and Yankees.
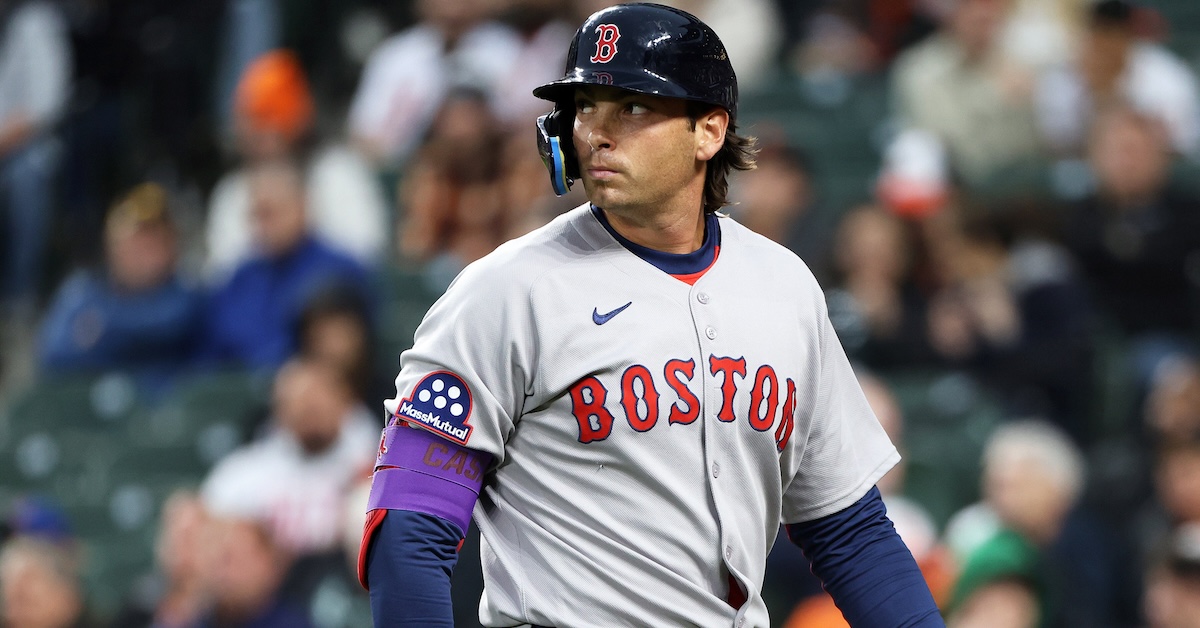
The Blue Jays and Orioles each moved one game closer to the Yankees during New York’s skid last week, but the Red Sox and Rays failed to gain any ground after matching the AL East leader’s 2-4 record. Boston has to be a little worried about its mounting injury woes; as soon as the team welcomed back Lucas Giolito, it placed Walker Buehler on the IL with a shoulder injury. The bigger blow came on Friday, when first baseman Triston Casas ruptured his patellar tendon; he’s out for the season after undergoing surgery on Sunday.
Tier 6 – No Man’s Land
| Team |
Record |
Elo |
Opponent Elo |
Playoff Odds |
Power Score |
| Reds |
18-17 |
1486 |
1479 |
11.7% |
1484 |
| Cardinals |
16-19 |
1489 |
1515 |
13.1% |
1483 |
| Brewers |
17-18 |
1485 |
1484 |
17.6% |
1481 |
| Twins |
15-20 |
1483 |
1484 |
35.5% |
1477 |
| Orioles |
13-20 |
1471 |
1506 |
13.4% |
1464 |
| Nationals |
16-19 |
1466 |
1506 |
1.3% |
1461 |
The one saving grace for the Orioles last was the collective poor play from the rest of the AL East. They started the year with 48% odds to make the playoffs; they’re at 13.4% right now and time is growing shorter for them to turn things around. Baltimore’s series win over the Yankees at the beginning of last week could have been that turning point, but the O’s followed it up with a series loss to the Royals.
The Nationals have been on a quiet run of good play over the last few weeks. Despite going 3-3 last week, they’re 9-7 over their last 16 games. At the forefront are two guys they acquired in the big Juan Soto trade a few years ago. James Wood has pushed his wRC+ up to 157 after collecting eight hits last week, and MacKenzie Gore’s strikeout rate is now up to 36.4% on the season after striking out nine in another solid start on Sunday.
Tier 7 – Laying the Foundation
| Team |
Record |
Elo |
Opponent Elo |
Playoff Odds |
Power Score |
| Angels |
13-20 |
1433 |
1496 |
1.3% |
1428 |
| Marlins |
13-20 |
1432 |
1522 |
0.2% |
1427 |
| Pirates |
12-23 |
1434 |
1501 |
2.1% |
1426 |
After starting the season with a promising 9-5 record, the Angels have won just four of their last 19 games. To make matters worse, Mike Trout landed on the IL with a bone bruise in his left knee. Prior to hurting his knee, Trout had been showing some good power — his nine home runs are tied for fourth in the AL — but his overall batting line (a 97 wRC+) left a lot to be desired.
Tier 8 – Hope Deferred
| Team |
Record |
Elo |
Opponent Elo |
Playoff Odds |
Power Score |
| White Sox |
10-24 |
1369 |
1490 |
0.0% |
1365 |
| Rockies |
6-28 |
1332 |
1515 |
0.0% |
1328 |
A rain-shortened win over the Astros on Sunday gave the White Sox a rare series victory and their fifth win in their last 10 games. Amazingly enough, their run differential is just a single run worse than that of the Guardians, who are 10 games up on them in the standings. This little “hot” streak has pushed the South Siders ahead of their historically inept pace from last year, though they’re still tracking to lose well over 100 games this season.