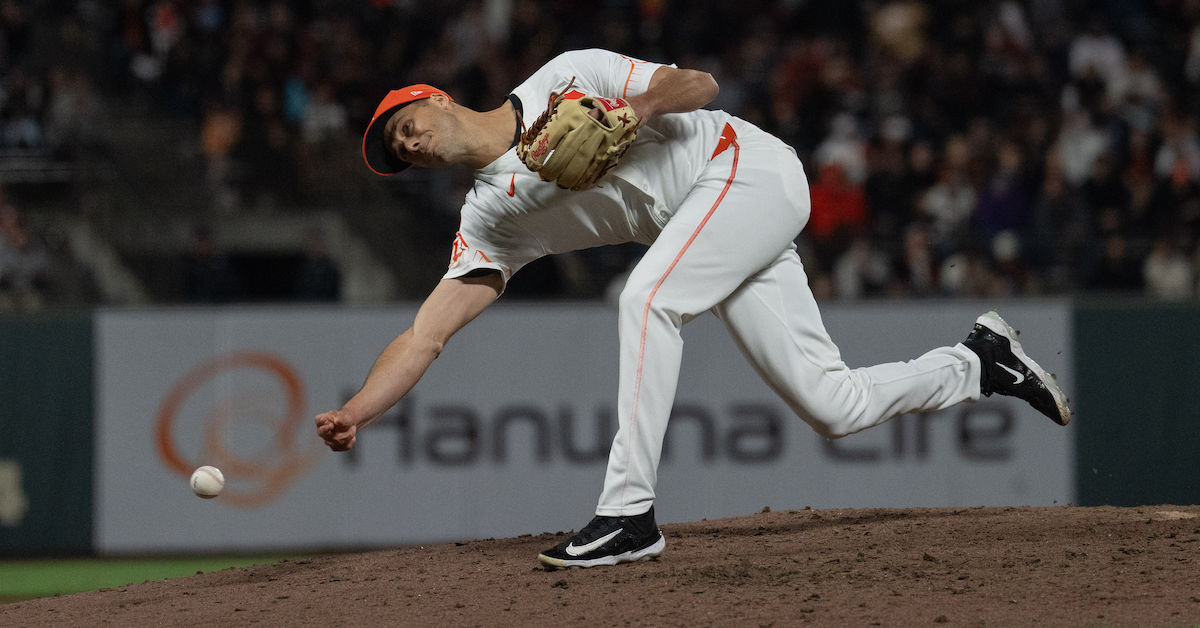
Last offseason, the Mets got in early on the starting pitching market. They signed Luis Severino in late November, later pairing him with Sean Manaea atop their rotation. Both deals were modest and short term, essentially chances for the players to rebuild their résumés while pitching for a playoff contender. And that’s exactly what happened. So now, with Severino and Manaea in line for larger paydays, the circle of life restarts: The Mets have signed Frankie Montas to a two-year, $34 million deal with an opt out after the first year.
At surface level, Montas doesn’t seem like a blockbuster signing. He just posted a 4.84 ERA (and 4.71 FIP, this wasn’t some weird BABIP issue) in his first year back after missing most of 2023 due to a shoulder injury. He’s about to turn 32. His last excellent season was in 2021. The list of drawbacks is lengthy.
Ah, but “knowing which drawbacks to overlook” might be David Stearns’ superpower. Manaea was coming off of two straight abysmal seasons when he signed in New York, and Severino hadn’t been great since 2018. But both had the capability to excel – they already had in their careers, and not in a fluky way. The right surroundings, the right defense, a pinch of luck here and there: It wasn’t hard to see how those two deals could work out. Likewise, Montas might have been down in 2024, but I have no trouble talking myself into an improved 2025.
Montas has never been a pure bat-missing strikeout machine. When he was at his best in Oakland, he did everything just well enough for the total package to work. He struck out more batters than average, walked fewer than average, kept the ball in the ballpark, and went six or so innings a start. No one would mistake him for Cy Young, but doing a bunch of things well added up to an ERA in the mid-3s. That’s a clear playoff starter, exactly what the Mets need. Read the rest of this entry »
Technically, there wasn’t much at stake. Even though Mason Miller was looking to protect a one-run lead with two outs in the 10th inning of an early September clash, the A’s and Rangers were playing out the string, battling for wins in a lost season. For Wyatt Langford, however, it meant something more.
On the first pitch, Miller fired 101 mph down the middle. Langford was aggressive, fouling it straight back for strike one. He watched 102 mph sail high, then flicked his bat to foul off an up-and-in 101-mph heater to fall into a 1-2 hole. A slider sailed outside before he fouled off pitches at 102 mph and 103 mph to stay alive, and then he laid off two wicked sliders to secure the base on balls. Langford faced down some of the best stuff in baseball, and emerged the victor.
It was just a walk, but it sparked a resurgence. After a dismal five months, Langford exploded in September, posting a 180 wRC+ and leading the American League in WAR. In the series following his successful encounter with Miller, he blasted titanic tanks off Luke Weaver and Clay Holmes, catching up to heaters at the top of the zone and depositing hanging sweepers deep into the left field bleachers.
It led to a question: Was September reflective of Langford’s new level? The answer, in part, was conditional on prior expectations.
And the expectations were certainly high heading into the season. After landing in Texas with the fourth overall pick in the 2023 draft, Langford incinerated the high minors, posting a .360/.480/.677 line across four levels and 200 plate appearances. ZiPS pegged Langford’s 50th percentile outcome above three wins, reasonably confident that Langford would go from the SEC to an above-average regular in the span of a year. As Cactus League play began, the hype train picked up steam; Langford hit .365 with six homers, leaving no doubt as to whether he’d start the year on the big league roster.
It turns out hitting in the majors is hard. No longer was Langford tasked with fending off the pitching staff of Mississippi State or the El Paso Chihuahuas; instead, he had to deal with Chris Sale sliders, Hunter Greene fastballs, and Tarik Skubal changeups.
Fittingly, he looked like a rookie. The plate discipline was there early on; his walk and strikeout rates hovered around league average, suggesting that Langford was not completely overmatched like his rookie counterpart Jackson Chourio, who struck out over 32% of the time in March and April. But Langford’s batted ball quality was lacking. He slugged just .314 in April, lifting heaps of lazy fly balls into outfield gloves.
Whereas Chourio found his footing in the summer months, logging a 144 wRC+ in June and never looking back, Langford’s line remained stubbornly subpar — until the final month of the season. Finally, as the Rangers slogged through their September schedule, Langford went bananas. His .300/.386/.610 line and excellent baserunning led to 1.6 WAR in that month alone, trailing only the infernal Shohei Ohtani.
There are a few potential stories to tell about the Langford rookie campaign. One is that he ran into a few poorly located pitches across a small sample. Another is that Langford made his adjustments, just as Chourio clearly did, accumulating enough experience against major league stuff to leverage his immense tools.
ZiPS, as always, splits the difference. The projection system sees Langford as a 3.8 WAR, 128 OPS+ guy next year, baking in Langford’s transcendent minor league results with a slight skill bump as he heads into his age-23 season.
But splitting the difference is no fun. This approach, applied to players across the league, will lead to more accurate projections. There is no good empirical reason to weigh September results more heavily in the next season’s forecast. But there is a temptation, at least on my end, to believe that Langford is going to be the player we saw in September moving forward.
In this version of the narrative, the expectation for Langford’s sophomore campaign isn’t just an All-Star 4-WAR season, as ZiPS forecasts; it’s something more like 5 WAR as the 50th percentile expectation, mirroring the age-23 projections for recent breakouts Corbin Carroll and Julio Rodríguez.
To make that argument persuasively, it would require evidence that Langford identified and then fixed the flaws that held him back across his first 400 or so plate appearances. And there is at least some reason to believe he did.
There is no one culprit for a hitter’s poor performance. The reasons are layered and complex; it could be an issue with certain pitch types or certain locations, for example. In Langford’s case, it seemed like at least one of the issues was structural, tied to his hitting mechanics. Both he and Rangers offensive coordinator Donnie Ecker believed his swing was too vertical.
Even two weeks into the season, it was clear that Langford needed to adjust. There was one clear potential area of improvement: His distribution of weight on his swing. In a story written by Steve Kornacki (no, not that Steve Kornacki) at MLB.com, Ecker was quoted as saying that Langford’s mechanical tendencies needed a reboot.
“[Langford] came from college and regularly has not faced breaking balls that are breaking 18 to 20 inches,” Ecker told Kornacki. “So, some of the body position he was in in college is now starting to evolve. If you look where the pressure is at, maybe in college it was on his back side. All of the best hitters in the big leagues, their pressure, when they land [on swings], is in the middle of their body. So, he’s slowly evolving from a guy that’s back, to having to get over the center that’s in the middle of our body.”
Esteban Rivera, FanGraphs’ resident hitting mechanics expert, explained to me that loading up weight on the backside makes it easier for hitters to whip their barrel under the ball and therefore generate power. This approach works well in college, where hitters aren’t generally exposed to high velocity and see a lot of mistake pitches. It works less well when Brandon Pfaadt is spinning sweepers that teleport across the width of the plate. Esteban also pointed out that fastballs on the inner half or sliders off the plate could trouble a hitter with a swing oriented toward crushing middle-middle mistakes.
Langford, for his part, appeared well aware of the problem.
“We’re working on getting back to that center mass, and not staying back too much,” Langford said in April. “It’s caused me to swing a little more up than I wanted, and I’m leveling out my swing. That’s helping me see the ball better.”
The early results were not favorable. Langford’s average launch angle climbed each month, from 16 degrees in April all the way to 23 degrees in August. Perhaps as a result, he was flummoxed by sweepers and sliders thrown by same-handed pitchers; through August, his wOBA was .234 on these pitches. He was even worse on hard inside fastballs; his .205 wOBA on high-velocity sinkers and four-seamers thrown on the inner half ranked among the worst in the league.
But in September, the swing leveled out. Langford’s average launch angle in September — 11 degrees — was the lowest of any month in the 2024 season. And the results — perhaps coincidentally, perhaps not — followed.
On inside heat, Langford never really adjusted. But he started crushing fastballs left out over the plate as well as hanging breaking balls, staying back long enough to identify spin and punishing mistakes. A good portion of his damage came on swings like this double against Marcus Stroman, lasering sliders at the knees into the right-center field gap:
These improvements coincided with a change to his setup. In April, he was hunched at the moment of the pitcher’s foot strike, looking to my amateur eye more like a slap hitter:
But during his month of destruction, Langford stood much more upright, ready to attack balls at any depth or width.
Langford’s apparent mechanical adjustments, prospect pedigree, and chronologically convenient damage distribution leads to questions about the nature of projections. Prospect evaluators, including our own Eric Longenhangen, were unbothered by his slow start. In his Top 100 Prospects Update in May, as Langford sat sidelined with a hamstring injury, Eric wrote that he expected Langford would “be an offensive star upon his return, and probably pretty quickly,” noting that the “huge tools and plate coverage” remained intact. It was just a matter of adjusting.
In his final month of the season, Langford looked like the offensive star Eric expected. In most cases, a huge month should not be cause for altering a projection. Langford, though, could be an exception.
The Milwaukee Brewers have graduated a number of quality hitting prospects in recent seasons, with the likes of Sal Frelick, Garrett Mitchell, and Brice Turang emerging as bona fide big leaguers. Most notable among the arrivals is, of course, Jackson Chourio, who debuted this past spring just weeks after celebrating his 20th birthday. The sweet-swinging wunderkind wasted little time in establishing himself as one of the game’s brightest young stars.
More talent is on the way. Milwaukee’s pipeline is rife with promising young bats, one of whom possesses the raw talent to potentially follow in Chourio’s footsteps. Jesus Made not only put up a 169 wRC+ in the Dominican Summer League, the 17-year-old switch-hitting shortstop logged impressive contact rates, chase rates, and exit velocities. With barely over 200 professional at-bats under his belt, he is already a Top 100 prospect (his exact placement on our list is yet to be determined).
Brenton Del Chiaro has been front and center in the development of Chourio, Made, and others within the Brewers system. Recently promoted to assistant director of player development, the 45-year-old former catcher has been Milwaukee’s minor league hitting coordinator since December 2021. Prior to that, he served as an assistant hitting coordinator, and as a hitting coach in the Arizona Complex League.
In the latest installment of our Talks Hitting series, Del Chiaro discusses several of the system’s top prospects, as well as the philosophies that the hitting department adheres to.
———
David Laurila: How will your role change with the new title?
Brenton Del Chiaro: “Actually, not very much. It’s just a little bit of additional responsibility. I will continue overseeing hitting while also interacting with our full-season managers. I’m also going to have some lower-level roster responsibilities. So, still day to day with the hitting, but now interacting and overseeing our managers at the full-season affiliates and having some input on lower-level roster construction and playing time grids.” Read the rest of this entry »
A couple weeks ago, I introduced the We Tried Tracker, which we are using to document each time a team claims that it was also in on a free agent who signed elsewhere. I was truly moved by your response. Many of you sent excellent leads on social media. The tip line I set up, WeTriedTracker@gmail.com, received 30 emails and only 26 of them were spam, which seems like a pretty good ratio to me. As things have gotten cooking, we’ve added color coding to the tracker, and (at the suggestion of Twitter user @YayaSucks) links to the original reporting for each We Tried. I will do my best to keep tricking out the tracker until it’s so bright and confusing that looking at it hurts both your eyes and your brain. Thank you to everyone who reached out with a tip, and please keep up the good work! So many teams are out there trying right now, and it is both our responsibility and our great privilege to award them partial credit for those efforts.
According to the Free Agent Matrices (which now contain the We Tried Tracker), 13 free agents have signed so far. In theory, that means there have been 377 opportunities for a We Tried, but that might not be the most reasonable way to look at things. We have so far documented five We Trieds, and I’d say that going 5-for-13 strikes me as a solid batting average, especially this early in the process, when only two names from the Top 50 are off the board. With that, let’s dive into the week in We Tried.
The second official We Tried of the offseason came in controversial fashion. On November 21, Dodgers manager Dave Roberts and A’s manager Mark Kotsay spoke at the USC Sports Business Summit in a segment titled Inside the Dugout: A Fireside Chat. Maybe it’s because I went to a tiny liberal arts college, but I’m really blown away by the USC Sports Business Association’s Adobe Creative Suite budget. Somebody’s not messing around with Canva.
Below is a still from the event that I grabbed from the SBA’s Instagram reel. This isn’t necessarily the point, but I think we should all take a moment to note the conspicuous absence of a fire.
That’s not a fireside chat, my friends. That is just a chat.
While chatting, Kotsay mentioned that the A’s had talked to free agent Walker Buehler, but that Buehler had told them he didn’t want to play in Sacramento. Right out of the gate, Kotsay was testing the limits of the We Tried. They usually come from reporters, and when they do come from a team source, that source is almost never the manager. Moreover, Kotsay was speaking to a group of college students. He probably didn’t expect his words to get out to the general public at all. It just so happened that one of those college students, Kasey Kazliner, is also a sports reporter who wasn’t about to pass up the opportunity to break a story. Kazliner posted the comment 15 minutes into the chat. Less than 70 minutes after it ended, the hardworking R.J. Anderson had already published a full article about it for CBS Sports.
The second factor is that Buehler hasn’t signed anywhere yet. A week ago, I would have told you that by definition, We Trieds have to come after the free agent has actually signed, but after conferring with Jon Becker, I see now that I was wrong. A We Tried simply has to come when the team in question has decided that it’s out on a player, and if there’s one thing the A’s love, it’s getting the hell out of dodge. It may have been accidental, it may have come in a fraudulent fireside chat, and it may end up coming months before the player in question actually signs a contract, but the A’s have officially backed into the second We Tried of the season.
I have to be honest with you, I absolutely love that literally one day after creating the tracker we were already splitting hairs and getting pedantic about what counted and what didn’t count. What better way to spend the offseason than engaging in some light pedantry? And what’s the point of creating a leaderboard if you don’t get to argue about the score? That’s what makes it sports.
Two days before Thanksgiving, Christmas came early. Scoopslinger Jon Heyman set a season high by breaking three We Trieds in two posts. At 11:15 p.m. Eastern, he posted, “Red Sox were in on both Snell and [Yusei] Kikuchi before losing out. They seek rotation upgrades and have preferred a lefty.” This is a true classic of the form. There’s no quote, no attribution, and no supporting evidence. The Red Sox were simply “in on” Snell and Kikuchi, which could mean absolutely anything at all. Maybe they offered more money than the teams that actually signed them. Maybe they’d been meaning to look up their ERAs on the back of a Topps card. Either one would make Heyman’s words technically true. It’s the doubling up that makes it art, though. The Red Sox couldn’t have bothered to reach out to two different reporters, just for the sake of not making it look like they simply texted Heyman a picture of their shopping list? You have to ask yourself how many names could appear one announcement before you’d start to doubt its veracity. I think the answer is three. Say Max Fried signs somewhere on Tuesday, and Heyman posts that the Blue Jays were in on all of Fried, Snell, and Kikuchi. At that point, you’re in list mode. Once the reporter is using a serial comma, we’ve officially entered the realm of farce.
Shortly after Heyman’s post, Mark Feinsand cited a source who also included the Orioles to the mix of the teams that were in on Snell. But the night belonged to Heyman. Less than an hour later, he posted his third We Tried of the evening: “Yankees had a zoom call with Blake Snell just today. But their near total focus is on Juan Soto. Their plan Bs need to wait a bit.” This is really mixing it up. We’ve got one juicy detail to go on, and if there’s one thing I know, it’s that when you really mean business, you hop on Zoom. Sure, the Yankees have a private jet, but nothing says “I really, truly want to give you hundreds of millions of dollars” like a glitchy video call. There is no better way to entice a potential employee to join your organization than by forcing them to watch via webcam as the pallid November sunlight plays off the blotchy skin beneath your eyes and your reverb-drenched voice intones the magic words: “We think you’d look great in pinstripes.” Why didn’t the Yankees just announce that they’d sent Snell a carrier pigeon?
On Friday, Andy Kostka reported that the Orioles were in on Kikuchi as well, bringing them into a tie for first place with the Red Sox. More importantly, it gave “We were in on him” a commanding lead in terms of the language used. Of the seven We Trieds, four took the form of a team being “in on” the player, while three other phrasings were tied with just one instance. With that, our update is complete, and I’ll leave you with our first leaderboards of the offseason. We will keep tracking as the offseason continues, and as always, please let us know if you see a We Tried out in the wild.
BONUS CONTENT: Last week, Johnny Damon went on the “Shut Up Marc” podcast, hosted by Marc Lewis. He talked about signing with the Yankees following the 2005 season and described how the Red Sox made him the subject of a particularly cynical We Tried:
I had four great years there and then I accepted with the Yankees, the contract… A couple days later I get a package, a DHL package from the Red Sox: four-year, $40 million contract. And it’s like, ok… So that’s kind of showing faith that they offered me a deal so that can tell to the media that, “We offered them a contract, he just didn’t take it.” So yeah, that’s how things work.
The Miami Marlins are coming off of a 100-loss season, and a lack of bats had a lot to do with that. The NL East club scored the fewest runs in the senior circuit. The arms weren’t all that much better — only the Colorado Rockies allowed more runs — but there is light at the end of the tunnel. Sandy Alcantara and Eury Pérez are on track to return from Tommy John surgery, while Jesús Luzardo and Max Meyer should be healthy following comparably minor injuries. Moreover, the organization’s top pitching prospects have high ceilings. Pitching — especially young pitching — is the organization’s greatest strength.
Miami’s President of Baseball Operations largely agreed with that opinion when I presented it to him at last month’s GM Meetings in San Antonio.
“I think so,” Peter Bendix told me. “I hope so. We have a lot of guys I’m really excited about. I think that next year a lot of these guys have things to prove, whether that’s health, bouncing back from a disappointing season, just establishing themselves, or building on what they did last year.”
A pair of pitchers who are likely a few years away from reaching the big leagues stand out. One of them is is a now-20-year-old southpaw whom the Marlins drafted 35th overall in 2023 out of Andover, Massachusetts’s Phillips Academy.
“Thomas White is maybe the best left-handed pitching prospect in baseball,” said Bendix, whose opinion is by no means singular (Noah Schultz and one or two others are also in the conversation). “If you look at left-handed pitchers who were 19 years old, missed as many bats as he did, didn’t walk guys, limited hard contact, throw 95-plus, have a plus breaking ball, and have command, it’s a short list. Now it’s his job to go out there build on that, see what he can he can do with another full year underneath him.” Read the rest of this entry »
For the 21st consecutive season, the ZiPS projection system is unleashing a full set of prognostications. For more information on the ZiPS projections, please consult this year’s introduction and MLB’s glossary entry. The team order is selected by lot, and the next team up is the Athletics.
Batters
In the race for the worst franchise in baseball, the White Sox easily took the title in terms of sheer incompetence. But their out of touch owner who legitimately wanted to win can’t match up with the A’s John Fisher, who probably thought while watching Moneyball that Rachel Phelps was way too generous with her team spending. The A’s won 69-93 games, a respectable number as far as terrible teams go, but it left them in an awkward limbo: They’re not good enough to pretend to be playoff relevant, but not bad enough for young fans to someday tell tales to their grandchildren about the team’s notoriety.
In truth, there’s actually a lot to like about this set of projections, even if it’s distributed among things you don’t. Brent Rooker not only demonstrated that his 2023 breakout wasn’t a fluke, but he also had a second breakout this season that was even better than the first. Considering he ran a .362 BABIP, he’s likely going to give back at least some of the gains he made. How much he regresses is a source of disagreement between ZiPS and Steamer, but he’s conclusively proven that he’s not just some DH-type player who’s going to put up a 110 wRC+ and 1.7 WAR. Rooker is not young, so hopefully the A’s will trade him to a team with games that matter before he advances too far into his thirties.
Jacob Wilson gets a very solid projection, and ZiPS sees a bit of a bounceback campaign for Zack Gelof. I wouldn’t call ZiPS a full believer in Lawrence Butler or JJ Bleday, but it at least grants them adequacy, which is a step up for both from last year’s projections. ZiPS is decidedly negative on the mulligan stew in left field, and it isn’t buying Tyler Soderstrom as a first baseman, either. I have no idea if the Nick Kurtz projection is too high, too low, or just right given he has played almost no professional baseball. ZiPS does know his Wake Forest numbers, but college translations are more speculative than crypto currency with meme names.
One can argue the most disappointing parts of these projections aren’t the players on the parent club, but the minor leaguers. Past Wilson and maybe Kurtz, ZiPS just doesn’t see anyone in the system having major upside. I mean, Tommy White might suddenly become the offensive beast he was hoped to be, but the computer isn’t banking on it.
Pitchers
Eep. You know a team’s pitching projections aren’t going well when the player with the best projected ERA+ (Mason Miller) has a nearly 50-point edge over everyone else. One thing that used to keep the A’s from falling too far out of the pennant race was that, for a long time, this was a team that could churn out nondescript soft-tossing mid-rotation starters as if it owned a patent on the process. For the third consecutive season, however, the 2024 A’s didn’t have a single pitcher who started 20 games with an ERA+ of at least 100. This is hardly a filter for finding a Cy Young candidate! JP Sears had his moments in 2024, but at the end of the day, he’s simply a soft-tossing lefty without a strikeout pitch who can’t keep the ball down all that well, not any respectable team’s ace. Mitch Spence is interesting, but he isn’t missing bats in the majors yet. Our prospect team wrote that Joey Estes needed to develop a good secondary pitch, and that criticism rings true; he has a mediocre slider and changeup, meaning that his decent command hasn’t meant all that much.
I find J.T. Ginn and Osvaldo Bido more interesting. If Ginn keeps working with his sinker, he might have success in the majors for a while, and Bido at least makes it seem like there’s some adventure happening on the mound; his control is spotty, but he’s got a hard two-seamery sinker that I think could be a real weapon if he ever gets the hang of it. Most pitchers like Bido don’t work out in the long run, but I can squint my eyes and see a Bido breakout as a more tangible idea than what a Sears or Estes breakout would look like.
The bullpen is… not good. Miller projects for all of the bullpen’s WAR, which is fine if you think you’re going to use him for 500 innings. After Miller, there’s not a lot of correlation between spot in the pecking order and the ZiPS projection; Michel Otañez gets a decent projection in ZiPS, while Brady Basso probably doesn’t make the team, at least not in April.
The A’s have almost no guaranteed contracts, the only two right now being the recently agreed one-year pacts with Seth Brown and T.J. McFarland. Normally that would give a team some flexibility to fill some holes in free agency, but we all know that’s not going to happen. The Athletics will likely win somewhere between 65 and 72 games or so, and very little will be remembered about the season outside the weird stadium situation they’re in.
Speaking of that situation, projecting Sutter Health Field is a bit of a problem without data from past MLB games. It’s a pitchers’ park in the Pacific Coast League, but that’s not exactly telling given that the average park in the PCL would likely be a hitters’ park in the majors. I have a rough estimate of it as basically average, though I expect some outfielders might have a few adventures getting used to the caroms as the fences have some corners. The foul territory is much reduced, however, and that might mean something at the margins, considering you might be able to park a 747 in the Coliseum’s foul territory. Hopefully, by the time the A’s move again, I will have stopped calling the park “Sutter Home” after the winery.
Sutter Health Field graphic made by Szym. Depth charts constructed by way of those listed here. Size of player names is very roughly proportional to Depth Chart playing time.
Players are listed with their most recent teams wherever possible. This includes players who are unsigned or have retired, players who will miss 2025 due to injury, and players who were released in 2024. So yes, if you see Joe Schmoe, who quit baseball back in August to form a Norwegian Ukulele Dixieland Jazz band that only covers songs by The Smiths, he’s still listed here intentionally. ZiPS is assuming a league with an ERA of 4.11.
Hitters are ranked by zWAR, which is to say, WAR values as calculated by me, Dan Szymborski, whose surname is spelled with a z. WAR values might differ slightly from those that appear in the full release of ZiPS. Finally, I will advise anyone against — and might karate chop anyone guilty of — merely adding up WAR totals on a depth chart to produce projected team WAR.
Early last year, I wrote two articles exploring the handful of pitchers who decided that, depending on the handedness of the batter they were facing, they should change not just their pitch mix but something more fundamental about themselves as pitchers. Some drastically lowered their arm angle against same-handed batters, while some scooched from one side of the rubber to the other. I mostly wrote about these pitchers because they were fun to watch, but I also dived into the reasoning behind their decisions. It wasn’t hard to understand what they were thinking: All things being equal, throwing from a lower arm angle works better against same-handed batters, while a higher arm angle works better against opposite-handed hitters. I even had numbers to back it up. I ran correlation coefficients between the pitcher’s wOBA allowed and their release point, and I used average velocity as a sort of control variable.
Correlation Between Release Point and wOBA
Handedness
Velocity
Horizontal Release Point
Vertical Release Point
Same Side
-.15
-.11
.15
Opposite Side
-.22
.13
-.01
Minimum 800 pitches against relevant side.
The correlation coefficients in this table are quite small, but they indicate that when the pitcher has the platoon advantage, vertical release point matters a whole lot. In fact, in that sample, it has the same correlation to success as velocity, which is definitely a surprise. When the batter has the platoon advantage, vertical release point doesn’t have any bearing on their success, but horizontal release point does. That’s why some pitchers scooch all the way over to the opposite side of the rubber.
Now that you’re all caught up, it’s time to address the big flaw in those numbers. The problem with my data was that I wasn’t actually using the pitcher’s arm angle. I was using their release point – literally the spot in the air above the mound where the ball leaves their hand – as a stand-in. Read the rest of this entry »
The Cleveland Guardians are a pretty tightfisted organization. They spend infrequently, frugally, and deliberately. So I was amused when, some three weeks ago, they jumped to re-sign backup catcher Austin Hedges to a one-year, $4 million contract. That’s roughly 4% of what the Guardians spent on player payroll in total this past season — and on a backup catcher?
Now, Hedges is one of the league’s best defenders, at the position where defense is of the utmost performance. And by all accounts he’s the best clubhouse guy since Spanky from The Little Rascals. But he’s the worst hitter in the league. That’s not an exaggeration; Hedges hasn’t posted a wRC+ over 50 since 2018, and in his past two seasons he hasn’t broken 25.
Since 2019, Hedges is hitting .171/.234/.273. Of the 364 players who have taken 1,000 or more plate appearances over that time, Hedges is dead last in wRC+ by a huge margin. Jackie Bradley Jr. is in second-to-last place with a wRC+ of 67; Hedges is at 39. (Which speaks to how far you can get in baseball if you’re an elite defender and everyone likes you.) Read the rest of this entry »
If you’re a team in the market for a top starting pitcher this winter, cross one of the best off your holiday list. The Dodgers, a team desperately in need for dependable starting pitchers whose arms are fully connected at the shoulders and elbows, signed Blake Snell to a five-year contract worth $182 million. The deal also includes a $52 million signing bonus. Snell, one of last year’s big name free agents who signed a shorter-term deal after not getting the offer they wanted, started 20 games for the Giants in 2024, putting up a 3.12 ERA, a 2.43 FIP, and 3.1 WAR in a season that was marred by an adductor strain. Compared to last winter, when Snell’s fate went unanswered until he signed in late March, you might as well start calling him Blake Schnell. Wait, don’t do that, that’s a terrible joke even by my standards.
Left-hander Blake Snell and the Los Angeles Dodgers are in agreement on a five-year, $182 million contract, pending physical, sources tell me and @jorgecastillo. The World Series champions get the two-time Cy Young winner in the first nine-figure deal of the winter.
One of the biggest risks a team winning the World Series faces is complacency. It’s a perfectly natural thing to feel pleased with the moves that led to your team winning a championship, but a team that believes it can mostly stand pat and run it back is planting the seeds of its own demise. Even with all the talent on their team, the Dodgers still have significant roster holes to fill this offseason, and it’s a good sign for those hoping for a repeat that less than a month after hoisting the trophy, they’ve already addressed one of those weaknesses. Whatever one thinks of Dave Roberts as a manager, it’s difficult to deny that he did a convincing job this past postseason managing a pitching staff that basically had two healthy and reliable starting pitchers. The Dodgers won the World Series despite their injury-thinned rotation, not because of it.
Now, Snell isn’t the type to give you seven or eight innings per start. Who is in 2024, really? What Snell brings to the table – outside of being a really good pitcher – is that he has a pretty solid record when it comes to injury. That’s not to say that he doesn’t get hurt. On the contrary, only twice has he made at least 30 starts in a season. However, what he has avoided are the serious injuries that cause pitchers to miss months or entire seasons. His IL stints are generally for short-term nagging ailments, frequently adductor strains. His worst elbow injury was a procedure to remove loose bodies in his elbow about five years ago, not major reconstructive surgery. The Dodgers will be happy to get their five or six innings from him 25 or so times a year.
Given what the Dodgers have faced injury-wise these last few years, that may be especially valuable to them. Bad luck has to figure into some of these injuries, but their problems in October was the downside of the approach they’ve taken toward the pitching staff in recent seasons. The Dodgers haven’t really prioritized certainty among their pitchers. Instead, they’ve depended on high-upside, high-risk guys such as Tyler Glasnow, late-era Clayton Kershaw, and any of the young flamethrowers who dominate upon arrival before blowing out their arms. For the most part, the Dodgers have made this work because they’ve kept enough of these pitchers around to put together a capable rotation of four or five pitchers at any given moment. Generally, this has proven an effective strategy for the Dodgers, but this time, they rolled snake eyes a few times in a row, and ended up in a difficult situation at the most crucial time of the year. They made it work, but they are smart enough to recognize they might not be able to thread the needle through such a narrow margin for error again.
So, what about Snell himself? Let’s run the projections for him with the Dodgers.
ZiPS Projection – Blake Snell
Year
W
L
ERA
G
GS
IP
H
ER
HR
BB
SO
ERA+
WAR
2025
14
6
2.87
28
28
150.2
111
48
14
63
186
143
3.8
2026
14
5
3.05
28
28
147.2
113
50
14
62
176
134
3.5
2027
13
6
3.19
27
27
144.0
116
51
15
59
165
128
3.1
2028
12
6
3.38
27
27
138.1
117
52
16
58
153
121
2.7
2029
11
7
3.61
26
26
132.0
118
53
16
57
139
113
2.3
The Dodgers are projected as one of the absolute best teams for Snell to end up with, and ZiPS projects performance that it would value at five years, $144.2 million. That’s a bit below the actual $182 million deal he received, but then again, so is the actual contract itself! As with Shohei Ohtani, the top dollar figure becomes a bit less sexy when you consider how the deal is structured. Some of the money is deferred, to the extent that it drops the present value enough so that the deal is worth more in the neighborhood of $160 million instead.
In some respects, Snell’s 2024 season was more impressive than the 2023 campaign that earned him the second Cy Young award of his career. Snell allowed a lot of walks in 2023, but he survived it because he was excellent with runners on base. That’s the kind of thing that’s hard to sustain, but he didn’t have to in 2024, as he shaved off the extra walk per game he’d added the year before. Snell’s strikeout rate was the best of his career, and it was powered by a career best in contact percentage. Snell has been a successful starter in the majors for years, but he has more varied tools now than he did before. Most notably, his changeup has become more of a weapon against righties, especially with two strikes.
With Snell under contract, the Dodgers rotation looks something like this: Snell, Yoshinobu Yamamoto, Glasnow, and Shohei Ohtani, along with whichever one or two other starters are healthy at any given time. At least in the way-too-early ZiPS positional projections for 2025, Snell’s arrival leapfrogs the Dodgers over the Phillies, Mariners, and Braves for the top rotation in the majors, though things can change a bit depending on how your distribute the innings. And the Dodgers might not be done adding to their rotation, either. They are expected to be serious contenders to sign Roki Sasaki, and they could still bring back Kershaw on another one-year deal.
Does adding Snell fundamentally change the outlook for the Dodgers? Not really; they were always going to be a contender in 2025. However, what signing Snell does is give the Dodgers a better chance to get through the season with fewer surprises and go deep into the playoffs again. Not since the 1999-2000 Yankees a quarter century ago has a team won consecutive championships. Snell puts the Dodgers in a strong position to alter that factoid.
It’s a shame that “bunts are bad” has become one of the truisms at the core of the ceaseless, silly battle between old school and new school, stats and scouts, quantitative and qualitative assessment methods. It’s understandable, because “stop bunting so much” was one of the first inroads that sabermetric analysts made in baseball strategy. But that was 25 years ago, and while everyone kept repeating that same mantra, the facts on the ground changed.
Sacrifice bunts by non-pitchers have plummeted over the years, as they should have. In recent years, the bunts that are left, the ones that teams haven’t streamlined out of their game planning, are mostly the good ones. “Bunts are bad” never meant that in totality; it just meant that too many of the times that teams sacrificed outs for bases were poor choices. That’s become much more clear now that pitchers don’t bat anymore. The 2022 season, the first full year of the universal DH, set a record for most runs added by bunting. After a down 2023, this season was right back near those banner highs. So let’s recap the ways teams beat the old conventional wisdom and assembled a year of bunting that the number-crunchingest analyst on the planet could appreciate.
The Death of the Worst Sac Bunts
When is a good time to bunt? It’s complicated! It depends on where the defense is playing, the score of the game, who’s on base, the player at the plate, the subsequent hitters due up, and myriad other minor factors. But there’s one overwhelming factor: There are base/out states where bunts are almost always a bad idea, and the more you avoid those, the better.
Sacrifice bunting with only a runner on first almost never makes sense. You’re getting just a single advancement, and it’s the least valuable advancement there is. Getting a runner to third with only one out is an admirable goal. Moving two runners up is even better. Squeeze plays have huge potential rewards. Moving a guy from first to second just doesn’t measure up.
Likewise, bunting gets worse when there’s already one out in the inning. Plate appearances with runners on base are worth their weight in gold in the modern, homer-happy game. Crooked numbers are tough to come by, and the easiest way to get them is by stacking up opportunities to hit multi-run homers. When you already have a runner on base, bunts are always suspect. Bunts that cut out half of your remaining outs in the inning are even worse.
There are occasional circumstances where these types of bunts make sense. If the batter thinks they’ll beat out a hit fairly often, bunting gets better. The weaker the hitter and the better the subsequent lineup, the more attractive bunts get. Close games and speedy runners can tip the balance. It’s not a universally bad decision to bunt with only a runner on first, or to bunt with one or more outs, but the higher the proportion of bunts that move a runner to third with less than two outs, the better.
To get an idea of how much this has changed while removing pitchers from the equation, I looked at the 2015-2019 seasons and excluded all plate appearances from the ninth spot in the batting order. That’s not a perfect way of removing pitchers, but it gets pretty close. I used this to get an idea for what percentage of bunts came in favorable situations – with at least a runner on second and no one out.
In those years, 23.2% of bunts occurred in the best situations for a sacrifice. After removing bases-empty bunts, which are clearly a different animal, we’re left with bunts in situations where a sacrifice isn’t particularly valuable. Those ill-conceived bunts cost teams roughly 0.1 runs per bunt, a shockingly high number. All other bunts – attempts for a hit or attempts to move a runner to third with only one out – carried positive run expectancy. It’s just that there were so many bunts in bad spots.
In 2024, 31.7% of bunts came in “good sacrifice” situations, with a runner on second and no one out. Increasingly, the “bad sacrifice” situations are now about going for a single with some ancillary benefits of runner advancement. On-base percentage on bunts with runners on base is up. In 2024, 25% of the bunts with runners on base ended with the batter reaching base safely, via hit, failed fielder’s choice, or error. That’s up from 22% (non-pitcher) in the 2015-2019 era, and from 17.7% from 2008 to 2012. If anything, that understates it too: Plenty of the worst hitters in baseball used to bat in front of pitchers, which limited their bunting opportunities.
Impressive Individual Efforts Jose Altuve bunted 14 times this year. Nine of those turned into singles. That was the best performance by anyone with double-digit bunts, but it was hardly the only exceptional effort. Jake McCarthy bunted 21 times and racked up 10 singles. Luke Raley went 7-for-12. This one from Altuve was just perfect:
That’s not to say there have never been good bunters before. Dee Strange-Gordon consistently turned bunts into singles at a high clip. Altuve has been in the majors for a while. But the high-volume bunters in today’s game are more effective than they were 10 years ago in the aggregate. There are also fewer truly objectionable bunters. Francisco Lindor bunted 20 times in 2015 and reached base safely only three times. Fellow 2024 Met Jose Iglesias bunted 12 times and reached base once. There were still some bad bunters – Kevin Kiermaier and Kyle Isbel had awful results, for example – but it’s become far less common.
Bunting for a single is hardly the only positive outcome, of course. That’s why you bunt in the first place – because bunts lead to more productive outs, on average, than swinging away. Advancement is more likely and double plays are less likely. Individual efforts of the top few bunters have always been net positive. These days, those top bunters are accounting for a bigger share of overall bunts, and the results have improved proportionally.
Bunters Were Already Good
Here’s a secret: The wars were already over. In 2002, bunters batting in the 1-8 spots in the lineup cost their teams 36 runs relative to a naive expectation based on the base/out state when they batted. In 2004, that number swelled to -63 runs. It was negative in 11 of the 12 seasons from 2000-2011, with roughly 2,000 bunts a year from this cohort, which largely excludes pitchers.
The number of non-pitcher bunt attempts declined as the 21st century progressed into its second decade. By 2015, we were down to 1,500 a year or so and steadily declining. The bunts excised from the game were all the lowest-value bunts, the ones most likely to hurt the batting team. From 2012 onward, non-pitchers have produced positive value on their bunt attempts every single year. Meanwhile, bunt attempts have declined and then stabilized, around 1,100-1,200 per year. Teams aren’t dummies – they’ve cut out 800 bunts a year, or more than 25 per team, and those bunts are pretty much all the no-hope-for-a-single sacrifice attempts that drew statistically minded folks’ ire in the first place.
In that sense, you’re not really seeing anything completely new in 2024. The very best bunters in the game are a little bit better than they used to be, but not overwhelmingly so. They’re choosing better spots, but not overwhelmingly so. They’re succeeding more frequently when they aim for a hit, but good bunters have always been good at that. The real change is in the bunts that aren’t happening.
The Mariners
I’ll be honest: I didn’t expect the Mariners to top the list of best bunting teams. They seem too station-to-station, too offensively challenged, too reliant on the home run. What can I say? Appearances can be deceiving. Led by Raley, an unlikely but enthusiastic bunter, the Mariners had a league-best performance. This one was just perfect:
It was a great situation for a bunt. The Astros were shifted over toward Raley’s pull side, which left third baseman Alex Bregman on an island covering third and prevented him from crashing early. Raley disguised the bunt long enough to get everything moving, and then used his sneaky-blazing footspeed to beat it out. It’s a masterpiece of bunting.
Victor Robles is less about masterpieces and more about maximum effort. He bunts too often for his own good. That leads to a lot of iffy bunts, but also some gems:
That’s another one where reading the defense made all the difference. The Rays shifted their middle infielders away from first, which meant a bunt past the pitcher would leave Yandy Díaz helpless. This one also benefited from a bit of defensive confusion, as many good bunts do. Who was covering second when Díaz fielded the ball? More or less no one:
Hey, every little bit helps when you’re bunting. And while plenty of other Mariners contributed to their success as well – Leo Rivas and Jorge Polanco know how to handle a bat – I had to close this out with another gem from Raley. Sure, it’s against the White Sox, but those runs count too. Raley is just vicious when it comes to attacking good spots to bunt:
It’s not every day that you see a squeeze bunt go for a no-throw single. But again, Raley read the defense and placed the ball perfectly. Not much you can do about this:
Altuve might have the advantage in raw numbers, but no one made me sit up in my seat hoping for a bunt like Raley did this year. Hat tip to Davy Andrews for highlighting his hijinks early in the year, and Raley just never stopped going for it.
The Angels
By all rights, this article should be over. The Mariners were the best bunters this year, Raley was their ringleader, and they exemplified the way bunts are making offenses better in today’s game. But the Angels are altogether more confusing and more giffable, so I’m giving them a shout too.
You’d think that Ron Washington’s team would be at the very top of the bunt rate leaderboards, but the Halos attempted only 25 bunts this year, half the Mariners’ tally and seventh-lowest in baseball. The reason why is obvious: They weren’t that good at it. They weren’t the worst team in terms of runs added – that’d be the Nats, who were both prolific and bad at bunting this year – but they were impressively inefficient. No one with so few bunt attempts was nearly so bad in the aggregate.
They bunted in bad spots. They rarely reached base even when the defense was poorly positioned. This might be the worst bunt attempt you’ve seen this year:
Unless it’s this:
The lesson: Stop with all these squeeze bunts. Unless it’s against the White Sox, that is:
See, our story has a happy ending for the bunters after all. I love bunts, and I’m not afraid to use this platform to show it.