Archive for Featured Photo

Contributions to Variation in Fly Ball Distances

Back in early 2013, I wrote a guest article for Baseball Prospectus entitled “How Far Did That Fly Ball Travel?” In that article, I posed a seemingly simple question: Can we predict the landing point of a fly ball just after it leaves the bat? A more precise way to ask the question is as follows: Suppose the velocity vector of a fly ball just after leaving the bat is known, so that the exit velocity, launch angle, and spray angle are all known. How well does that information determine the landing point? I then proceeded to investigate the question, at least for home runs, with the aid of HITf/x data for the initial velocity vector and the ESPN Home Run Tracker for the landing point and hang time. Using a technique described in the article, that information was used along with a trajectory model to reconstruct the full trajectory and extrapolate it to ground level to determine the fly ball distance. The answer to the question was immediately obvious: The initial velocity vector poorly determines the fly ball distance.

This conclusion led naturally to the next question: Why? One obvious reason is variation in atmospheric conditions, especially wind. However, the data revealed that the variation in home run distance for given initial velocity was as large in Tropicana Field, where the atmospheric conditions are expected to be constant, as in the rest of the league. So that was eliminated, at least as the primary culprit.

The article then went on to consider variation in two other parameters that play a role in fly ball distance: backspin ωb and drag coefficient CD. Neither of these parameters were directly measured. Rather they were inferred, along with the sidespin ωs, in the procedure used to recreate the full trajectory. The analysis showed the following:

  • For a given value of CD, distance increases as ωb increases. This makes sense, since larger backspin results in greater lift, keeping the ball in the air longer so that it travels farther.
  • For a given value of ωb, distance decreases as CD increases. Again this makes sense, since greater drag is expected to reduce the carry of a fly ball. Interestingly, this was the first appearance in print of a suggestion of a significant ball-to-ball variation in the drag properties of baseballs.
  • There was a moderately strong positive correlation between CD and ωb, suggesting that the drag on a baseball increases with increasing spin, all other things equal. Although this effect is well known for golf balls and had been speculated for baseballs in R. K. Adair’s excellent The Physics of Baseball, to my knowledge this is the first real evidence showing the effect for baseballs.
  • Given that both lift and drag increase with increasing ωb and that they have the opposite effect on distance, it was tentatively concluded that at high enough spin rate there would be no further increase (and perhaps even a decrease) in distance with a further increase in spin.

Read the rest of this entry »


Will a Player Hit .400 This Season?

The 2020 season, assuming it happens and is completed, is sure to have some quirky statistics that will be tough to wrap our heads around. The home run leader might not even get to 20 dingers this year. A three-win season might lead all of baseball. And while batting average has fallen out of favor as the be-all, end-all of a hitter’s talent at the plate because walks matter and getting a double is better than getting a single, hits are an undoubtedly good pursuit for batters. As such, the aura of batting average still maintains some glow when contemplating the history of baseball. The pursuit of a .400 batting average in a shortened season due to a pandemic will not and should not be viewed with the same historical significance as Ted Williams’ run in 1941, or even George Brett’s 1980 campaign or Tony Gwynn’s strike-shortened 1994 season, but it would make this season a little more fun.

Ty Cobb, George Sisler, and Rogers Hornsby all put up batting averages above .400 nearly 100 years ago, while Ted Williams was the last player to hit that mark nearly 80 years ago. The list of players who have even hit .375 since then is a short one: Stan Musial’s .376 (1948), Williams’ .388 (1957), Rod Carew’s .388 (1977), George Brett’s .390 (1980), Tony Gwynn’s .394 (1994), and Larry Walker’s .379 (1999). The last player to hit above .350 was Josh Hamilton, who hit .359 in 2010. History has shown that if a very high batting average is your goal, the odds are very much stacked against you in a full season. Shrink the season down to just 60 games, though, and we might get a fighting chance. Read the rest of this entry »


A 60-Game Season Is a Boon to Middling Teams’ Playoff Odds

Back in March, my colleague Dan Szymborski wrote a piece about how playoff projections changed based on the length of the season. At the time, all we knew was that the season had been suspended, and that whatever season we eventually got was likely to be shorter than the one we expected at the start of the calendar year. How many games we’d ultimately lose was a mystery — Dan ran projections for 140 games, 110 games and, most pessimistically, 81 games. After observing the results, he reached the reasonable conclusion that the shorter the season is, the more margin there is for worse teams (on paper, at least) to sneak into the playoffs, and for supposedly elite teams to fall short.

Three months later, it turns out even 81 games was too ambitious of a dream. After much back-and-forth with the players, owners have officially decided to enact a season of just 60 games, beginning on July 23 or 24 and concluding in the final week of September, when a typical regular season would have also finished. With that number officially in place, our playoff odds have been updated to reflect the dramatic shortening of the season, and the result is a similarly dramatic re-imagining of teams’ fortunes:

FanGraphs Playoff Odds, 162-game season vs. 60-game
Team 162-game Playoff% 60-game Playoff% 162-game WS% 60-game WS%
Yankees 88.8% 75.2% 14.4% 11.6%
Rays 69.0% 59.7% 6.7% 6.3%
Red Sox 34.5% 39.1% 1.9% 2.6%
Blue Jays 1.8% 7.9% 0.0% 0.2%
Orioles 0.0% 0.1% 0.0% 0.0%
Team 162-game Playoff% 60-game Playoff% 162-game WS% 60-game WS%
Twins 68.3% 62.2% 7.3% 6.4%
Indians 43.6% 48.2% 3.3% 3.7%
White Sox 29.0% 37.0% 1.4% 2.0%
Royals 0.9% 5.9% 0.0% 0.1%
Tigers 0.1% 2.2% 0.0% 0.0%
Team 162-game Playoff% 60-game Playoff% 162-game WS% 60-game WS%
Astros 91.6% 78.7% 18.1% 15.2%
Athletics 48.1% 43.2% 3.4% 3.4%
Angels 18.3% 27.7% 0.8% 1.4%
Rangers 0.9% 11.7% 0.2% 0.4%
Mariners 0.1% 0.9% 0.0% 0.0%
Team 162-game Playoff% 60-game Playoff% 162-game WS% 60-game WS%
Nationals 66.7% 53.3% 5.0% 4.8%
Braves 58.2% 52.7% 4.0% 4.8%
Mets 42.6% 40.7% 2.3% 2.9%
Phillies 18.1% 23.6% 0.5% 1.0%
Marlins 0.4% 3.2% 0.0% 0.0%
Team 162-game Playoff% 60-game Playoff% 162-game WS% 60-game WS%
Cubs 53.0% 48.4% 3.2% 3.4%
Reds 35.0% 39.5% 1.7% 2.4%
Brewers 33.8% 37.9% 1.5% 2.1%
Cardinals 29.5% 34.8% 1.1% 1.8%
Pirates 0.8% 5.2% 0.0% 0.0%
Team 162-game Playoff% 60-game Playoff% 162-game WS% 60-game WS%
Dodgers 97.6% 86.3% 21.0% 20.3%
Padres 40.7% 36.4% 1.6% 2.1%
Diamondbacks 17.1% 23.1% 0.4% 0.8%
Rockies 5.8% 10.9% 0.0% 0.3%
Giants 0.7% 4.2% 0.0% 0.1%

This table is helpful because it includes all of the information that forms the base of what we’re discussing here — the changes in each team’s playoff and title odds with a shortened season — but to be honest, looking at each team individually like this doesn’t really drive home the kind of shift that has occurred. On its own, the Rangers moving from a 1-in-100 chance at the postseason to a 1-in-10 chance or the Yankees falling from a nearly 9-in-10 chance to a 3-in-4 chance is interesting, but doesn’t really fundamentally change our thinking. The Rangers are probably out, and the Yankees are probably in. Instead, let’s group teams together by their playoff odds, and see how that distribution plays out under the two season lengths:

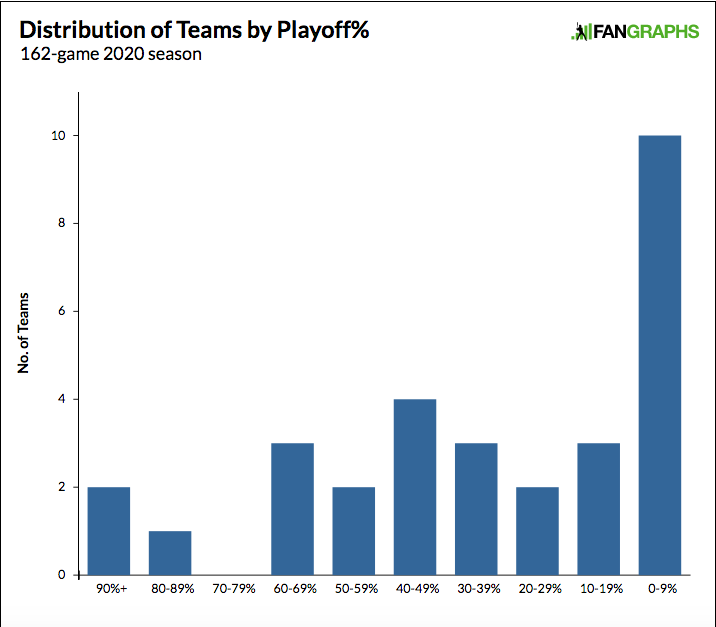
This better conveys the heart of the changes — from both the front and back of the spectrum, teams have been pulled into the middle. In a 162-game season, 20 teams had playoff odds of either above 60% or below 20%. In a 60-game season, just 14 teams have such a distinction, meaning that a plurality of teams now fall somewhere between a 1-in-5 and 3-in-5 shot.

While the Rays and Nationals have been pulled in from the front of the pack, we see many more teams creeping up from what used to be the bottom tier of actual playoff hopefuls. The Angels make a huge jump relative to their peers, moving from 18.3% playoff odds to 27.7%, while the White Sox (28% to 37%), Diamondbacks (17.1% to 23.1%), and Phillies (18.1% to 23.6%) bite similar chunks out of the advantages the teams ahead of them once had.

And if the gap between 20% and 60% playoff odds I mentioned just above still sounds like a big one, it really isn’t in theory. Consider that under our 162-game projections, the Braves were given a 58.2% shot at the playoffs and an expected win total of 86 games. The Angels, meanwhile, had just an 18.3% chance at the playoffs, with an expected win total of 83 games. That’s three measly games separating two teams with a 40% gap in their playoff odds. Now, to be clear, more goes into playoff odds than just win total. The Braves play in a division without a clear-cut favorite, and in a league where just one team was projected to win 90 games, while the Angels’ division does have a clear-cut favorite, and play in a league that includes four teams expected to win 90 games. Context plays a big role here, but the slim difference in their win totals does show you just how little could separate a team with 1-in-5 playoff odds from a team with 3-in-5 odds.

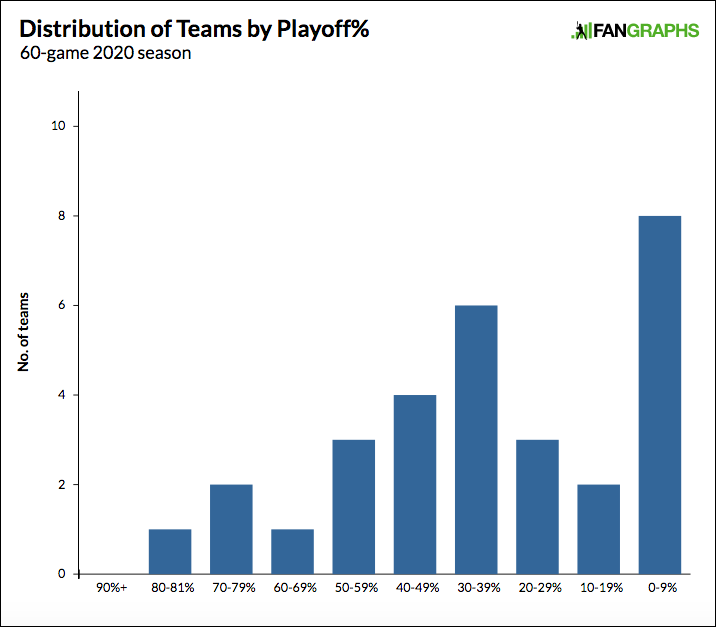
That’s in a 162-game season. Cut that total down to 60, and the projected win distribution invites even more chaos:

Look at that tall bar on the left. That includes the Washington Nationals, who are projected to win their division and finish with the second-best record in the NL, and the San Diego Padres, who have less than a 15% chance to win their division and are projected to have the eighth-best record in the NL. Fewer than two wins, on average, separate them now. That’s how you go from two teams being 26 points apart in playoff odds to them being just 17 points apart.

This extreme parity is most apparent in the NL Central, where the top four teams are virtually indistinguishable from one another:

NL Central Projections, 162 games
Team Proj W Proj L Division% WC% Playoff% WS%
Cubs 85 77 38.1% 14.8% 53.0% 3.2%
Brewers 82 80 21.6% 12.2% 33.8% 1.5%
Reds 82 80 22.0% 13.0% 35.0% 1.7%
Cardinals 81 81 17.8% 11.7% 29.5% 1.1%
Pirates 69 93 0.4% 0.4% 0.8% 0.0%
NL Central Projections, 60 games
Team Proj W Proj L Division% WC% Playoff% WS%
Cubs 32 28 31.4% 17.0% 48.4% 3.4%
Brewers 31 29 23.7% 15.8% 39.5% 2.4%
Reds 31 29 22.4% 15.5% 37.9% 2.1%
Cardinals 31 29 20.0% 14.7% 34.8% 1.8%
Pirates 26 34 2.5% 2.5% 5.2% 0.0%

There was already so little separating the middle three teams, and now the Cubs have nearly been absorbed into that group as well. Whoever wins this division is probably going to be a decent enough club, but they’re also going to inevitably be the beneficiaries of a season determined a lot by luck. And the Central isn’t the only division like that. Let’s check back in with the Nationals, Braves, and the rest of the NL East:

NL East Projections, 162 games
Team Proj W Proj L Division% WC% Playoff% WS%
Nationals 88 74 41.4% 25.3% 66.7% 5.0%
Braves 86 76 33.0% 25.2% 58.2% 4.0%
Mets 84 78 19.6% 23.0% 42.6% 2.3%
Phillies 79 83 6.0% 12.1% 18.1% 0.5%
Marlins 67 95 0.0% 0.3% 0.4% 0.0%
NL East Projections, 60 games
Team Proj W Proj L Division% WC% Playoff% WS%
Nationals 33 27 32.8% 20.5% 53.3% 4.8%
Braves 33 27 32.3% 20.5% 52.7% 4.8%
Mets 31 29 22.2% 18.5% 40.7% 2.9%
Phillies 30 30 11.4% 12.1% 23.6% 1.0%
Marlins 25 35 1.3% 1.9% 3.2% 0.0%

Out of every team in baseball, the Nationals are arguably the most-harmed by the shortening of the season. Their 13.4-point drop in playoff chances is second behind the Yankees for the biggest in the sport, with the Astros and Dodgers close behind, but unlike those other three teams, they aren’t able to escape with a still-comfortable lead over the rest of their division. Their once sizable advantage over Atlanta has essentially evaporated, despite the fact that the Braves’ chances at both the division and the Wild Card took a hit as well.

This is what happens when you try to predict what’s going to happen in a situation where every game will mean more, but their sum total will tell you less. Depending on what kind of fan you are or what team you cheer for, that could either terrify or thrill you. And while this might make you angsty at the idea of an “undeserving” team making the playoffs or even winning the World Series, it’s worth remembering that even full seasons don’t always do a great job of awarding the title to team we think is best. Just for this year, it’s probably for the best if we don’t worry much about who actually makes the playoffs. Let’s just hope we get a postseason at all.


Yeoman’s Work: Episode 3

I’m wading into the gaming and streaming space with Yeoman’s Work, a lo-fi, multimedia presentation that follows my pursuit of a championship in the baseball simulator, Diamond Mind Baseball, paired with single-camera footage from my baseball video archives. Below is Episode 3, which features my team’s sputtering bullpen situation, as well as video of prominent recent draftees and their undrafted peers who, by default, are now perched at the top of the 2023 class.

Both DMB’s gameplay and most of my video archive are very quiet, low-sensory experiences without music or crowd noise, and I think this will appeal to those of you who enjoy Baseball Sounds, as they are front and center in the footage. If this tone appeals to you, my “musical influences” in this department (i.e. the non-FanGraphs Twitch streams I watch on my own time) are Kenji Egashira’s and Luis Scott-Vargas’ live Magic: The Gathering content, Kate Stark’s PlayerUnknown’s Battlegrounds streams, and Kathleen De Vere’s pirate radio show, Brave New Faves. Read the rest of this entry »


Every Pitcher, Missing the Zone

Last week, I noticed something strange about Clayton Kershaw: he’d seemingly lost the will or ability to throw strikes in a 3-0 count. I did some middlingly fancy statistics, declared that a result like Kershaw’s was unlikely to happen by chance, and called it a day.

Unfortunately, I’d missed something subtle but important:

The Bonferroni correction is, in essence, a way to adjust confidence intervals to avoid taking too much signal from your data. Imagine, if you will, 10 gamblers each flipping 10 coins. One of them flips nine heads in his sample of 10. Amazing, right? There’s only a 1% chance of that happening!

Well, kind of. There were 10 of those gamblers, after all. The Bonferroni correction asks us to formulate a hypothesis beforehand, like “Gambler Number Nine is unusually likely to flip heads.” If we wanted to hypothesize that each gambler was likely to flip heads, that’s 10 hypotheses right there. Without getting too far into the realm of explaining statistical methods, suffice it to say that the Bonferroni correction requires more extreme values to reject the null hypothesis the more hypotheses you start with. In other words, the more things you observe, the weirder they need to be before they’re notable. Read the rest of this entry »


The Obscenely Late, Obscenely Early ZiPS Projected Standings

It seems like years ago at this point, but the last time we posted preliminary projections a month before the start of a baseball season, it went, well, you know, not great! Now comes our second attempt at preliminary standings projections, previewing what will likely be the oddest baseball season of our lives, at least until the robots take over and the league consists of 1200 Mike TroutBots.

The 60-game season is anything but familiar. MLB’s regional schedule has emerged victorious, with teams primarily playing their own divisions while also facing off against the corresponding geography-based division in the other league instead of their normal out-of-division games. Teams will play 10 games against each of their divisional rivals (40 total) and four games against each of the corresponding divisional teams (20 games total). The standings will work as they normally do, just with the odd twist of many of the teams that will compete in the Wild Card races not playing each other during the regular season. The designated hitter rule is universal for the rest of the 2020 season (and likely for the rest of baseball’s existence as a sport).

Not only will 60 games result in a more volatile season than 162 games would, there are factors that make it even more unpredictable than you’d expect. The injuries that every team suffers could really swing the numbers since the injuries themselves don’t “scale down” in a shorter season. Every injury that would normally place a player on the 60-day Injured List will essentially be a season-ending one, as will many less serious injuries, especially without the ability to play in rehab games in the minors. Read the rest of this entry »


OOTP Brewers: Odds and Ends

In the simulated reality of Out Of The Park Baseball, the season is chugging along normally. There’s no virus keeping stadium doors closed, no season schedule to work out. In fact, while in real life baseball is at a point of extreme uncertainty, the OOTP season is currently in a lull. It’s late June — too early for the All-Star Game or the trade deadline, too late for the new-car smell of April and May performances. In keeping with that between-events ambience, today I’m going to cover a few topics I find interesting but that aren’t of crucial, immediate import to the team.

Keston Hiura Signs

Well, I did say immediate import. The best thing that has happened to the Brewers so far this year is that we’re in first place in late June. Not far behind, however, is the extension Keston Hiura signed on Saturday after we decided to offer him a deal last week. OOTP contracts can look alien, because the game’s contract logic is governed by its own set of rules rather than the ones that major league teams adhere to, but this contract looks both like a real-world deal and an excellent one for the team:

Keston Hiura’s Contract Extension
Year Salary ($M) Team Option?
2021 2.2
2022 3.2
2023 4.2
2024 7.5
2025 8.5
2026 12.5 Yes
2027 12.5 Yes
Note: 2026 and 2027 team options each carry a $1.3 million buyout.

Read the rest of this entry »


The Universal Designated Hitter May Be Here to Stay

We’ll always have his epically improbable 2016 home run, but Bartolo Colon ain’t walking through that door. If the players union and the owners can agree to something along the lines of the latest volley of proposals without immolating themselves in fiery rhetoric — now that they’re at 100% pro rata, it shouldn’t be that difficult, yet here we are — then the days of pitchers hitting are likely at an end. Per the Milwaukee Journal-Sentinel’s Tom Haudricort, MLB’s most recent proposal includes a universal designated hitter not only for this year, but for 2021, and ESPN’s Jeff Passan and Jesse Rogers report the same is true for the union’s latest proposal. Beyond that, as Haudricourt notes, a universal DH is “almost certainly” going to be included in the Collective Bargaining Agreement that takes effect for the 2022 season. Not that hammering out that CBA will be a simple matter given the bad blood between the owners and the union, but it does appear that whenever they get around to playing again, the National League will finally join every other major circuit except Nippon Professional Baseball’s Central League in adopting the DH.

The DH has been around since 1973, though its roots go back to the late 19th century. As the role of the pitcher became more important, necessitating they concentrate on improving that aspect of their game, the feeling was that pitchers should be excused from their offensive duties. While movements to adopt a “tenth man” came and went from time to time prior to World War II, it took until the late 1960s, amid declining offenses, for the Triple-A International League and various other minor leagues to begin experimenting. The AL and NL could not agree on whether to adopt the DH; they voted separately, and you know the results. The original plan was that after three years, both leagues would either adopt or discard the rule, but the AL enjoyed the significant bumps in scoring and attendance in the wake of the rule’s adoption, and the two differing brands of baseball were maintained.

That was easy to do so long as there was no interleague play, but the World Series presented an awkward clash. From 1973-75, no DH was used, while from 1976-85, an “Even-Odd” scheme was used, with the DH in the even-numbered years, and since then, the “When in Rome” scheme has been used, with the DH present in AL parks but not NL ones. That scheme was extended to the regular season when interleague play began in 1997. Thus the two brands of baseball have generally coexisted in peace for nearly half a century, albeit not without endless debates contrasting the purity of the game with its need to adapt, as well as the occasional push within the game to move one way or the other. Because the position’s duties tend to be filled by higher-salaried veterans, the Players Association sought the universal DH in negotiations for the 2011 and ’16 CBAs. They didn’t get it either time, but now it’s a useful bargaining chip for the owners to throw into the pot, and notable that the players have maintained it in their counteroffers. Read the rest of this entry »


By the Numbers: Evaluating the 2020 Amateur Draft

With 2020’s amateur draft consisting of just five rounds, much of the strategy teams typically use related to shifting bonus pool money around was rendered moot. There were no high schoolers to woo with big bonuses after the 10th round, no saving money on a seventh rounder to sign a better first rounder. This served to decrease the incoming talent pool by quite a bit, with many good players going undrafted or unsigned, but it also makes an immediate analysis of the exercise a little bit easier.

With just 160 picks, we can evaluate a team’s decision to take a lesser player early in the draft in order to use the money saved on picks later and vice versa. With less scouting time and fewer looks, there might have been a bit more variation in terms of the quality of the players taken on draft day. Likewise, determining who might improve and surprise is trickier. As such, we shouldn’t consider this analysis ironclad. However, using Eric Longenhagen’s rankings and the selected players’ actual draft positions, we can compare how well each team did with their picks based on those rankings. To determine the value of each player and each pick, I’ll be using my draft pick valuation research from last year, which examined expected production from every draft slot. Read the rest of this entry »


An Insignificant Plate Appearance, August 11, 1994

The top of the seventh, and the Cardinals lead the Marlins7-6. Hard-earned, after getting out ahead early, 3-0, before ceding six runs, unable to muster a response; they were saving it all for the top of the sixth, when they got them all back — and another for insurance. Not enough insurance, though, not when you’re still trying to win — still, even though there is nothing tomorrow. Nothing the day after that, and nothing the day after that, either.

They’ve been holding up the signs: SAVE OUR SPORT. OWNER$ WIN, PLAYER$ WIN, FANS LOSE. The Cards send a pinch-hitter to the plate to lead it off: Gerald Young, in his 16th game with the big-league club. He is 29 years old. This will be the final game of his major league career.

***

Gerald Young — born in Honduras, raised in California — was signed by the Mets the same day as Doc Gooden. Gooden was the fifth pick overall in the 1982 draft; Young was drafted in the fifth round. Both were selected out of high school. Unlike Gooden, though, Young never ended up playing a single game for the Mets. His three-year career in their system was distinguished only by its anonymity. After the 1984 season, the Mets sent him and two Players to be Named Later to the Astros in exchange for Ray Knight, who had requested a trade.

In the Astros’ minor-league system, no longer a teenager, Young improved steadily. Every year, he advanced a level. His OPS climbed. He stole 54 bases in Double-A. His work in the outfield began to draw notice, too.

Young began the 1987 season in Tucson with the Triple-A Toros, the youngest player on the team’s roster, “scared and nervous” to make the jump to Triple-A. He quickly became the PCL’s stolen-base leader while hitting better than he ever had before. He thrived under the mentorship of Eric Bullock, then a veteran of the Houston farm, five years his senior. An “ooh-and-aah” player, the Arizona Daily Star called him: a thrill-seeker who loved the tension of the chase more than anything else, a dazzling young man with a bright smile and a twinkle in his eye. Read the rest of this entry »