2019 ZiPS Projections – Minnesota Twins

After having typically appeared in the hallowed pages of Baseball Think Factory, Dan Szymborski’s ZiPS projections have now been released at FanGraphs for more than half a decade. The exercise continues this offseason. Below are the projections for the Minnesota Twins.
Batters
In a league that is largely dominated by teams at the extremes of winning and rebuilding, the Minnesota Twins represent an increasingly rare breed: the excruciatingly, unbearably, average team. If you look at the lineup from top to bottom, there just aren’t any horrible weaknesses, with the bottom of the ZiPS ranks (Jorge Polanco, and the catching and first base timeshares) still living in the neighborhood of league-average; no scary negatives or zero-point-somethings lurk in there. But the highs aren’t really that high, either; Nelson Cruz tops the projections at 2.6 WAR, thanks to a .266/.348/.500 line. That’s the lowest top projected offensive WAR for any team that hopes to be a realistic contender in 2019.
This situation is not entirely the team’s fault, of course. ZiPS, like the Twins and most prospect-watchers, thought that Byron Buxton and Miguel Sano would, by this point, be players who formed the core of Minnesota’s lineup. There are a number of valid criticisms of how the Twins have managed Buxton and Sano, especially the former. Buxton’s inconsistent performance has been maddening, but so has the team’s tendency to go back-and-forth on whether he needed to be in the majors or the minors at any given time. His regular injuries add another frustrating complication. ZiPS has generally been optimistic about Buxton’s future, even when he’s struggled in the majors, but at this point, it’s only buying him as a league-average overall performer thanks to his excellent glove. It’s a good thing I don’t believe in curses; several years ago, I noted that ZiPS was rather cruel in assigning Carlos Gomez as Buxton’s top offensive comp, but it’s been more on-target than a computer can understand.
One of the problems with having a team full of average players is that it becomes damned hard to upgrade. There’s nowhere in the lineup where the Twins can be improved by any significant margin by adding a two-win player; really, even a three-win player would be an underwhelming addition at most positions. To upgrade the team’s offense, they need to add a legitimate star. And if that’s less likely to come by way of giant breakouts from Sano or Buxton than it once appeared, money becomes the best option in the short-term. After chasing Yu Darvish last year, I thought the Twins might sneakily be real players in the free agent market this offseason, but they really haven’t been. In a division with three rebuilding teams and a Cleveland squad whose plan in the outfield includes a heavy dose of Jordan Luplow, it feels like Minnesota should be more carpe diem and less dimitte diem.
Pitchers
The theme of being largely average continues with the pitching staff. Only Jose Berrios (at 14-10, 3.93, and 3.2 WAR) really pushes out of that middling range in the rotation. While his 2018 looked vaguely similar to his 2017, Berrios bumped up his strikes by a batter a game, and it still feels like that he has some ceiling left, even if ZiPS sees him continuing to pitch at about the same level. Berrios’s changeup has always looked nastier than it’s actually played on the field. I can’t speak for Twins fans, but to me, it’s looked like a pitch that should have struck out more than a mere 15 batters (against 11 home runs) in the right-hander’s brief career.
ZiPS remains unexcited about Blake Parker — one of the Twin’s “big” offseason moves — getting the highest-leverage innings, and instead sees Taylor Rogers or Trevor May (higher upside) as being better suited for the role. The projections are also bullish on Andrew Vasquez, a big lefty who serves up more sliders than White Castle and who rose from the Florida State League to the American League in ten weeks. But overall, the back of the bullpen looks shallower than other contenders’ and the highs are not quite as high. Of the teams that look to be around .500 or better, ZiPS projects Minnesota’s bullpen to be around the bottom, along with the Washington Nationals.
Bench and Prospects
Nick Gordon‘s offensive development has been a bit spotty, but ZiPS still sees him as a league-average regular in his prime, on the level of a slightly-better Polanco. That’s fine, but Royce Lewis’s projection is more exciting, with ZiPS seeing him peak as a 20-25 home run hitter, with projected lines in the .260/.330/.460 range, which will still work if he ends up playing center field rather than short in the majors. He even projects as useful if he were to play in the bigs this year, which is an impressive feat for a player with two months of Hi-A experience. As for Alex Kirilloff, while ZiPS doesn’t see him ever being a high-OBP player when his batting average inevitably comes down, his prime projections check in with just over a .280 batting average, with slugging percentages peeking just over the .500 mark.
One pedantic note for 2019: for the WAR graphic, I’m using FanGraphs’ depth chart playing time, not the playing time ZiPS spits out, so there will be occasional differences in WAR totals.
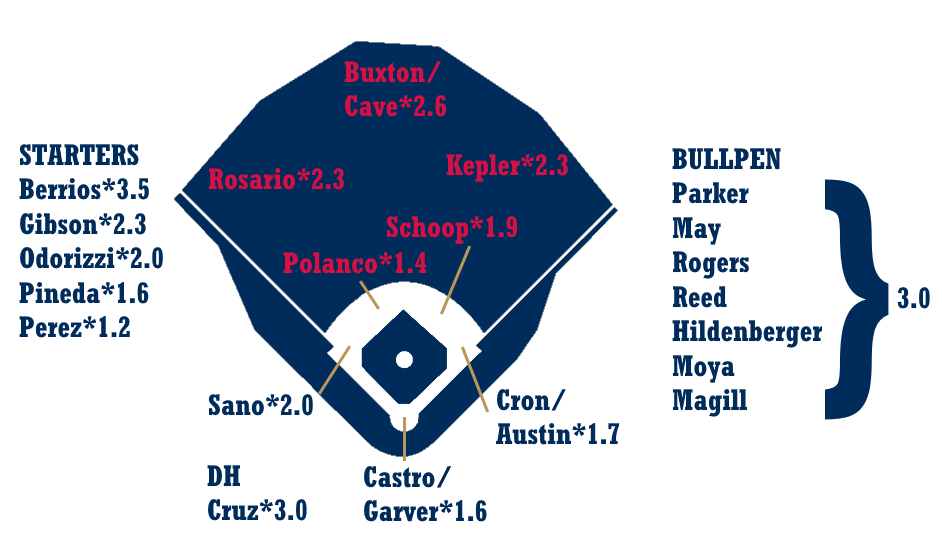
Ballpark graphic courtesy Eephus League. Depth charts constructed by way of those listed here at site.
| Player | B | Age | PO | G | AB | R | H | 2B | 3B | HR | RBI | BB | SO | SB | CS |
|---|---|---|---|---|---|---|---|---|---|---|---|---|---|---|---|
| Nelson Cruz | R | 38 | DH | 131 | 474 | 65 | 126 | 19 | 1 | 30 | 101 | 50 | 113 | 1 | 0 |
| Max Kepler | L | 26 | RF | 147 | 516 | 74 | 127 | 31 | 5 | 20 | 70 | 61 | 107 | 6 | 4 |
| Eddie Rosario | L | 27 | LF | 148 | 565 | 84 | 156 | 30 | 5 | 23 | 78 | 30 | 117 | 9 | 5 |
| Willians Astudillo | R | 27 | C | 102 | 364 | 40 | 102 | 18 | 1 | 15 | 49 | 9 | 18 | 4 | 4 |
| Jonathan Schoop | R | 27 | 2B | 150 | 561 | 74 | 146 | 31 | 1 | 25 | 90 | 26 | 140 | 1 | 1 |
| Byron Buxton | R | 25 | CF | 116 | 403 | 54 | 95 | 18 | 5 | 12 | 45 | 28 | 136 | 17 | 2 |
| Miguel Sano | R | 26 | 3B | 112 | 411 | 60 | 93 | 19 | 1 | 25 | 70 | 56 | 176 | 1 | 0 |
| C.J. Cron | R | 29 | 1B | 135 | 475 | 59 | 123 | 27 | 2 | 24 | 80 | 32 | 119 | 2 | 2 |
| Logan Forsythe | R | 32 | 2B | 121 | 401 | 51 | 98 | 20 | 1 | 8 | 39 | 51 | 102 | 4 | 2 |
| Jorge Polanco | B | 25 | SS | 118 | 456 | 54 | 120 | 23 | 5 | 10 | 61 | 35 | 89 | 10 | 6 |
| Nick Gordon | L | 23 | SS | 138 | 561 | 61 | 138 | 25 | 6 | 7 | 50 | 33 | 132 | 16 | 6 |
| Jake Cave | L | 26 | CF | 132 | 486 | 67 | 120 | 23 | 4 | 17 | 63 | 37 | 160 | 5 | 3 |
| Jason Castro | L | 32 | C | 89 | 280 | 32 | 58 | 14 | 1 | 7 | 28 | 35 | 99 | 0 | 0 |
| Logan Morrison | L | 31 | 1B | 113 | 374 | 50 | 87 | 17 | 1 | 20 | 59 | 47 | 98 | 3 | 1 |
| Taylor Motter | R | 29 | 3B | 110 | 384 | 47 | 88 | 21 | 1 | 13 | 48 | 36 | 90 | 13 | 6 |
| Luis Arraez | L | 22 | 2B | 119 | 455 | 49 | 122 | 19 | 4 | 4 | 37 | 27 | 60 | 3 | 4 |
| Joe Mauer | L | 36 | 1B | 121 | 459 | 56 | 124 | 25 | 2 | 6 | 47 | 52 | 85 | 1 | 1 |
| Tyler Austin | R | 27 | 1B | 109 | 385 | 51 | 89 | 21 | 2 | 21 | 64 | 35 | 144 | 3 | 2 |
| Mitch Garver | R | 28 | C | 106 | 356 | 43 | 83 | 21 | 2 | 8 | 46 | 37 | 99 | 1 | 1 |
| Lucas Duda | L | 33 | 1B | 103 | 338 | 40 | 76 | 18 | 0 | 18 | 57 | 39 | 115 | 1 | 0 |
| LaMonte Wade | L | 25 | LF | 113 | 424 | 54 | 104 | 14 | 3 | 9 | 41 | 51 | 86 | 8 | 3 |
| Royce Lewis | R | 20 | SS | 118 | 481 | 57 | 112 | 21 | 3 | 12 | 50 | 32 | 109 | 19 | 8 |
| Alex Kirilloff | L | 21 | RF | 128 | 511 | 62 | 138 | 30 | 3 | 17 | 68 | 27 | 110 | 3 | 3 |
| Ehire Adrianza | B | 29 | SS | 106 | 296 | 36 | 72 | 16 | 1 | 5 | 34 | 23 | 66 | 5 | 2 |
| Wynston Sawyer | R | 27 | C | 66 | 223 | 27 | 52 | 11 | 0 | 5 | 22 | 23 | 62 | 2 | 2 |
| Dean Anna | L | 32 | 2B | 115 | 412 | 49 | 100 | 16 | 2 | 2 | 31 | 41 | 65 | 5 | 5 |
| Ronald Torreyes | R | 26 | 2B | 91 | 273 | 28 | 72 | 13 | 2 | 1 | 21 | 12 | 36 | 1 | 1 |
| Zach Granite | L | 26 | CF | 105 | 391 | 45 | 97 | 13 | 3 | 3 | 28 | 29 | 56 | 18 | 8 |
| Brian Schales | R | 23 | 3B | 129 | 438 | 49 | 98 | 20 | 3 | 9 | 47 | 44 | 128 | 3 | 3 |
| Michael Reed | R | 26 | CF | 107 | 357 | 49 | 77 | 16 | 1 | 10 | 37 | 54 | 136 | 10 | 5 |
| Tomas Telis | B | 28 | C | 104 | 346 | 40 | 90 | 14 | 2 | 4 | 35 | 20 | 45 | 3 | 2 |
| Brian Navarreto | R | 24 | C | 98 | 348 | 30 | 72 | 15 | 0 | 4 | 25 | 12 | 76 | 0 | 1 |
| Jermaine Curtis | R | 31 | 3B | 67 | 223 | 27 | 49 | 9 | 0 | 3 | 18 | 27 | 54 | 3 | 1 |
| Jeremy Hazelbaker | L | 31 | CF | 102 | 296 | 36 | 61 | 13 | 3 | 10 | 35 | 28 | 117 | 10 | 2 |
| Jordan Gore | B | 24 | SS | 101 | 344 | 36 | 76 | 11 | 2 | 3 | 25 | 29 | 104 | 4 | 2 |
| Brent Rooker | R | 24 | 1B | 125 | 489 | 62 | 110 | 24 | 2 | 21 | 67 | 41 | 167 | 4 | 2 |
| Leonardo Reginatto | R | 29 | 3B | 93 | 329 | 31 | 76 | 13 | 1 | 3 | 26 | 18 | 76 | 4 | 4 |
| Luke Raley | L | 24 | 1B | 118 | 475 | 59 | 107 | 17 | 7 | 12 | 50 | 30 | 166 | 4 | 1 |
| Drew Maggi | R | 30 | 2B | 84 | 286 | 29 | 63 | 12 | 1 | 2 | 20 | 22 | 77 | 11 | 6 |
| Wilin Rosario | R | 30 | 1B | 114 | 419 | 50 | 104 | 22 | 1 | 16 | 63 | 23 | 104 | 5 | 3 |
| Andy Wilkins | L | 30 | 1B | 80 | 276 | 34 | 56 | 13 | 1 | 13 | 40 | 27 | 96 | 2 | 0 |
| Randy Cesar | R | 24 | 3B | 115 | 449 | 46 | 106 | 18 | 1 | 7 | 40 | 27 | 144 | 2 | 2 |
| Jordany Valdespin | L | 31 | 2B | 68 | 227 | 25 | 55 | 9 | 2 | 3 | 19 | 16 | 43 | 7 | 4 |
| Adam Rosales | R | 36 | 2B | 117 | 324 | 36 | 67 | 15 | 1 | 9 | 36 | 24 | 100 | 2 | 3 |
| Mike Olt | R | 30 | 3B | 84 | 290 | 33 | 56 | 12 | 0 | 10 | 31 | 32 | 117 | 0 | 0 |
| Jaylin Davis | R | 24 | RF | 118 | 445 | 47 | 93 | 18 | 2 | 12 | 45 | 30 | 169 | 6 | 3 |
| Zander Wiel | R | 26 | 1B | 122 | 469 | 52 | 103 | 22 | 3 | 12 | 51 | 38 | 134 | 5 | 2 |
| Edgar Corcino | B | 27 | RF | 105 | 394 | 41 | 94 | 17 | 3 | 7 | 37 | 26 | 94 | 3 | 2 |
| Jordan Pacheco | R | 33 | C | 58 | 147 | 12 | 29 | 6 | 0 | 1 | 9 | 10 | 33 | 0 | 0 |
| Player | PA | BA | OBP | SLG | OPS+ | ISO | BABIP | RC/27 | Def | WAR | No. 1 Comp |
|---|---|---|---|---|---|---|---|---|---|---|---|
| Nelson Cruz | 540 | .266 | .348 | .500 | 127 | .234 | .290 | 6.4 | 0 | 2.6 | Joe Adcock |
| Max Kepler | 586 | .246 | .328 | .442 | 107 | .196 | .275 | 5.2 | 6 | 2.2 | Robin Jennings |
| Eddie Rosario | 602 | .276 | .310 | .469 | 108 | .193 | .313 | 5.4 | 7 | 2.2 | Rondell White |
| Willians Astudillo | 385 | .280 | .307 | .459 | 104 | .179 | .263 | 5.2 | 3 | 2.0 | Bengie Molina |
| Jonathan Schoop | 601 | .260 | .300 | .453 | 101 | .193 | .306 | 4.9 | 0 | 2.0 | Kevin Kouzmanoff |
| Byron Buxton | 440 | .236 | .291 | .395 | 84 | .159 | .325 | 4.4 | 11 | 1.9 | Reggie Sanders |
| Miguel Sano | 471 | .226 | .321 | .460 | 109 | .234 | .324 | 5.2 | -3 | 1.7 | Mark Reynolds |
| C.J. Cron | 523 | .259 | .317 | .476 | 111 | .217 | .298 | 5.5 | 0 | 1.5 | Larry Sheets |
| Logan Forsythe | 461 | .244 | .336 | .359 | 90 | .115 | .309 | 4.3 | 1 | 1.2 | Dick Green |
| Jorge Polanco | 501 | .263 | .316 | .401 | 93 | .138 | .308 | 4.6 | -4 | 1.1 | Kurt Stillwell |
| Nick Gordon | 603 | .246 | .292 | .349 | 74 | .103 | .310 | 3.7 | 6 | 1.0 | Carlos Garcia |
| Jake Cave | 533 | .247 | .303 | .416 | 93 | .169 | .333 | 4.5 | -2 | 1.0 | LaVel Freeman |
| Jason Castro | 319 | .207 | .299 | .339 | 73 | .132 | .293 | 3.5 | 6 | 1.0 | Jerry Goff |
| Logan Morrison | 428 | .233 | .325 | .444 | 106 | .211 | .262 | 5.1 | -1 | 1.0 | Carmelo Martinez |
| Taylor Motter | 425 | .229 | .296 | .391 | 85 | .161 | .267 | 4.1 | 3 | 0.9 | Tom Brookens |
| Luis Arraez | 493 | .268 | .309 | .354 | 80 | .086 | .302 | 3.9 | 5 | 0.8 | Martin Prado |
| Joe Mauer | 517 | .270 | .345 | .373 | 96 | .102 | .321 | 4.7 | 3 | 0.8 | Mike Hargrove |
| Tyler Austin | 426 | .231 | .298 | .460 | 102 | .229 | .309 | 4.8 | 0 | 0.7 | Jason Dubois |
| Mitch Garver | 398 | .233 | .307 | .371 | 83 | .138 | .301 | 4.0 | -2 | 0.7 | Chad Moeller |
| Lucas Duda | 387 | .225 | .315 | .438 | 102 | .213 | .283 | 4.8 | 0 | 0.7 | Graham Koonce |
| LaMonte Wade | 486 | .245 | .330 | .356 | 87 | .111 | .289 | 4.3 | 2 | 0.5 | Trevor Penn |
| Royce Lewis | 522 | .233 | .286 | .364 | 75 | .131 | .278 | 3.7 | 0 | 0.5 | Asdrubal Cabrera |
| Alex Kirilloff | 545 | .270 | .306 | .440 | 100 | .170 | .315 | 4.9 | -5 | 0.4 | Jose Guillen |
| Ehire Adrianza | 328 | .243 | .299 | .355 | 77 | .111 | .298 | 3.8 | -1 | 0.3 | Doug Strange |
| Wynston Sawyer | 253 | .233 | .316 | .350 | 81 | .117 | .301 | 3.8 | -3 | 0.2 | Bob Henley |
| Dean Anna | 468 | .243 | .320 | .306 | 72 | .063 | .284 | 3.4 | 2 | 0.2 | Don Blasingame |
| Ronald Torreyes | 291 | .264 | .294 | .337 | 71 | .073 | .301 | 3.6 | 3 | 0.2 | Mario Diaz |
| Zach Granite | 428 | .248 | .302 | .320 | 70 | .072 | .283 | 3.5 | 3 | 0.1 | Leo Garcia |
| Brian Schales | 491 | .224 | .300 | .345 | 75 | .121 | .296 | 3.5 | 0 | 0.1 | Pedro Castellano |
| Michael Reed | 417 | .216 | .321 | .350 | 83 | .134 | .318 | 3.9 | -6 | 0.0 | Todd Self |
| Tomas Telis | 373 | .260 | .305 | .347 | 77 | .087 | .290 | 3.8 | -4 | 0.0 | Kirt Manwaring |
| Brian Navarreto | 368 | .207 | .243 | .284 | 43 | .078 | .254 | 2.3 | 11 | 0.0 | Alex Sutherland |
| Jermaine Curtis | 261 | .220 | .323 | .300 | 72 | .081 | .277 | 3.4 | -1 | -0.1 | Rico Rossy |
| Jeremy Hazelbaker | 328 | .206 | .278 | .372 | 75 | .166 | .302 | 3.7 | -2 | -0.1 | Dewayne Wise |
| Jordan Gore | 380 | .221 | .281 | .291 | 56 | .070 | .308 | 2.8 | 3 | -0.2 | Adam Haley |
| Brent Rooker | 537 | .225 | .291 | .411 | 88 | .186 | .296 | 4.2 | -4 | -0.4 | Kevin Eberwein |
| Leonardo Reginatto | 356 | .231 | .275 | .304 | 58 | .073 | .292 | 2.8 | 4 | -0.4 | Steve Sisco |
| Luke Raley | 525 | .225 | .291 | .366 | 77 | .141 | .320 | 3.8 | 1 | -0.4 | Otis Green |
| Drew Maggi | 316 | .220 | .284 | .290 | 57 | .070 | .295 | 2.8 | 1 | -0.5 | Ray Holbert |
| Wilin Rosario | 451 | .248 | .295 | .420 | 91 | .172 | .294 | 4.4 | -6 | -0.5 | Tom Nevers |
| Andy Wilkins | 308 | .203 | .276 | .399 | 80 | .196 | .257 | 3.8 | -2 | -0.5 | Jay Gainer |
| Randy Cesar | 480 | .236 | .279 | .327 | 64 | .091 | .332 | 3.2 | 1 | -0.5 | Jack Hannahan |
| Jordany Valdespin | 249 | .242 | .300 | .339 | 74 | .097 | .287 | 3.6 | -7 | -0.6 | Luis Maza |
| Adam Rosales | 357 | .207 | .265 | .343 | 64 | .136 | .270 | 3.0 | -1 | -0.7 | Shane Halter |
| Mike Olt | 327 | .193 | .276 | .338 | 66 | .145 | .282 | 3.1 | -4 | -0.7 | Jose Santos |
| Jaylin Davis | 483 | .209 | .266 | .339 | 63 | .130 | .307 | 3.1 | 4 | -0.9 | Daniel Carte |
| Zander Wiel | 516 | .220 | .283 | .356 | 72 | .136 | .282 | 3.5 | 0 | -1.0 | Brian Turner |
| Edgar Corcino | 426 | .239 | .287 | .350 | 72 | .112 | .297 | 3.5 | -3 | -1.0 | Ed Yacopino |
| Jordan Pacheco | 161 | .197 | .255 | .259 | 41 | .061 | .248 | 2.2 | -6 | -1.0 | Chad Moeller |
| Player | T | Age | W | L | ERA | G | GS | IP | H | ER | HR | BB | SO |
|---|---|---|---|---|---|---|---|---|---|---|---|---|---|
| Jose Berrios | R | 25 | 14 | 10 | 3.93 | 32 | 32 | 183.3 | 169 | 80 | 22 | 59 | 181 |
| Kyle Gibson | R | 31 | 11 | 10 | 4.48 | 29 | 29 | 170.7 | 178 | 85 | 22 | 65 | 135 |
| Jake Odorizzi | R | 29 | 9 | 8 | 4.45 | 30 | 30 | 153.7 | 148 | 76 | 22 | 59 | 136 |
| Zack Littell | R | 23 | 9 | 8 | 4.57 | 30 | 22 | 141.7 | 152 | 72 | 17 | 53 | 109 |
| Martin Perez | L | 28 | 8 | 7 | 4.58 | 26 | 22 | 129.7 | 144 | 66 | 13 | 45 | 79 |
| Fernando Romero | R | 24 | 8 | 7 | 4.64 | 25 | 22 | 132.0 | 143 | 68 | 16 | 47 | 91 |
| Ervin Santana | R | 36 | 7 | 7 | 4.61 | 21 | 21 | 121.0 | 124 | 62 | 19 | 36 | 90 |
| Lewis Thorpe | L | 23 | 7 | 7 | 4.67 | 24 | 23 | 113.7 | 119 | 59 | 17 | 42 | 102 |
| Taylor Rogers | L | 28 | 3 | 2 | 3.22 | 70 | 0 | 67.0 | 61 | 24 | 5 | 19 | 63 |
| Kohl Stewart | R | 24 | 6 | 6 | 4.80 | 27 | 22 | 131.3 | 142 | 70 | 14 | 58 | 86 |
| Adalberto Mejia | L | 26 | 6 | 6 | 4.41 | 22 | 20 | 100.0 | 106 | 49 | 12 | 35 | 77 |
| Stephen Gonsalves | L | 24 | 9 | 9 | 4.84 | 28 | 24 | 124.7 | 126 | 67 | 13 | 72 | 104 |
| Michael Pineda | R | 30 | 5 | 4 | 4.50 | 15 | 15 | 80.0 | 88 | 40 | 12 | 21 | 72 |
| Devin Smeltzer | L | 23 | 6 | 6 | 4.78 | 31 | 17 | 107.3 | 124 | 57 | 17 | 28 | 79 |
| Andrew Vasquez | L | 25 | 3 | 2 | 3.68 | 46 | 1 | 66.0 | 57 | 27 | 6 | 31 | 76 |
| D.J. Baxendale | R | 28 | 3 | 3 | 4.63 | 32 | 11 | 79.7 | 89 | 41 | 10 | 24 | 52 |
| Gabriel Moya | L | 24 | 3 | 3 | 4.23 | 64 | 8 | 76.7 | 74 | 36 | 10 | 27 | 71 |
| Sean Poppen | R | 25 | 7 | 7 | 4.95 | 25 | 21 | 116.3 | 130 | 64 | 16 | 42 | 80 |
| Trevor Hildenberger | R | 28 | 5 | 4 | 4.00 | 65 | 0 | 69.7 | 69 | 31 | 9 | 19 | 64 |
| Cody Stashak | R | 25 | 3 | 3 | 4.76 | 30 | 9 | 73.7 | 78 | 39 | 11 | 25 | 60 |
| Blake Parker | R | 34 | 2 | 1 | 3.88 | 61 | 0 | 58.0 | 53 | 25 | 8 | 20 | 62 |
| Addison Reed | R | 30 | 4 | 3 | 3.94 | 63 | 0 | 61.7 | 64 | 27 | 7 | 16 | 50 |
| Trevor May | R | 29 | 3 | 2 | 3.86 | 49 | 0 | 44.3 | 41 | 19 | 5 | 19 | 48 |
| Tyler Duffey | R | 28 | 5 | 5 | 4.31 | 57 | 1 | 79.3 | 82 | 38 | 10 | 23 | 68 |
| Ryne Harper | R | 30 | 3 | 3 | 3.95 | 37 | 0 | 57.0 | 56 | 25 | 7 | 17 | 55 |
| Randy LeBlanc | R | 27 | 6 | 6 | 5.18 | 19 | 14 | 83.3 | 95 | 48 | 10 | 31 | 47 |
| Tyler Wells | R | 24 | 7 | 8 | 5.29 | 22 | 21 | 102.0 | 110 | 60 | 18 | 39 | 83 |
| Mike Morin | R | 28 | 3 | 3 | 4.37 | 48 | 2 | 57.7 | 62 | 28 | 7 | 15 | 45 |
| Justin Nicolino | L | 27 | 6 | 8 | 5.26 | 27 | 24 | 131.7 | 164 | 77 | 22 | 39 | 71 |
| Adam Bray | R | 26 | 3 | 3 | 5.03 | 24 | 9 | 77.0 | 93 | 43 | 15 | 18 | 55 |
| Kevin Comer | R | 26 | 3 | 3 | 4.58 | 47 | 1 | 57.0 | 59 | 29 | 7 | 27 | 50 |
| Matt Belisle | R | 39 | 1 | 1 | 4.40 | 43 | 0 | 45.0 | 47 | 22 | 6 | 12 | 34 |
| Alan Busenitz | R | 28 | 4 | 4 | 4.79 | 49 | 2 | 67.7 | 73 | 36 | 10 | 24 | 56 |
| Jake Reed | R | 26 | 2 | 2 | 4.74 | 36 | 1 | 49.3 | 49 | 26 | 6 | 24 | 41 |
| Preston Guilmet | R | 31 | 1 | 1 | 4.66 | 36 | 1 | 46.3 | 48 | 24 | 8 | 13 | 43 |
| Ryan Eades | R | 27 | 4 | 4 | 5.38 | 31 | 10 | 80.3 | 88 | 48 | 12 | 34 | 59 |
| Dario Alvarez | L | 30 | 2 | 2 | 4.58 | 38 | 0 | 37.3 | 36 | 19 | 5 | 21 | 39 |
| Austin D. Adams | R | 32 | 2 | 2 | 4.91 | 30 | 1 | 33.0 | 35 | 18 | 4 | 17 | 27 |
| Dan Camarena | L | 26 | 6 | 8 | 5.62 | 24 | 23 | 117.0 | 140 | 73 | 20 | 46 | 74 |
| Luke Bard | R | 28 | 3 | 3 | 4.73 | 40 | 0 | 59.0 | 60 | 31 | 8 | 27 | 54 |
| Jorge Alcala | R | 23 | 6 | 8 | 5.62 | 24 | 17 | 91.3 | 99 | 57 | 14 | 59 | 71 |
| Chris Gimenez | R | 36 | 0 | 0 | 9.00 | 4 | 0 | 4.0 | 6 | 4 | 2 | 0 | 1 |
| Pat Dean | L | 30 | 5 | 7 | 5.76 | 18 | 15 | 89.0 | 115 | 57 | 15 | 25 | 41 |
| Dusten Knight | R | 28 | 3 | 3 | 5.02 | 35 | 1 | 57.3 | 62 | 32 | 10 | 24 | 49 |
| Matt Magill | R | 29 | 3 | 3 | 4.94 | 45 | 0 | 58.3 | 59 | 32 | 10 | 28 | 56 |
| Tim Collins | L | 29 | 3 | 3 | 5.24 | 59 | 0 | 44.7 | 45 | 26 | 6 | 29 | 42 |
| Chase De Jong | R | 25 | 7 | 9 | 5.76 | 29 | 27 | 148.3 | 178 | 95 | 29 | 53 | 89 |
| Tyler Jay | L | 25 | 5 | 6 | 5.66 | 34 | 8 | 76.3 | 90 | 48 | 13 | 31 | 46 |
| Zack Weiss | R | 27 | 3 | 4 | 5.54 | 33 | 1 | 37.3 | 39 | 23 | 7 | 22 | 35 |
| Jeff Ames | R | 28 | 2 | 3 | 6.17 | 38 | 1 | 46.7 | 48 | 32 | 9 | 36 | 47 |
| Player | TBF | K/9 | BB/9 | HR/9 | BABIP | ERA+ | ERA- | FIP | WAR | No. 1 Comp |
|---|---|---|---|---|---|---|---|---|---|---|
| Jose Berrios | 778 | 8.89 | 2.90 | 1.08 | .292 | 111 | 90 | 3.91 | 3.2 | Jack Morris |
| Kyle Gibson | 747 | 7.12 | 3.43 | 1.16 | .300 | 98 | 103 | 4.47 | 2.0 | Omar Olivares |
| Jake Odorizzi | 661 | 7.97 | 3.46 | 1.29 | .286 | 98 | 102 | 4.47 | 1.9 | Roger Bailey |
| Zack Littell | 628 | 6.92 | 3.37 | 1.08 | .307 | 96 | 105 | 4.48 | 1.5 | Aaron Cook |
| Martin Perez | 570 | 5.48 | 3.12 | 0.90 | .305 | 95 | 105 | 4.35 | 1.4 | Jim O’Toole |
| Fernando Romero | 586 | 6.20 | 3.20 | 1.09 | .301 | 94 | 106 | 4.64 | 1.3 | Cha-Seung Baek |
| Ervin Santana | 519 | 6.69 | 2.68 | 1.41 | .285 | 95 | 105 | 4.72 | 1.3 | Bob Forsch |
| Lewis Thorpe | 500 | 8.08 | 3.33 | 1.35 | .306 | 94 | 107 | 4.57 | 1.1 | Danny Borrell |
| Taylor Rogers | 279 | 8.46 | 2.55 | 0.67 | .296 | 136 | 74 | 3.22 | 1.1 | Sparky Lyle |
| Kohl Stewart | 592 | 5.89 | 3.97 | 0.96 | .300 | 91 | 110 | 4.73 | 1.1 | Rick Berg |
| Adalberto Mejia | 438 | 6.93 | 3.15 | 1.08 | .304 | 96 | 104 | 4.37 | 1.1 | Scott Sauerbeck |
| Stephen Gonsalves | 569 | 7.51 | 5.20 | 0.94 | .302 | 90 | 111 | 4.71 | 1.0 | Jimmy Anderson |
| Michael Pineda | 345 | 8.10 | 2.36 | 1.35 | .319 | 97 | 103 | 4.16 | 1.0 | Brian Tollberg |
| Devin Smeltzer | 472 | 6.62 | 2.35 | 1.43 | .313 | 91 | 109 | 4.69 | 0.8 | Kevin Pickford |
| Andrew Vasquez | 287 | 10.36 | 4.23 | 0.82 | .302 | 119 | 84 | 3.67 | 0.8 | Buzz Oliver |
| D.J. Baxendale | 350 | 5.87 | 2.71 | 1.13 | .304 | 94 | 106 | 4.53 | 0.6 | Bill Fischer |
| Gabriel Moya | 329 | 8.33 | 3.17 | 1.17 | .294 | 100 | 100 | 4.17 | 0.6 | Pat Clements |
| Sean Poppen | 519 | 6.19 | 3.25 | 1.24 | .305 | 86 | 117 | 4.83 | 0.6 | Michael Macdonald |
| Trevor Hildenberger | 296 | 8.27 | 2.45 | 1.16 | .300 | 109 | 92 | 3.98 | 0.5 | Jeff Tam |
| Cody Stashak | 323 | 7.33 | 3.05 | 1.34 | .300 | 92 | 109 | 4.64 | 0.5 | Steve Parris |
| Blake Parker | 246 | 9.62 | 3.10 | 1.24 | .294 | 109 | 92 | 3.99 | 0.4 | Steve Reed |
| Addison Reed | 261 | 7.30 | 2.34 | 1.02 | .305 | 107 | 93 | 3.83 | 0.4 | Kent Tekulve |
| Trevor May | 192 | 9.74 | 3.86 | 1.02 | .305 | 113 | 88 | 3.87 | 0.4 | Jason Bulger |
| Tyler Duffey | 340 | 7.71 | 2.61 | 1.13 | .305 | 101 | 99 | 4.06 | 0.4 | Jose Santiago |
| Ryne Harper | 243 | 8.68 | 2.68 | 1.11 | .304 | 107 | 93 | 3.87 | 0.3 | Terry Leach |
| Randy LeBlanc | 374 | 5.08 | 3.35 | 1.08 | .302 | 84 | 119 | 4.88 | 0.3 | Brian Allard |
| Tyler Wells | 453 | 7.32 | 3.44 | 1.59 | .300 | 83 | 121 | 5.14 | 0.3 | Carlos Crawford |
| Mike Morin | 249 | 7.02 | 2.34 | 1.09 | .307 | 100 | 100 | 4.10 | 0.3 | Bill Fischer |
| Justin Nicolino | 593 | 4.85 | 2.67 | 1.50 | .312 | 80 | 124 | 5.27 | 0.2 | Wade Blasingame |
| Adam Bray | 341 | 6.43 | 2.10 | 1.75 | .315 | 84 | 119 | 5.15 | 0.2 | Dick Marlowe |
| Kevin Comer | 256 | 7.89 | 4.26 | 1.11 | .308 | 95 | 105 | 4.57 | 0.1 | Mike Gardner |
| Matt Belisle | 193 | 6.80 | 2.40 | 1.20 | .295 | 96 | 104 | 4.31 | 0.0 | Boom-Boom Beck |
| Alan Busenitz | 298 | 7.45 | 3.19 | 1.33 | .307 | 91 | 110 | 4.61 | 0.0 | Rob Marquez |
| Jake Reed | 219 | 7.48 | 4.38 | 1.09 | .295 | 92 | 108 | 4.65 | 0.0 | Ken Wright |
| Preston Guilmet | 199 | 8.35 | 2.53 | 1.55 | .301 | 91 | 110 | 4.51 | 0.0 | Dan Giese |
| Ryan Eades | 362 | 6.61 | 3.81 | 1.34 | .302 | 81 | 123 | 5.08 | 0.0 | Preston Larrison |
| Dario Alvarez | 169 | 9.40 | 5.06 | 1.21 | .304 | 92 | 108 | 4.65 | 0.0 | Arnold Earley |
| Austin D. Adams | 150 | 7.36 | 4.64 | 1.09 | .307 | 89 | 112 | 4.73 | 0.0 | Jerry Johnson |
| Dan Camarena | 534 | 5.69 | 3.54 | 1.54 | .309 | 78 | 128 | 5.44 | 0.0 | Rich Rundles |
| Luke Bard | 264 | 8.24 | 4.12 | 1.22 | .304 | 92 | 108 | 4.66 | -0.1 | Sean Green |
| Jorge Alcala | 430 | 7.00 | 5.81 | 1.38 | .302 | 78 | 128 | 5.69 | -0.1 | Edwin Morel |
| Chris Gimenez | 18 | 2.25 | 0.00 | 4.50 | .267 | 49 | 206 | 9.15 | -0.2 | John Gardner |
| Pat Dean | 402 | 4.15 | 2.53 | 1.52 | .314 | 76 | 132 | 5.36 | -0.2 | Dave Gassner |
| Dusten Knight | 257 | 7.69 | 3.77 | 1.57 | .304 | 84 | 119 | 5.12 | -0.2 | John Koronka |
| Matt Magill | 261 | 8.64 | 4.32 | 1.54 | .299 | 86 | 117 | 5.05 | -0.3 | Kevin Gryboski |
| Tim Collins | 207 | 8.46 | 5.84 | 1.21 | .305 | 83 | 120 | 5.10 | -0.3 | Arnold Earley |
| Chase De Jong | 671 | 5.40 | 3.22 | 1.76 | .302 | 76 | 132 | 5.71 | -0.3 | Mark Ratekin |
| Tyler Jay | 350 | 5.42 | 3.66 | 1.53 | .303 | 77 | 129 | 5.61 | -0.3 | Wade Blasingame |
| Zack Weiss | 172 | 8.44 | 5.30 | 1.69 | .302 | 76 | 131 | 5.64 | -0.4 | Ryan Baker |
| Jeff Ames | 224 | 9.06 | 6.94 | 1.74 | .302 | 71 | 141 | 6.15 | -0.7 | Bart Evans |
Disclaimer: ZiPS projections are computer-based projections of performance. Performances have not been allocated to predicted playing time in the majors — many of the players listed above are unlikely to play in the majors at all in 2019. ZiPS is projecting equivalent production — a .240 ZiPS projection may end up being .280 in AAA or .300 in AA, for example. Whether or not a player will play is one of many non-statistical factors one has to take into account when predicting the future.
Players are listed with their most recent teams, unless I have made a mistake. This is very possible, as a lot of minor-league signings go generally unreported in the offseason.
ZiPS’ projections are based on the American League having a 4.29 ERA and the National League having a 4.15 ERA.
Players who are expected to be out due to injury are still projected. More information is always better than less information, and a computer isn’t the tool that should project the injury status of, for example, a pitcher who has had Tommy John surgery.
Both hitters and pitchers are ranked by projected zWAR — which is to say, WAR values as calculated by me, Dan Szymborski, whose surname is spelled with a z. WAR values might differ slightly from those which appear in full release of ZiPS. Finally, I will advise anyone against — and might karate chop anyone guilty of — merely adding up WAR totals on a depth chart to produce projected team WAR.