Below is an analysis of the prospects in the farm system of the Pittsburgh Pirates. Scouting reports were compiled with information provided by industry sources as well as my own observations. This is the second year we’re delineating between two anticipated relief roles, the abbreviations for which you’ll see in the “position” column below: MIRP for multi-inning relief pitchers, and SIRP for single-inning relief pitchers.
A quick overview of what FV (Future Value) means can be found here. A much deeper overview can be found here.
All of the numbered prospects below also appear on The Board, a resource the site offers featuring sortable scouting information for every organization. It has more details than this article and integrates every team’s list so readers can compare prospects across farm systems. It can be found here. Read the rest of this entry »
One major point of contention in this offseason’s collective bargaining impasse is compensation for young players. In the two sides’ competing proposals, the existing Super Two system, which each year awards an additional year of arbitration to some pre-arb players with two-plus years of service time, has come up repeatedly. Whether it’s being replaced with an algorithmic solution, increased pay for some players based on performance, or an expansion of arbitration within the two-plus group, compensating these pre-arb but multi-year players is a key point of debate as the lockout wears on.
If we want to understand this debate, we need to understand how Super Two players have been compensated in the existing system. Without that context, the dispute can feel more theoretical than consequential, and it is obviously very consequential to the players involved. To that end, I decided to look at the last eight years of Super Two awards and come up with a rough heuristic for how their compensation relates to their production in those years. From there, I’ve created some rules of thumb, which I’ll share with you here before we get into the nitty-gritty details of how I did the calculations. Here it is, separated out by player type:
Super-Two Salary Awards, $/WAR (millions)
Player Type
$/WAR Arb1
$/WAR Arb2
$/WAR Arb3
$/WAR Arb4
Batter
$1.08
$1.86
$2.66
$4.19
Starter
$1.11
$1.97
$2.97
$3.88
Reliever
$1.57
$3.11
$3.98
$7.60
$/WAR (mm) over minimum salary, 2013-2021. See below for methodology.
This table displays the amount of money a given player should make above the major league minimum based on how many times they’ve been through the arbitration process, their position, and their previous year’s production. Broadly speaking, the numbers make sense — players receive less per unit of production than they would in free agency, but their compensation gets closer and closer to free agency levels (roughly $6.5 million above minimum salary per WAR) as they go further into arbitration. Now let’s talk about how I got to these numbers, and the merits (and limits) of using this style of calculation to model arbitration awards. Read the rest of this entry »
As you might have noticed if you were surfing FanGraphs while relaxing over the weekend — or recovering from shoveling snow in the Northeast — the ZiPS projections have now been populated in the projections section of the site.
There will be multiple updates to those projections this spring because, well, a whole bunch of the offseason remains, far more than is typical when ZiPS makes its appearance in the database. While I’m more cautiously optimistic than most of my colleagues are about the future of the 2022 season, in the present, baseball’s landscape is less about fans huddled around an abstract hot stove and more about the heat death of the universe. With no MLBPA members being signed, traded, or even acknowledged on official MLB channels, baseball has nearly entered a state of thermodynamic equilibrium.
While this is bad for the game and anyone who likes it, it at least makes depth charts less volatile and provides a good opportunity to run some mid-lockout standings. These are quite obviously nowhere near the final preseason projections, but they’re a snapshot of where baseball stands right now. Which teams are in good shape, and which ones still have work to do? Let’s forget about the eternal void that beckons and get to some projections! Read the rest of this entry »
As one of the few remaining free-agent pitchers, there will be a time (hopefully) soon enough when Carlos Rodón is a hot commodity. A pitcher coming off a 4.9 WAR season usually doesn’t have serious contract questions attached to them, but that’s the case for Rodón, who amassed that WAR total in only 132.2 innings and was given significant rest between starts, as his velocity dipped significantly over the course of the year. The end result is that he didn’t receive a qualifying offer from the White Sox and remained unsigned as the lockout began.
Rodón’s injury history combined with the in-season fatigue is alarming on its own, but a pitcher who can put together a 5-win season in under 200 innings deserves a fair assessment. How likely is it that those fatigue issues occur again, and if they do, what team is best suited to handle a mixed starter/reliever workload?
We’ll start with assessing the fatigue issues. As noted, Rodón threw 132.2 innings in 2021 — rather remarkable, considering he had only thrown 42.1 innings in ’19 and ’20 combined. Innings jumps that large are understandably scary, but every pitcher experienced that after the 2020 season; Rodon’s was the 24th largest year-to-year increase from that season to last year. That is something, but there was a significant lack of workload for Rodón in 2019 as well. Where does he rank in terms of innings jumps from 2019 and ’20 combined to 2021?
Many of the pitchers here have suffered significant injuries before and once again ran into injury troubles this past season. Regardless, the jump for Rodón was not unprecedented; what’s maybe more concerning is the velocity drop in-season.
Rodón’s velo saw a more characteristic switch after his last start of seven-plus innings on July 18. Before then, there was a clearer build-up from innings 1–3 to innings 4–6; after, the relationship breaks. That start on the 18th was seemingly max effort the whole time, with the highest early-inning velocity he’d shown all year. There’s nothing that we can reasonably assume about the nature of his shoulder fatigue, whether it’s this one start that caused trouble or having hit a wall in general, but his season decline began there. He had built up to 89.2 innings before that July 18 start; everything after has the caveat of him either throwing through noticeable injury, receiving extended periods of rest, or spending time on the IL.
If we take those 89.2 innings as a benchmark of the healthy Rodón, we can look at other year-to-year workload increases to get a sense of what may be reasonable.
For those that do throw somewhere in the range of 90 innings, jumps in the range of 30–40 innings are within reason, although many of those who fall into that 80–90 range are midseason call-ups. In the 130-inning range, best-case jumps top out at 20 or so innings. Barring injury and without much else information to bake in, we would expect Rodón in 2022 to fall somewhere between 110 and 150 innings. Read the rest of this entry »
Below is an analysis of the prospects in the farm system of the San Francisco Giants. Scouting reports were compiled with information provided by industry sources as well as our own observations. This is the second year we’re delineating between two anticipated relief roles, the abbreviations for which you’ll see in the “position” column below: MIRP for multi-inning relief pitchers, and SIRP for single-inning relief pitchers.
A quick overview of what FV (Future Value) means can be found here. A much deeper overview can be found here.
All of the numbered prospects below also appear on The Board, a resource the site offers featuring sortable scouting information for every organization. It has more details than this article and integrates every team’s list so readers can compare prospects across farm systems. It can be found here. Read the rest of this entry »
The following article is part of Jay Jaffe’s ongoing look at the candidates on the BBWAA 2022 Hall of Fame ballot. For a detailed introduction to this year’s ballot, and other candidates in the series, use the tool above; an introduction to JAWS can be found here. All WAR figures refer to the Baseball-Reference version unless otherwise indicated.
After last year’s shutout ended a remarkable run of 22 candidates elected over a seven-year span, this year the BBWAA got back to the business of electing players — or player, singular, given that David Ortiz was the 2022 cycle’s sole honoree. Even with Ortiz’s election, it seems clear that the upcoming years for the writers’ ballot will produce far fewer honorees than this recent stretch, which set all kinds of records even without Barry Bonds, Roger Clemens, Curt Schilling, and Sammy Sosa gaining entry due to the controversies attached to their respective candidacies.
Even setting the issue of performance-enhancing drugs aside for the moment, the past decade has amply illustrated that the dynamics of a Hall of Fame candidacy have changed. As I noted last year, from 1966 to 2005, only three candidates recovered from debuts below 25% and eventually reached 75%, even with 15 years of eligibility: Duke Snider (17.0% in 1970, elected in 1981), Don Drysdale (21.0% in 1975, elected in ’84) and Billy Williams (23.4% in 1982, elected in ’87). Since then, we’ve seen five players elected despite such slow starts, including three from 2017-20. From the 15-year eligibility period came Bruce Sutter (23.9% in 1994, elected in 2006) and Bert Blyleven (17.5% in ’98, elected in 2011), and then once the Hall unilaterally cut eligibility to 10 years — less to clean up the ballots than to move the intractable debate over PED-related candidates out of the spotlight, and give voters less time to soften their attitudes — Tim Raines (24.3% in 2008, elected in ’17), Mike Mussina (20.3% in 2014, elected in ’19), and Larry Walker (20.3% in 2011, elected in ’20). Read the rest of this entry »
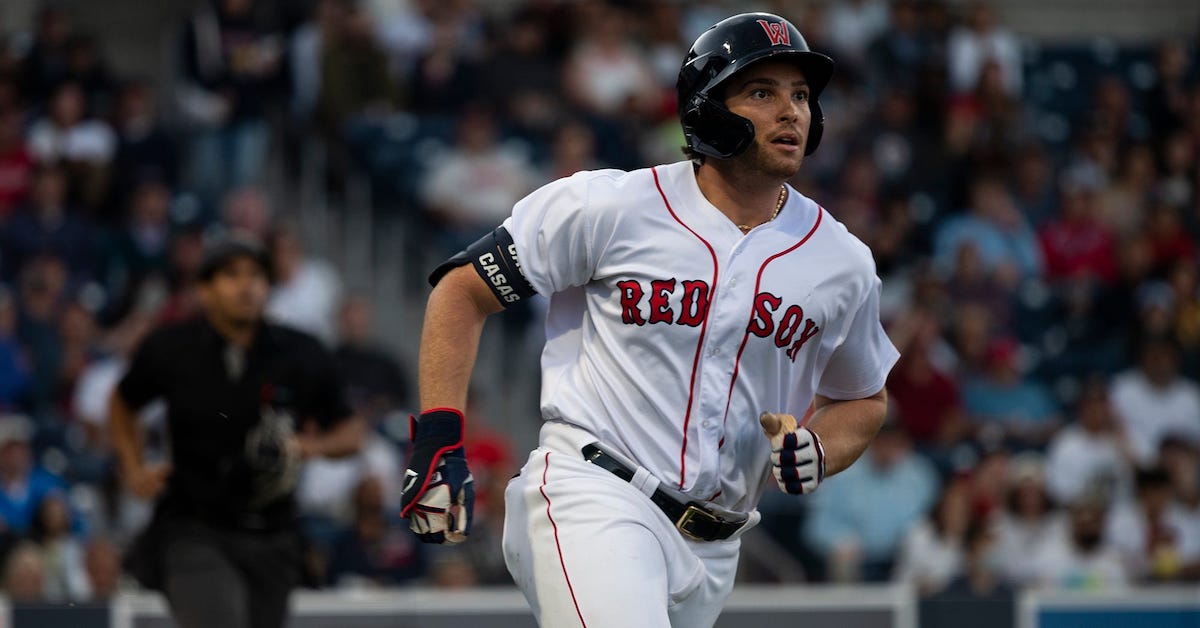
Austin Wells is well-regarded, albeit with a lot to prove on the defensive side of the ball. There’s little doubt that he can mash. No. 15 on our recently-released New York Yankees Top Prospects list, Wells went deep 16 times in 469 plate appearances last year between Low-A Tampa and High-A Hudson Valley. His left-handed stroke produced a solid .264/.390/.476 slash line, while his wRC+ was an every-bit-as-sturdy 135.
Wells is built to bash — he packs 220 pounds on a 6-foot-2 frame — and his size is also befits a backstop. That’s what he wants to be. Asked about his positional future during his stint in the Arizona Fall League, Wells shared that he’s caught since he was six years old, and plans to continue doing so. Since being drafted 28th-overall in 2020 out of the University of Arizona, all 70 of his defensive games have been spent behind behind the dish. Moreover, “there haven’t been any conversations about playing anywhere else.”
Wells was preparing to play in the Fall Stars Game when I caught up to him, and the first thing I wanted to address were the nuances of his craft. I began by asking what role analytics play for a young, minor-league catcher. Read the rest of this entry »
If you wanted to design a puzzle to attract my interest, you couldn’t do much better than pitchers who throw both sinkers and four-seamers. I love thinking about pitching. I love thinking about fastball spin, and I’ve been having a blast looking at approach angle recently. Want to kick it into overdrive, though? Add in platoon splits, and we’re really cooking with gas.
One of those weird, of-course-this-exists-but-we-don’t-talk-about-it splits is groundball pitchers against flyball hitters and vice versa. I first learned about this split in The Book, and while it’s always made sense, Alex Chamberlain put it into a pretty picture recently that brought it back to mind for me:
fly ball hitters perform better against ground ball pitchers, and ground ball hitters perform better against fly ball pitchers
There are some terms you might not know on there, like pitcher influence on launch angle. For that, you should read Alex’s work on launch angle here. Honestly, you should probably just read all of Alex’s stuff anyway – but particularly for this, his work is invaluable.
The key takeaway here? Against groundball hitters, sinkers are an excellent choice of pitch. The hitter tends to hit the ball into the ground and sinkers generally influence launch angles downward. The result is frequently a grounder, which is great for the defense. Similarly, if you’re facing a fly ball hitter, you want them to hit it even higher into the air, which means a four-seamer with solid rise is the ticket. Read the rest of this entry »
You might have noticed that we updated the main home page to reflect some of the changes we recently made on the RotoGraphs landing page and the new blog roll.
We cleaned up the design, added more photos, and reorganized our content. The left column will primarily contain editorial content, while the right column will have more evergreen site features. Our aim is to make FanGraphs more inviting and discoverable to new users, while simplifying and streamlining the experience for our current users. Almost all of the content from the old home page has been retained with the new home page. We also expanded the most popular article section (which is determined by pageviews) to include more articles and RotoGraphs content.
If you have any questions or comments, or if anything is broken, please let us know in the comments. Please include what device, browser, and operating system you are using in order to help us figure out any issues. Thank you!
Below is an analysis of the prospects in the farm system of the Colorado Rockies. Scouting reports were compiled with information provided by industry sources as well as my own observations. This is the second year we’re delineating between two anticipated relief roles, the abbreviations for which you’ll see in the “position” column below: MIRP for multi-inning relief pitchers, and SIRP for single-inning relief pitchers.
A quick overview of what FV (Future Value) means can be found here. A much deeper overview can be found here.
All of the numbered prospects below also appear on The Board, a resource the site offers featuring sortable scouting information for every organization. It has more details than this article and integrates every team’s list so readers can compare prospects across farm systems. It can be found here. Read the rest of this entry »