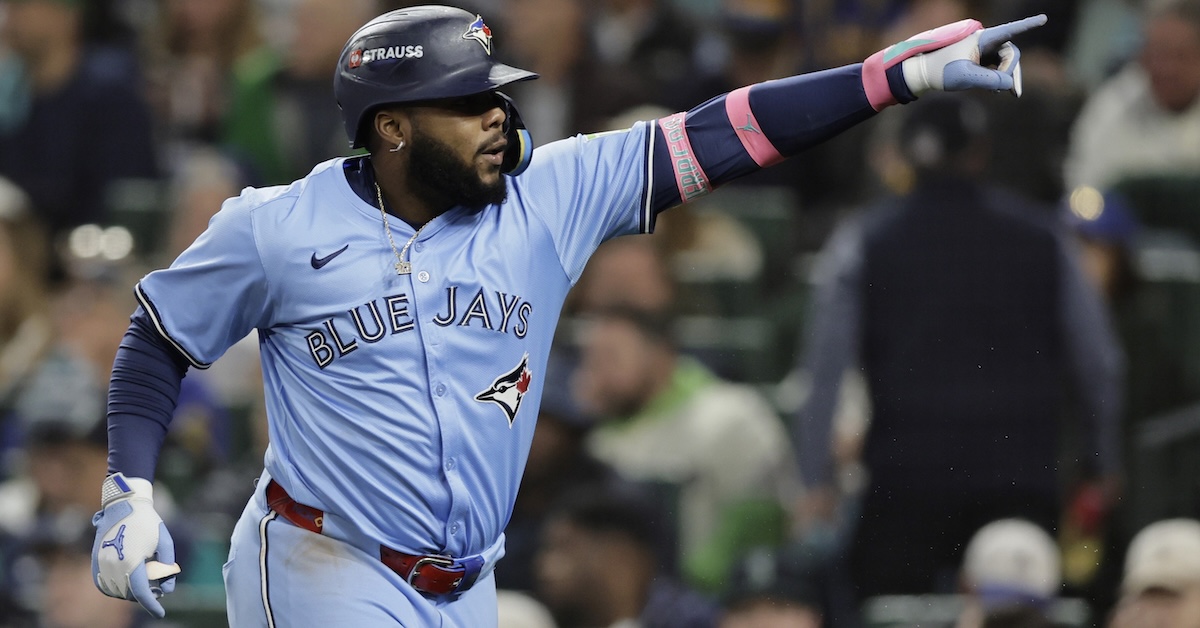
Vladimir Guerrero Jr.’s Postseason for the Ages
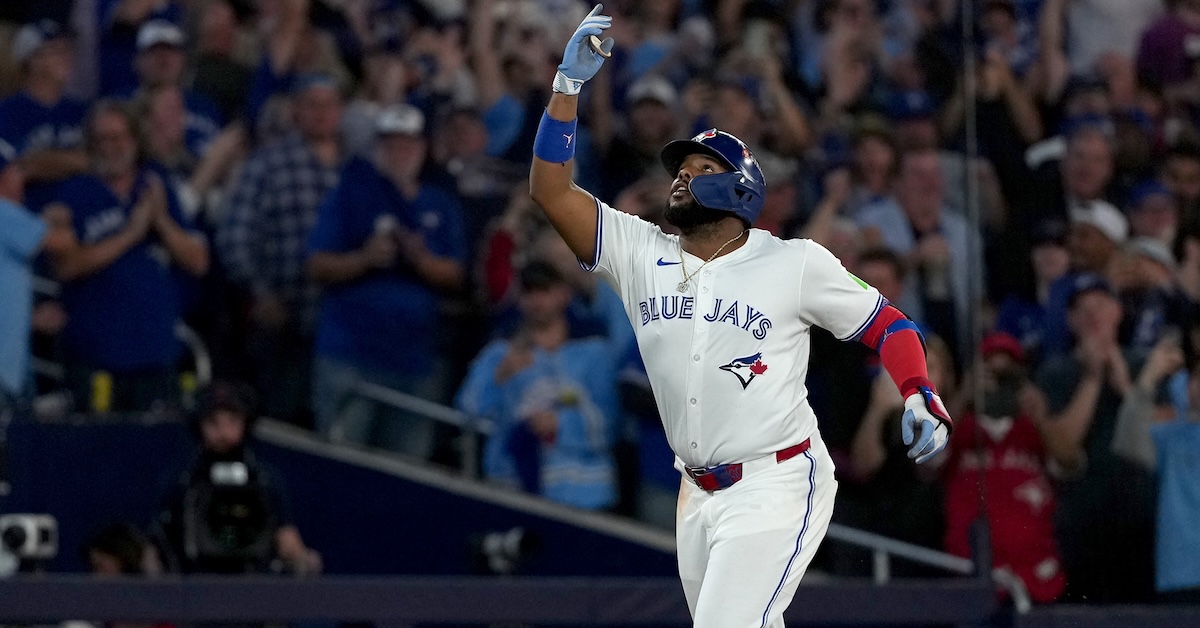
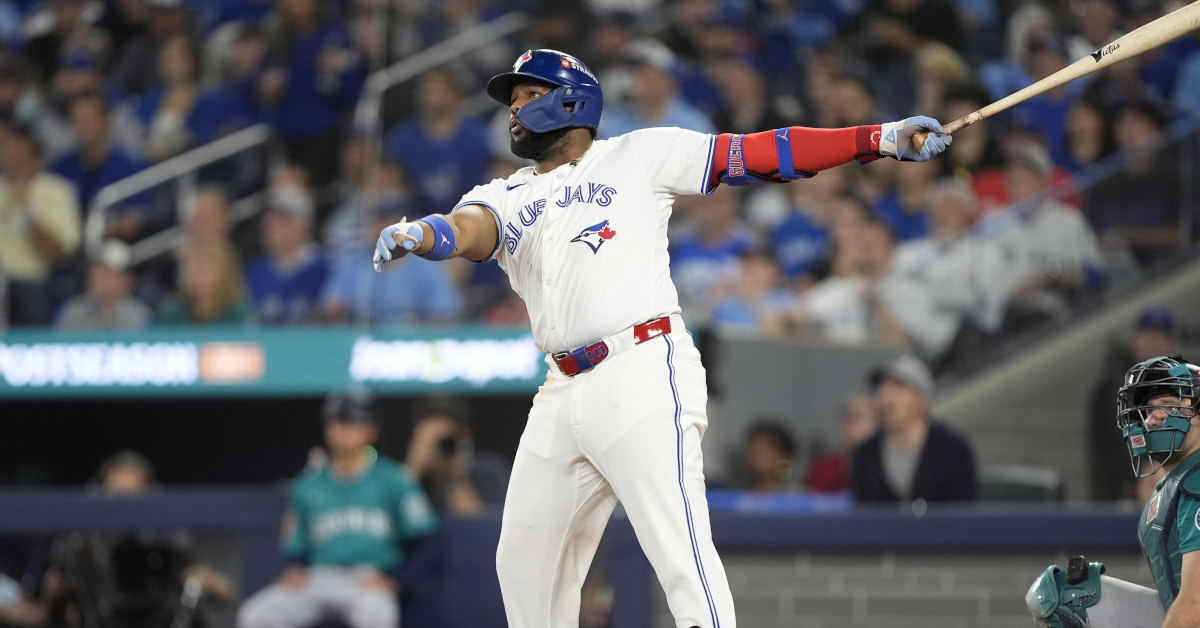
In his first postseason since signing a 14-year, $500 million extension, Vladimir Guerrero Jr. has powered the Blue Jays to within one win of their first trip to the World Series since 1993. The 26-year-old slugger continued his October heroics during Sunday night’s ALCS Game 6 in Toronto, helping the Blue Jays stave of elimination at the hands of the Mariners by clubbing his third home run of the series and sixth of the postseason while also displaying a key bit of baserunning savvy. Guerrero has rebounded from a season-ending slump to put up some absolutely astronomical numbers this fall.
Sunday night’s game didn’t start out that way for Guerrero. As they had done in Games 1 and 2 in Toronto, and Game 5 in Seattle, the Mariners kept him from doing major damage through his first two plate appearances against starter Logan Gilbert. In the first inning, with Nathan Lukes on first, Guerrero chased a low slider and grounded softly into a forceout. In the second, with the Blue Jays having rallied for two runs and with George Springer on first, he hit a scorching 116-mph grounder to the left side, where third baseman Eugenio Suárez made a diving stop, then threw to second from his knees to end the inning.
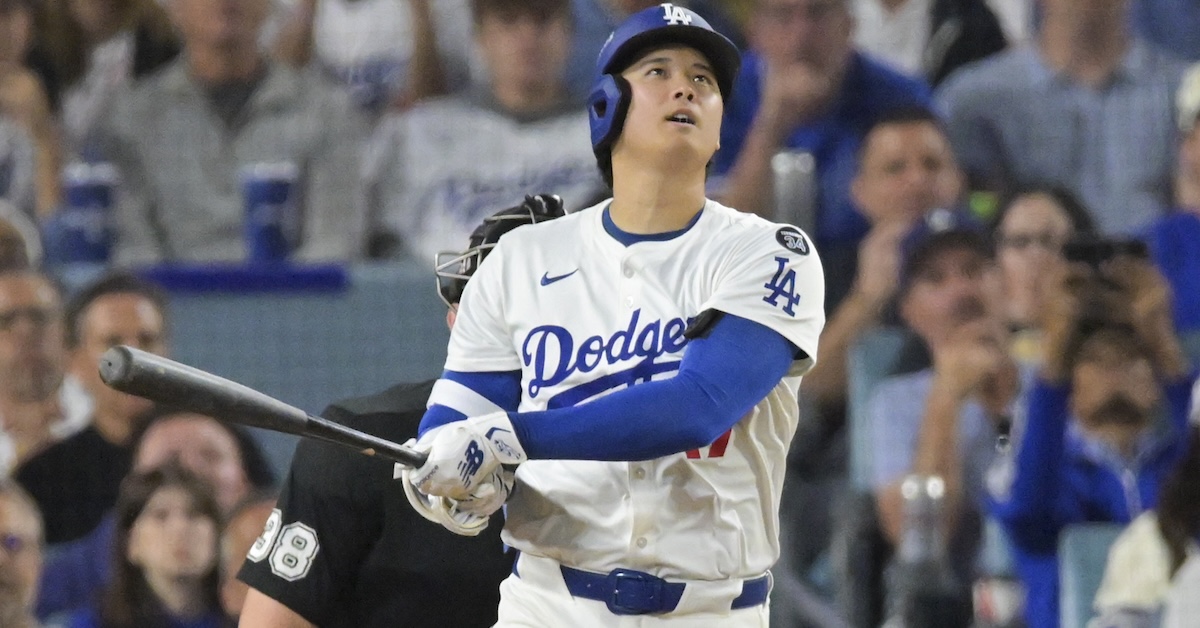
That 116-mph exit velocity was Guerrero’s hardest-hit ball of the postseason, and the eighth-hardest contact of any player this fall; the other seven, by the likes of Shohei Ohtani, Seiya Suzuki, Kyle Schwarber, Giancarlo Stanton, and Aaron Judge, all went for hits. No such luck for Vladito. Read the rest of this entry »