Archive for Teams

2019 ZiPS Projections – Oakland Athletics

After having typically appeared in the hallowed pages of Baseball Think Factory, Dan Szymborski’s ZiPS projections have now been released at FanGraphs for more than half a decade. The exercise continues this offseason. Below are the projections for the Oakland Athletics.

Batters

From the projections, one can see why the A’s let Jed Lowrie go so easily, despite his legitimate star-level performance in 2017 and ’18. Five Oakland infielders — the starters plus Franklin Barreto — project to be league-average or better. Now, none of them project to reach the level of Lowrie’s 4.9 WAR in 2018, but then again, neither does Lowrie, and mid-30s middle infielders tend to have pretty steep aging curves. And really, if anyone thought Lowrie was going to perform at an All-Star level again in 2019, he likely would have done better than two years and $20 million. Jurickson Profar projects to be a worthy replacement for Lowrie, and his return from literally years of injury and then underperformance is one of my favorite stories in baseball.

Except for catcher and the four-headed chimera in left field — at least, as our depth charts have it figured so far — the A’s project to be average or better, and sometimes significantly so, at every position. Perhaps ZiPS is trying to do penance for missing on the A’s by something like 20 wins in 2018.

Don’t get too excited about the Matt Olson comp; this version is from when Ortiz was still in the “Wait, is that the same guy as David Arias?” portion of his career, before he became Big Papi.

Pitchers

Ok, the highs are not very high. That’s due in large part to the fact that ZiPS is projecting fairly low innings totals for Oakland’s pitchers across the board. The system is aware of the injuries to Sean Manaea and Andrew Triggs in very general terms, so these aren’t theoretical “healthy” projections. As such, Manaea’s projection isn’t unexpected, but Triggs’s was a legitimate surprise to me. But again, I’m going to de-wind your sails a little bit by noting that ZiPS sees the Triggs injury as a generic “shoulder” ailment because I don’t have the data on thoracic outlet syndrome recoveries that I do with those from Tommy John. Regardless, this is an injury that you really don’t want.

The rotation’s highs may not be very high, but ZiPS sees the group as incredibly deep. 18 pitchers project to be worth at least one WAR if playing in the majors, and though a few of them are relievers (Blake Treinen, Lou Trivino, and Joakim Soria) and Brett Anderson is a free agent, that’s still a lot of options.

Bench and Prospects

I hope that someday I can love somebody or something the way ZiPS loves Jesus Luzardo. No, the computer isn’t projecting him to actually have Steve Carlton’s career, but who wouldn’t take that as a top comp? ZiPS already sees Luzardo as the team’s best starting pitcher, a pretty shocking projection for a guy who started the season in A-ball and whose parent club isn’t, say, the Baltimore Orioles.

It also interests me that ZiPS pegs Sean Murphy as the team’s best catching option. I’m definitely interested to see where he falls on the McDongenhagen prospect list; he ranked sixth last year, but after a .285/.361/.489 year and a finish at Triple-A, I would imagine he’s moved up. Conversely, Oakland cooled on Dustin Fowler and now largely sees him as a fourth outfielder. Overall, ZiPS sees a lot more of interest in the minor league pitchers than the hitters.

One pedantic note for 2019: for the WAR graphic, I’m using FanGraphs’ depth chart playing time, not the playing time ZiPS spits out, so there will be occasional differences in WAR totals.
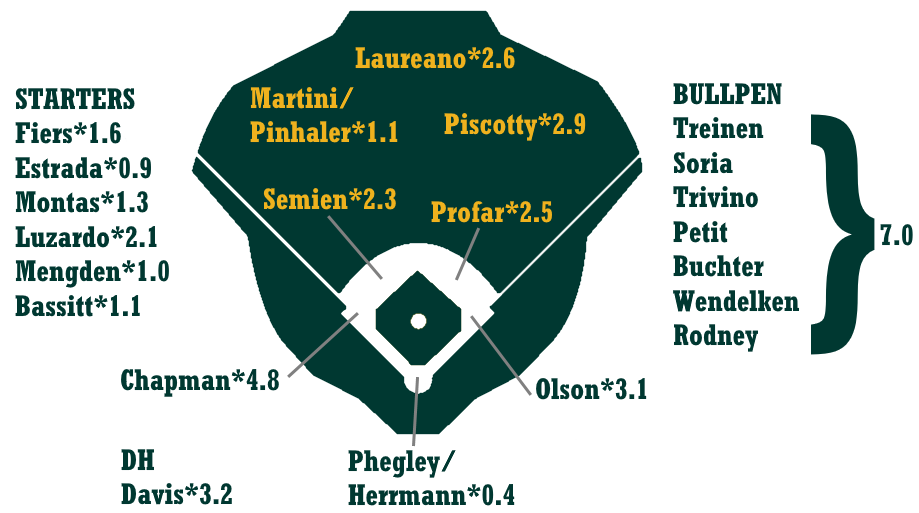
Ballpark graphic courtesy Eephus League. Depth charts constructed by way of those listed here at site.

Batters – Counting Stats
Player B Age PO G AB R H 2B 3B HR RBI BB SO SB CS
Matt Chapman R 26 3B 140 526 83 126 31 4 28 76 56 170 3 3
Matt Olson L 25 1B 150 535 81 126 30 1 31 87 70 170 2 1
Khris Davis R 31 DH 145 531 82 131 24 1 39 108 57 174 1 1
Stephen Piscotty R 28 RF 146 526 72 135 35 2 21 80 51 125 4 3
Ramon Laureano R 24 CF 120 449 62 108 23 4 15 53 43 143 18 5
Marcus Semien R 28 SS 152 580 78 145 30 3 18 67 54 132 13 4
Franklin Barreto R 23 2B 124 449 63 107 20 3 24 65 32 157 8 4
Jurickson Profar B 26 SS 137 485 68 119 28 4 13 56 49 88 8 1
Sean Murphy R 24 C 84 314 36 69 18 1 8 33 22 74 2 0
Nick Martini L 29 LF 124 426 55 104 19 3 6 42 53 103 5 2
Dustin Fowler L 24 CF 126 474 53 125 25 6 14 62 19 105 16 7
Chad Pinder R 27 LF 116 387 50 93 19 2 16 47 26 120 2 2
Mark Canha R 30 LF 119 385 55 91 24 1 16 55 32 99 3 2
Chris Herrmann L 31 C 82 210 28 42 8 2 5 25 29 67 2 0
Corban Joseph L 30 2B 122 440 47 109 20 1 9 45 30 57 4 4
Eric Campbell R 32 2B 102 325 45 77 15 2 5 39 45 71 5 4
Bruce Maxwell L 28 C 82 271 26 59 15 0 5 28 25 79 0 0
Beau Taylor L 29 C 88 305 32 63 14 1 4 26 35 95 1 1
Josh Phegley R 31 C 68 200 22 43 13 1 5 23 15 52 0 0
Luis Barrera L 23 CF 128 472 49 110 20 7 4 38 27 105 16 7
Matthew Joyce L 34 LF 109 287 41 62 15 0 11 33 44 76 1 2
Mark Payton L 27 LF 91 320 37 70 12 4 7 31 32 87 4 5
Slade Heathcott L 28 1B 80 281 31 59 12 2 6 28 23 102 6 3
Jonah Heim B 24 C 114 428 40 88 18 1 6 36 27 104 2 1
Skye Bolt B 25 CF 118 444 48 89 21 3 11 44 39 157 10 5
B.J. Boyd L 25 LF 120 469 46 111 17 3 4 38 25 93 7 4
Brett Vertigan L 28 LF 101 378 37 77 16 2 1 22 35 108 9 4
Sheldon Neuse R 24 3B 128 481 45 105 22 3 7 41 28 168 5 3
Nate Mondou L 24 2B 129 503 52 113 21 3 3 38 36 109 8 7
Tyler Ramirez L 24 LF 129 494 53 103 23 3 9 45 46 185 4 3
Melvin Mercedes B 27 2B 85 282 29 58 8 2 1 17 31 69 5 5
Jorge Mateo R 24 SS 127 500 48 103 20 11 7 45 26 163 22 11
Kevin Merrell L 23 SS 77 326 30 73 9 2 1 19 15 83 7 7
Steve Lombardozzi Jr. B 30 1B 107 388 40 89 15 2 1 25 32 64 5 5
J.P. Sportman R 27 2B 117 472 46 100 20 3 10 46 21 135 12 7
Seth Brown L 26 1B 128 497 52 101 22 3 11 51 38 182 5 2


Batters – Rate Stats
Player PA BA OBP SLG OPS+ ISO BABIP RC/27 Def WAR No. 1 Comp
Matt Chapman 591 .240 .318 .473 115 .234 .299 5.3 14 4.3 Eric Hinske
Matt Olson 614 .236 .329 .469 117 .234 .284 5.5 7 2.9 David Ortiz
Khris Davis 602 .247 .326 .516 127 .269 .289 6.0 0 2.9 Jay Buhner
Stephen Piscotty 590 .257 .331 .451 113 .194 .300 5.4 5 2.6 Jermaine Dye
Ramon Laureano 503 .241 .314 .410 98 .169 .320 4.8 7 2.4 Rob Ducey
Marcus Semien 641 .250 .313 .405 97 .155 .295 4.7 -1 2.3 Travis Fryman
Franklin Barreto 493 .238 .299 .457 105 .218 .310 4.8 3 2.2 Tony Batista
Jurickson Profar 548 .245 .326 .400 100 .155 .276 4.8 -2 2.2 Keith Lockhart
Sean Murphy 343 .220 .278 .360 75 .140 .263 3.5 5 0.9 Walt McKeel
Nick Martini 488 .244 .332 .345 88 .101 .309 4.1 5 0.9 Steve Braun
Dustin Fowler 498 .264 .293 .430 97 .167 .313 4.7 -5 0.9 Rick Manning
Chad Pinder 424 .240 .299 .424 97 .183 .307 4.4 2 0.8 Ruben Mateo
Mark Canha 430 .236 .309 .429 101 .192 .278 4.7 -4 0.5 John Valle
Chris Herrmann 242 .200 .299 .329 74 .129 .268 3.4 0 0.4 Erik Pappas
Corban Joseph 477 .248 .297 .359 80 .111 .267 3.7 0 0.3 Kevin Howard
Eric Campbell 381 .237 .336 .342 89 .105 .289 4.0 -7 0.2 Bobby Scales
Bruce Maxwell 298 .218 .282 .328 68 .111 .289 3.2 0 0.1 Dave Parrish
Beau Taylor 344 .207 .291 .298 64 .092 .286 2.9 1 0.1 Jack Fimple
Josh Phegley 220 .215 .277 .365 76 .150 .266 3.5 -2 0.1 Yorvit Torrealba
Luis Barrera 507 .233 .277 .331 67 .097 .292 3.3 3 0.0 Leo Garcia
Matthew Joyce 337 .216 .321 .383 94 .167 .255 4.1 -5 -0.1 Stu Pederson
Mark Payton 359 .219 .291 .347 76 .128 .279 3.3 2 -0.4 Nathan Panther
Slade Heathcott 311 .210 .275 .331 67 .121 .306 3.1 3 -0.5 Paul Hertzler
Jonah Heim 461 .206 .254 .294 51 .089 .258 2.5 3 -0.5 Damon Berryhill
Skye Bolt 492 .200 .267 .336 65 .135 .283 3.0 0 -0.5 Steve Moss
B.J. Boyd 503 .237 .280 .311 64 .075 .288 3.1 7 -0.6 Corey Coles
Brett Vertigan 420 .204 .272 .265 50 .061 .283 2.5 11 -0.6 Jay Sitzman
Sheldon Neuse 514 .218 .261 .320 60 .102 .320 2.9 3 -0.7 Jeff Moronko
Nate Mondou 554 .225 .283 .296 61 .072 .281 2.8 1 -0.7 Frank Martinez
Tyler Ramirez 551 .209 .282 .322 67 .113 .313 3.1 4 -0.8 Troy O’Leary
Melvin Mercedes 319 .206 .288 .259 54 .053 .269 2.4 -1 -0.8 Luis Lorenzana
Jorge Mateo 535 .206 .250 .332 59 .126 .291 2.8 -1 -0.9 Mike Benjamin
Kevin Merrell 346 .224 .259 .273 48 .049 .298 2.2 -3 -1.3 Mike Huyler
Steve Lombardozzi Jr. 429 .229 .289 .286 61 .057 .272 2.8 -1 -1.5 Keith Smith
J.P. Sportman 498 .212 .249 .331 58 .119 .275 2.8 -5 -1.5 Tom Nevers
Seth Brown 540 .203 .261 .326 61 .123 .296 2.9 -3 -2.1 Craig Cooper


Pitchers – Counting Stats
Player T Age W L ERA G GS IP H ER HR BB SO
Blake Treinen R 31 6 3 2.66 65 0 71.0 57 21 4 24 77
Jesus Luzardo L 21 9 6 3.59 23 23 102.7 99 41 10 31 94
Sean Manaea L 27 8 7 4.15 22 21 121.3 123 56 15 32 87
Daniel Mengden R 26 9 8 4.37 28 24 138.0 144 67 18 40 96
Chris Bassitt R 30 7 6 4.12 25 18 107.0 108 49 11 42 84
Mike Fiers R 34 9 8 4.29 27 26 142.7 145 68 23 41 118
Lou Trivino R 27 7 4 3.36 66 1 72.3 63 27 5 30 70
Frankie Montas R 26 8 8 4.41 31 22 118.3 127 58 14 45 90
Jharel Cotton R 27 7 6 4.26 20 19 112.0 111 53 15 41 97
Andrew Triggs R 30 5 4 3.82 13 13 70.7 68 30 7 21 62
Joakim Soria R 35 4 2 3.11 60 0 55.0 48 19 4 17 60
Brett Anderson L 31 6 6 4.22 22 21 102.3 116 48 11 26 64
Liam Hendriks R 30 4 2 3.27 56 5 55.0 47 20 5 18 63
Brian Howard R 24 8 9 4.46 23 22 123.0 134 61 17 38 91
Jake Buchanan R 29 8 8 4.68 25 22 130.7 154 68 12 45 68
Parker Dunshee R 24 6 7 4.64 25 21 120.3 128 62 20 38 96
Marco Estrada R 35 9 9 4.75 26 26 142.0 140 75 22 50 105
Ben Bracewell R 28 7 7 4.68 25 21 119.3 132 62 16 38 75
A.J. Puk L 24 6 5 4.26 18 16 82.3 78 39 8 41 80
Paul Blackburn R 25 6 6 4.47 20 20 104.7 115 52 12 29 59
Tanner Anderson R 26 5 5 4.12 40 6 89.7 97 41 8 29 54
J.B. Wendelken R 26 3 2 3.78 58 1 69.0 67 29 7 25 67
Matt Milburn R 25 7 8 4.87 25 23 138.7 163 75 21 26 76
Aaron Brooks R 29 7 7 4.70 27 19 111.0 128 58 17 30 79
Daniel Gossett R 26 7 8 4.83 22 22 113.7 122 61 16 44 84
Eric Jokisch L 29 7 7 4.72 24 20 124.0 141 65 16 43 77
Fernando Rodney R 42 4 3 3.86 57 0 53.7 48 23 5 26 54
Yusmeiro Petit R 34 4 3 3.94 59 0 75.3 74 33 11 16 64
Xavier Altamirano R 24 8 9 4.95 26 23 127.3 148 70 18 42 72
Edwin Jackson R 35 6 7 4.75 26 22 119.3 125 63 18 51 85
James Naile R 26 7 9 4.98 24 23 128.3 151 71 18 41 64
Kyle Lobstein L 29 6 7 4.87 24 19 101.7 107 55 13 44 72
Ryan Buchter L 32 3 2 3.61 59 0 47.3 40 19 5 20 47
Kyle Crockett L 27 2 2 3.88 51 0 48.7 49 21 6 13 42
Ryan Dull R 29 3 3 4.00 54 0 54.0 49 24 8 16 54
Grant Holmes R 23 9 11 4.92 26 21 124.3 127 68 18 61 105
Jerry Blevins L 35 3 2 3.96 61 0 38.7 36 17 4 19 39
Brian Schlitter R 33 4 3 4.15 50 0 52.0 54 24 2 26 30
Dean Kiekhefer L 30 4 4 4.25 48 1 55.0 61 26 6 13 34
Wei-Chung Wang L 27 6 8 4.97 31 19 114.0 127 63 18 43 78
Raul Alcantara R 26 5 7 5.10 30 14 90.0 105 51 16 21 48
Carlos Ramirez R 28 2 2 4.86 38 1 50.0 48 27 6 33 44
Jarret Martin L 29 2 2 4.66 41 0 46.3 41 24 3 41 45
Kyle Finnegan R 27 2 3 4.93 40 1 49.3 50 27 7 27 41
Sam Bragg R 26 4 5 5.14 38 4 70.0 79 40 10 28 43
Miguel Romero R 25 2 3 4.86 41 1 53.7 57 29 8 21 43
John Gorman R 27 3 3 4.83 39 0 54.0 60 29 8 19 35
Norge Ruiz R 25 6 9 5.31 23 22 118.7 144 70 19 42 60
Parker Bridwell R 27 4 6 5.52 22 16 93.0 105 57 19 33 61


Pitchers – Rate Stats
Player TBF K/9 BB/9 HR/9 BABIP ERA+ ERA- FIP WAR No. 1 Comp
Blake Treinen 291 9.76 3.04 0.51 .288 154 65 2.81 2.0 Jason Isringhausen
Jesus Luzardo 437 8.24 2.72 0.88 .301 114 88 3.67 1.9 Steve Carlton
Sean Manaea 516 6.45 2.37 1.11 .287 102 98 4.26 1.6 Kirk Rueter
Daniel Mengden 593 6.26 2.61 1.17 .291 97 103 4.45 1.6 Charlie Corbell
Chris Bassitt 470 7.07 3.53 0.93 .298 103 97 4.29 1.5 Jim Bagby
Mike Fiers 610 7.44 2.59 1.45 .290 96 105 4.60 1.5 Bob Walk
Lou Trivino 308 8.71 3.73 0.62 .290 126 79 3.48 1.4 Hector Carrasco
Frankie Montas 524 6.85 3.42 1.06 .306 96 104 4.46 1.2 Bill Swift
Jharel Cotton 485 7.79 3.29 1.21 .294 96 104 4.39 1.2 Zach Day
Andrew Triggs 300 7.90 2.67 0.89 .296 111 90 3.74 1.2 Scott Erickson
Joakim Soria 228 9.82 2.78 0.65 .303 136 73 2.95 1.2 Rich Gossage
Brett Anderson 443 5.63 2.29 0.97 .309 97 103 4.12 1.1 Jerry Reuss
Liam Hendriks 228 10.31 2.95 0.82 .298 129 77 3.08 1.1 Bert Roberge
Brian Howard 540 6.66 2.78 1.24 .303 92 109 4.59 1.1 Sergio Mitre
Jake Buchanan 588 4.68 3.10 0.83 .312 90 111 4.52 1.0 Joe Genewich
Parker Dunshee 526 7.18 2.84 1.50 .297 91 110 4.86 1.0 Kelly Downs
Marco Estrada 607 6.65 3.17 1.39 .276 89 112 4.78 1.0 Mike Moore
Ben Bracewell 525 5.66 2.87 1.21 .298 90 111 4.77 1.0 Pat Ahearne
A.J. Puk 364 8.74 4.48 0.87 .303 96 104 4.11 0.9 Derek Thompson
Paul Blackburn 454 5.07 2.49 1.03 .295 92 109 4.49 0.9 Ron Reed
Tanner Anderson 393 5.42 2.91 0.80 .300 100 100 4.24 0.9 Chad Kimsey
J.B. Wendelken 298 8.74 3.26 0.91 .308 112 89 3.79 0.8 Blaine Neal
Matt Milburn 601 4.93 1.69 1.36 .302 87 115 4.76 0.8 Heath Totten
Aaron Brooks 488 6.41 2.43 1.38 .312 90 111 4.69 0.8 Lary Sorensen
Daniel Gossett 504 6.65 3.48 1.27 .299 88 114 4.82 0.7 Jake Joseph
Eric Jokisch 552 5.59 3.12 1.16 .305 87 115 4.77 0.7 Jimmy Anderson
Fernando Rodney 235 9.06 4.36 0.84 .295 110 91 4.03 0.7 Roberto Hernandez
Yusmeiro Petit 310 7.65 1.91 1.31 .288 104 96 3.99 0.7 Dick Hall
Xavier Altamirano 569 5.09 2.97 1.27 .303 86 117 5.03 0.6 Nate Cornejo
Edwin Jackson 528 6.41 3.85 1.36 .288 86 116 5.04 0.6 Jim Hearn
James Naile 573 4.49 2.88 1.26 .300 85 118 5.10 0.6 Michael Macdonald
Kyle Lobstein 453 6.37 3.90 1.15 .295 87 115 4.84 0.6 Jimmy Anderson
Ryan Buchter 201 8.94 3.80 0.95 .276 113 88 3.93 0.6 J.C. Romero
Kyle Crockett 206 7.77 2.40 1.11 .301 109 92 3.95 0.5 Mike Jeffcoat
Ryan Dull 225 9.00 2.67 1.33 .283 106 95 4.08 0.5 Todd Burns
Grant Holmes 559 7.60 4.42 1.30 .296 83 120 4.98 0.4 Ken Pumphrey
Jerry Blevins 171 9.08 4.42 0.93 .302 104 97 4.18 0.3 Marshall Bridges
Brian Schlitter 234 5.19 4.50 0.35 .299 99 101 4.11 0.3 Don McMahon
Dean Kiekhefer 238 5.56 2.13 0.98 .302 96 104 4.20 0.3 John Boozer
Wei-Chung Wang 507 6.16 3.39 1.42 .299 82 121 5.07 0.3 Greg Kubes
Raul Alcantara 394 4.80 2.10 1.60 .294 83 121 5.29 0.2 Tim Kester
Carlos Ramirez 230 7.92 5.94 1.08 .292 87 115 5.11 0.0 Hal Reniff
Jarret Martin 221 8.74 7.96 0.58 .295 88 114 4.90 0.0 Arnold Earley
Kyle Finnegan 223 7.48 4.93 1.28 .295 86 116 5.10 0.0 Mike Zimmerman
Sam Bragg 315 5.53 3.60 1.29 .300 82 122 5.15 -0.1 Chuck Crumpton
Miguel Romero 238 7.21 3.52 1.34 .301 84 119 4.83 -0.1 Andy Nezelek
John Gorman 240 5.83 3.17 1.33 .297 85 118 5.00 -0.1 Reid Santos
Norge Ruiz 538 4.55 3.19 1.44 .304 77 130 5.43 -0.1 Melqui Torres
Parker Bridwell 414 5.90 3.19 1.84 .290 77 130 5.69 -0.2 Dana Kiecker


Disclaimer: ZiPS projections are computer-based projections of performance. Performances have not been allocated to predicted playing time in the majors — many of the players listed above are unlikely to play in the majors at all in 2019. ZiPS is projecting equivalent production — a .240 ZiPS projection may end up being .280 in AAA or .300 in AA, for example. Whether or not a player will play is one of many non-statistical factors one has to take into account when predicting the future.

Players are listed with their most recent teams, unless I have made a mistake. This is very possible, as a lot of minor-league signings go generally unreported in the offseason.

ZiPS’ projections are based on the American League having a 4.29 ERA and the National League having a 4.15 ERA.

Players who are expected to be out due to injury are still projected. More information is always better than less information, and a computer isn’t the tool that should project the injury status of, for example, a pitcher who has had Tommy John surgery.

Both hitters and pitchers are ranked by projected zWAR — which is to say, WAR values as calculated by me, Dan Szymborski, whose surname is spelled with a z. WAR values might differ slightly from those which appear in full release of ZiPS. Finally, I will advise anyone against — and might karate chop anyone guilty of — merely adding up WAR totals on a depth chart to produce projected team WAR.

Job Posting: Astros Baseball Research and Development

Please note, this posting contains three positions.

Baseball Systems Developer, Research & Development

Department: Baseball Operations
Supervisor: Senior Architect, Research and Development
Classification: Full-time (Exempt)

The Houston Astros are seeking a Baseball Systems Developer for the team’s Baseball Research and Development group. The Baseball Systems Developer will work closely with the Senior Architect of R&D as part of a cross-functional agile team to build infrastructure and design systems that encourage the effective understanding and application of information throughout Baseball Operations.

Essential Duties & Responsibilities:

  • Collaborate with a cross-functional agile team on designing, testing, implementing, and maintaining scalable software for Baseball Operations
  • Collaborate with a cross-functional agile team on improving efficiency and scalability of current Baseball Operations software

Education and/or Experience:

  • Bachelor’s degree in computer science or related field is preferred
  • Proficient in at least two of the following:
    • C# and ASP.NET or ASP.NET Core
    • HTML/JavaScript (TypeScript preferred)/CSS
    • A front-end framework like React, Angular, or Vue
  • Experience with Microsoft Azure/Amazon Web Services/Google Cloud platform is preferred
  • Experience with continuous integration/continuous deployment is preferred
  • Experience with data visualization tools such as Plotly and D3 is preferred
  • Experience with formal software (unit/integration/ testing and data-driven development preferred
  • Experience with agile software development processes preferred
  • Familiarity with Python and R Shiny Apps preferred
  • Strong analytical and problem-solving skills
  • Strong interpersonal and communication skills (written and verbal)

To Apply:
To apply, please visit TeamWorkOnline and complete the application.

Baseball Systems Data Modeler, Research & Development

Department: Baseball Operations
Supervisor: Senior Architect, Research and Development
Classification: Full-time (Exempt)

The Houston Astros are seeking a Baseball Systems Data Modeler for the team’s Baseball Research and Development group. The Baseball Systems Data Modeler will work closely with the Senior Architect of R&D as part of a cross-functional agile team to build infrastructure and design systems that encourage the effective understanding and application of information throughout Baseball Operations.

Essential Duties & Responsibilities:

  • Create and maintain ETL jobs for incoming data feeds
  • Ensure data integrity within the database and data processes
  • Design, implement, and maintain data mapping procedures
  • Apply statistical methods for handling and testing missing data problems

Education and/or Experience:

  • Bachelor’s degree in computer science or related field is preferred
  • Experience with SQL Server and T-SQL, including SQL Server Reporting Service and SQL Server Integration Services
  • Experience with designing and developing data marts
  • Experience with data governance
  • Understanding of baseball data (e.g., TrackMan, Statcast) is preferred
  • Experience with Microsoft Azure/Amazon Web Services/Google Cloud platform is preferred
  • Experience with continuous integration/continuous deployment is preferred
  • Experience with agile software development processes preferred
  • Experience with software testing and data-driven development preferred
  • Familiarity with Python and R is preferred
  • Strong analytical and problem-solving skills
  • Strong interpersonal and communication skills (written and verbal)

To Apply:
To apply, please visit TeamWorkOnline and complete the application.

Machine Learning Engineer, Research & Development

Department: Baseball Operations
Supervisor: Director, Research and Development
Classification: Full-time (Exempt)

The Houston Astros are seeking a Machine Learning Engineer for the team’s Baseball Research and Development group. The Machine Learning Engineer will work closely with the Senior Architect and Director of R&D as part of a cross-functional agile team to deploy statistical, machine learning, and deep learning models at scale and to ensure that they are reliable and repeatable.

Essential Duties & Responsibilities:

  • Collaborate with a cross-functional agile team on developing machine learning systems from prototyping to production
  • Support investigation of new software packages/vendors, APIs, and algorithms to deliver quality analytics and machine learning at scale
  • Develop infrastructure and tools to productionize new algorithms in a repeatable manner

Education and/or Experience:

  • Advanced degree in statistics, engineering, applied math, physics, quantitative social sciences, computer science, operations research or similar field or professional experience preferred
  • Fluency in R, including experience with the tidyverse and modern R development practices
  • Fluency in Python with preference for Python 3 experience
  • Experience with software testing and data-driven development strongly preferred
  • Experience with large data sets and distributed computing strongly preferred
  • Experience with deep learning frameworks (Tensorflow, CNTK, Caffe, etc.) preferred
  • Ability to write SQL queries is preferred
  • Experience with agile software processes preferred
  • Strong analytical and problem-solving skills
  • Strong interpersonal and communication skills (written and verbal)

To Apply:
To apply, please visit TeamWorkOnline and complete the application.

For all positions:

Work Environment
This job operates in an office setting. This role routinely uses standard office equipment such as computers, phones, photocopiers, and filing cabinets. The noise level is usually moderate but can be loud within the stadium environment.

Physical Demands
The physical demands described here are representative of those that must be met by an employee to successfully perform the essential functions of this job. This is a largely sedentary role; however, some filing is required. This would require the ability to lift files, open filing cabinets and bend or stand on a stool as necessary.

Position Type and Expected Hours of Work
Ability to work a flexible schedule, including evenings, weekends, and holidays.

Travel
Rare travel maybe expected in this role.

Other Duties
Please note this job description is not designed to cover or contain a comprehensive listing of activities, duties or responsibilities that are required of the employee for this job. Duties, responsibilities and activities may change at any time with or without notice.

The Astros are an equal opportunity employer and all qualified applicants will receive consideration for employment without regard to race, color, religion, sex, national origin, disability status, protected veteran status, or any other characteristic protected by law.

EOE/M/F/Vet/Disability.

The content in this posting was created and provided solely by the Houston Astros.


Mets Pitchers Adopted a Whole New Identity

With spring training just around the corner, I should remind you that you should feel safe ignoring just about everything anyone says. There’s so much noise, and so little signal. It makes sense that it would be that way, to be sure — it’s an optimistic time of year — but optimism has a tenuous relationship with the reality of the future. Every clubhouse has a great group of guys. Every team is talented enough to surprise some people. Every injury is buried in the past. Every new pitch is going to miss bats.

People say optimistic things about themselves, and coaches say optimistic things about strategy implementation. Here’s how these players are going to platoon. Here’s how the bullpen is going to shake out. Here’s how the team will fold in more shifts. How many times have we heard coaches say their clubs are going to run more often? The clubs typically don’t run more often. It’s just a thing to say when it’s still theoretical. When the games start to count, only then can you test one’s commitment to an idea.

With all of this in mind, I’d like to bring your attention to the 2018 Mets. The 2018 Mets operated under a new pitching coach, in Dave Eiland. Like many other coaches, Eiland voiced some ideas in spring training. But out of that fog, the Mets did something concrete. As is common, there was an idea. As is uncommon, there was subsequent follow-through.

Read the rest of this entry »


Ross Atkins on the Blue Jays’ Process

Ross Atkins was hired as Toronto’s Executive VP of Baseball Operations and General Manager in December 2015, shortly after Mark Shapiro was officially named the team’s President and CEO. Both came to the Blue Jays from Cleveland, where they’d worked together with the Indians for the past 15 years. A formidable pairing atop Toronto’s front office hierarchy, they are — as Atkins is quick to point out — nonetheless just two pieces of a much larger puzzle.

The Blue Jays have undergone organizational change in recent seasons, but the past six months stand out. John Gibbons was formally dismissed as manager in late September, and several members of his coaching staff followed him out the door. The roster has also undergone change. Troy Tulowitzki has departed, as have Russell Martin, Josh Donaldson, Curtis Granderson, Marco Estrada, and JA Happ. Notably, all of these player are 33 years old or older.

Fifty-three-year-old Charlie Montoyo is the biggest incoming name. The bench coach in Tampa Bay last year, Montoyo has replaced Gibbons in the manager’s chair. Four of his coaches are imports from other organizations, while two others were promoted from Toronto’s minor league system. Pete Walker and Luis Rivera are the only holdovers.

As is common within the industry, there have also been hirings, promotions, and the shifting of responsibilities throughout Toronto’s various departments. How do Atkins and Shapiro go about making such moves — not just in the front office, but across the board? Atkins addressed that question in a wide-ranging interview late last week. Read the rest of this entry »


Rockies and Arenado Approach the Summit of a Long-Term Deal

Nolan Arenado has ranked among the game’s elite third basemen for the past four seasons, and he’s already made headlines this winter. Last week, he and the Rockies averted an arbitration hearing when he agreed to a $26 million salary for 2019, a record for an arbitration-eligible player. Now, there’s optimism in Denver that the team could reach a longer-term deal that would keep Arenado in purple. It’s a move that not only would be in character for a franchise that has made a concerted attempt to keep its iconic players, but could also impact this winter’s frigid free agent market.

Arenado, who will turn 28 on April 16, is coming off a .297/.374/.561 showing with 38 homers, a 132 wRC+, and 5.7 WAR in 2018. He led the NL in home runs for the third year out of the past four, and while that feat owes much to Coors Field (he has an 87-71 home/road home run split in that span), improved plate discipline has helped him increase both his wRC+ and WAR every year since his 2013 rookie season. Last year’s incremental steps forward owe much to Arenado’s career-best 10.8% walk rate, more than double his 2013-15 mark (5.0%); that increase has keyed a 52-point rise in on-base percentage from his first three years (.318) to his last three (.370).

And then there’s the leather. Arenado has won a Gold Glove in each of his six seasons, and has won the Platinum Glove as the NL’s top overall defender, in each of the past two years; he also took home the Fielding Bible Award as the majors’ top third baseman annually from 2015-17. While UZR doesn’t value his defense nearly as highly as DRS (career totals of 37.6 and 109, respectively), the two marks converged last year (5.8 and 5, respectively). Beyond the numbers, his highlight clips are appointment viewing. Here is the MLB Network compilation of his dives, spins, barehanded grabs, and seemingly impossible throws that accompanied Arenado’s 2018 award wins:

And here’s perhaps his most famous play, his April 14, 2015 over-the-shoulder-and-over-the-tarp-roll catch of a foul ball:

This is an excellent, entertaining player, a franchise cornerstone who has helped take the Rockies to back-to-back playoff appearances for the first time in club history.

After making $17.75 million last year as part of a two-year, $29.5 million extension signed in January 2017, Arenado sought $30 million in arbitration, with the Rockies countering at $24 million. Even if he’d lost a hearing, he would have surpassed Josh Donaldson’s $23 million salary from last year with the highest one-year salary for an arbitration-eligible player. According to The Athletic’s Ken Rosenthal, Arenado and the Rockies settled at $26 million after a face-to-face meeting:

Since then, Monfort has publicly expressed hope for the possibility of a long-term deal. On Monday, he told the Denver Post’s Patrick Saunders, “I’m optimistic that we are close enough that something will come about. It’s in Nolan’s hands, but my last impression with him is that this is something he wants to do.” While stressing that there was no timetable to complete a longer deal, Monfort added, “[W]hat I took out of [the meeting] was a good, sincere [attitude] of, ‘Let’s get this behind us, then let’s go on to the next step and see if we can work something out there.'”

Per to Saunders, Arenado recently said, “I think the future is much brighter in Colorado than it’s been in the past. That excites me and makes me very aware of what’s going on here.” Indeed, an impressive nucleus of young, affordable starting pitching (Kyle Freeland, Jon Gray, German Marquez, Tyler Anderson, and Antonio Senzatela) and the development of shortstop Trevor Story have been key elements of the Rockies’ recent success; that core is under club control through 2021 and ’22. What’s more, the team’s TV revenue situation is better than has been previously reported; the Rockies are making $40 million per year now, not $20 million, which was tied for last among the 29 US teams in Craig Edwards’ 2016 roundup. The team’s current deal runs through 2020, and negotiations for a new one are expected to get underway this summer.

With such a revenue stream, Monfort seems to feel that the Rockies can support a payroll that includes a major commitment to Arenado on a long-term deal. While Cot’s Contracts projects the team to set a franchise record with an Opening Day payroll just over $143 million — up from around $137 million in 2018 (14th in the majors) and $127.8 million in 2017 (15th) — the Rockies have only $40 million committed for 2021, and $23 million for ’22, though of course, the salary increases of their many arb-eligible players will increase those figures.

In marked contrast to the White Sox, whose history under Jerry Reinsdorf I examined on Monday, the Rockies haven’t shied away from sizable long-term commitments. Granted, Monfort and his brother Charlie were merely minority partners until December 2005, when they bought out Jerry McMorris, the team’s principal owner since 1993 (before that, oy, there’s a story). During the McMorris era, the Rockies signed free agents Larry Walker (six years, $75 million in April 1995), Mike Hampton (eight years, $121 million in December 2000), and Denny Neagle (five years, $51 million, also in December 2000) — of which only the first deal went well, the last two disastrously — and extended franchise icon Todd Helton (nine years, $141.5 million, covering 2003-11). The Monforts were the principal owners when the Rockies extended Troy Tulowitzki (10 years, $157.75 million deal in 2010), as well as Charlie Blackmon (six years, $108 million last April), and when they added free agents Ian Desmond (five years, $70 million in December 2016) and Wade Davis (three years, $52 million in December 2017). In terms of guaranteed money, all of those deals besides those of Neagle and Davis exceed the largest guaranteed contract ever signed by the White Sox, Jose Abreu’s six-year, $68 million pact from October 2013.

Whether on the watch of McMorris or the Monforts, not all of the Rockies’ big contracts have unfolded for the better. Some of that has to do with the particularities of playing at altitude — pitches don’t break as much, and athletes’ bodies don’t hold up as well — and some of it has to do with flawed evaluations of the players in question. At a time when so many teams are wringing their hands about spending money, it’s still noteworthy that the Rockies have stepped up to keep their top players. Extending Arenado, and assuming the risks that come with it, would be more in keeping with their style than (to return to my previous example) the White Sox signing Bryce Harper or Manny Machado.

Of course, Arenado has to agree to a deal for this all to come to fruition, and it’s a bit ominous to think of how the relatively grim landscapes of the past two winters might be helping to fulfill the vision that the owners colluded in the mid-1980s to make happen: star players staying with their teams instead of testing the market and creating bidding wars. Still, free agency isn’t an obligation that every star has to fulfill; the combination of comfort and a record-setting salary in a competitive situation isn’t something to be taken lightly.

On that note, if an Arenado extension is completed before Machado signs, it would likely set a new baseline for third basemen (by topping Alex Rodriguez‘s $27.5 million average annual value) and perhaps for all position players (by topping Miguel Cabrera’s $31 million AAV). That, as Rosenthal pointed out, will make it harder for any team in pursuit of Harper or Machado to argue that those younger, higher-profile players should be paid less money.

After the past two winters of slow (or even negative) growth, it’s difficult to put too much faith in long-term estimates, but using the FanGraphs Contract estimation tool with very conservative parameters — $8.0 million per WAR, and just 3% average annual inflation, as opposed to $9 million or more and 5% — suggests a valuation approach $300 million:

Nolan Arenado’s Contract Estimate — 8 yr / $293.9 M
Year Age WAR $/WAR Est. Contract
2019 28 5.2 $8.0 M $41.6 M
2020 29 5.2 $8.2 M $42.8 M
2021 30 5.2 $8.5 M $44.1 M
2022 31 4.7 $8.7 M $41.1 M
2023 32 4.2 $9.0 M $37.8 M
2024 33 3.7 $9.0 M $33.3 M
2025 34 3.2 $9.0 M $28.8 M
2026 35 2.7 $9.0 M $24.3 M
Totals 34.1 $293.9 M

Assumptions

Value: $8M/WAR with 3.0% inflation (for first 5 years)
Aging Curve: +0.25 WAR/yr (18-24), 0 WAR/yr (25-30),-0.5 WAR/yr (31-37),-0.75 WAR/yr (> 37)

Dialing the inflation back even further, to 1%, yields a $279.7 million valuation, and cutting the dollars per WAR figure to a retrograde $7.0 million with that minimal inflation in place still yields $244.7 million. In other words, even using extremely modest assumptions, an eight-year deal for Arenado (presumably incorporating this year’s salary) should bypass Cabrera’s eight-year, $248 million extension.

Another byproduct of an Arenado extension might be a change in the Yankees’ current approach. Circa late November, Rosenthal suggested that their lukewarm pursuits of Harper and Machado — due to a logjam of outfielders in the former case and the infamous “Johnny Hustle” comments in the latter — was because they were more interested in pursuing Arenado (who’s about 18 months older than Harper and 15 months older than Machado) once he reached free agency. In January, SNY.tv’s Andy Martino wrote that Yankees might be working on an even more immediate timeline, “[P]eople briefed on the Yankees thinking say that GM Brian Cashman — who did not respond to a request for comment — has internally discussed the possibility of trying to trade for Arenado either now or during the season. One source said that the teams have likely talked already, but neither Cashman nor Rockies GM Jeff Bridich have confirmed this.”

In theory, if Arenado does cement his desire to stay in Denver long-term, the Yankees could circle back to Machado, whose list of suitors for a long-term deal appear to consist of the White Sox, Padres, Phillies, and a conspicuous lack of other teams. Then again, if Cashman and company have shied away this long, one expects they’ll concoct some other rationale for bypassing Machado and Harper. And it is worth noting that the possibility of signing Harper and Machado was offered as a potential rationale for not signing free agents last winter. While his resume is certainly impressive, it will be interesting to see if Arenado can avoid a similar fate. There’s always another young buck coming, after all, and Mike Trout is only under club control through 2020.

On the other hand, if Arenado and the Rockies don’t get a deal done, it will be very interesting to see how the summer plays out. With the Giants and Diamondbacks both rebuilding, and the Padres possibly looking to spend their way to an earlier competitive window by signing one of the big two free agents, the NL West probably won’t be the three-team race of yesteryear. A Rockies team that’s out of the playoff hunt could conceivably trade Arenado at the July 31 deadline — or even in August, given his huge salary — if he suggests he plans to move on next winter anyway. A Rockies team that’s still in the race for a Wild Card spot or even the NL West flag (something the Rockies have yet to win) as Arenado eyes the horizon would face quite a quandary.

In all of this, we have yet to hear Arenado definitively say that he wants to stick around, but that’s not uncommon. There’s no reason for him to surrender leverage until he’s secured what he wants, and besides, his real talking on that score will be done with a pen and a contract. Until then, this is all just cloud talk, though amid so much cynicism, it’s quaintly refreshing to hear a star and a team at least thinking aloud about sticking together.


2019 ZiPS Projections – Los Angeles Angels

After having typically appeared in the hallowed pages of Baseball Think Factory, Dan Szymborski’s ZiPS projections have now been released at FanGraphs for more than half a decade. The exercise continues this offseason. Below are the projections for the Los Angeles Angels, allegedly of Anaheim.

Batters

You may have heard of Mike Trout; he’s pretty good. I’m amazed that Andrelton Simmons still seems to be underrated by the media and fans. When was the last time a shortstop with a crazily hyped glove was underrated? You’d almost think that he was Adam Everett or Mark Belanger or Omar Vizquel when in fact he’d have been worth just under eight WAR over the last two seasons if he were a league-average defensive shortstop. Simmons has already snuck into the Top 50 all-time by my colleague Jay Jaffe’s JAWS metric, just a season from catching Dave Concepcion, Rafael Furcal, Vizquel, and the fringe Hall of Famer Rabbit Maranville. ZiPS projects Simmons to finish his career as the No. 14 shortstop by JAWS, just behind Derek Jeter and Barry Larkin, and just ahead of Bobby Wallace and Lou Boudreau. Andrelton is a superstar.

Albert Pujols is no longer a major league-caliber baseball player. He’s collected his 3000th hit and his 600th home run, but pretending that Pujols, at his best one of the greatest hitters of our generation, deserves a spot on the roster, let alone significant playing time, is becoming increasingly untenable. At some point, the Angels have to approach him with a plan to make as graceful and quick an exit from his playing career as they can manage, because in a world where the team was serious about fielding the best possible roster, they would be contemplating Pujols’ unconditional release. Even the creators of AfterMASH only needed two seasons to figure out they could only taint M*A*S*H’s legacy. The Angels have let three hitters go overseas this winter who project as more useful than Pujols (Jefry Marte, Jabari Blash, and the much-maligned Jose Miguel Fernandez).

I wouldn’t be quick to think of Shohei Ohtani’s offensive performance as fluky; in some ways, it’s just a natural power improvement from his previous year in Japan. ZiPS translated Ohtani’s final two seasons in Japan at .289/.356/.485, which looks a lot like his .285/.361/.564 with the Angels, with the power growth you hope to see from a talented young player with relatively few professional at-bats (he’s only at 1536 total now). ZiPS thinks he’ll have a lower average than in 2018, but he’s a real major league hitter.

Pitchers

If the Angels could keep all five of their starting pitchers healthy, the rotation would at least be acceptable. Problem is, essentially the entire rotation has an injury history, and many of its members have an extensive one. What’s frustrating about the Angels is that they have such highs in certain areas, but also several holes they’ve barely made a meaningful effort to go about fixing. ZiPS doesn’t see very high ceilings for any of the pitchers actually on the roster. If any team needed to go after Jake Arrieta last year or Dallas Keuchel this year, it’s the Angels. It would only take a few injuries for the Angels to have to turn to Dillon Peters or JC Ramirez (after he returns), which no contending team should be excited about.

Bench and Prospects

And here is why the Angels will fall short of the ZiPS seasonal simulation of the win total on their depth chart: the team’s plan B’s are absolutely atrocious around the field. The exceptions in the short-term are Jose Suarez and Griffin Canning, though I expect the Angels to give both a consolidation year at Triple-A (Suarez is still very young and Canning still has relatively little professional experience). Let’s put it this way: NRI Jarrett Parker is projected as the team’s fourth-best outfielder.

Things will get better. Jo Adell’s long-term projections are bananas, and the upside projections for Jahmai Jones and Brandon Marsh are at least…an apple? With a Brennon, two Brandons, and a Brendon in the projections, the Angels might as well sign Brennan Boesch to complete the set. The farm system has been steadily improving, but if the Angels want to stop wasting the prime of the best player they have ever had, and possibly will ever have, they really need to do better than dip a toe into free agency while they wait for the prospects to save them.

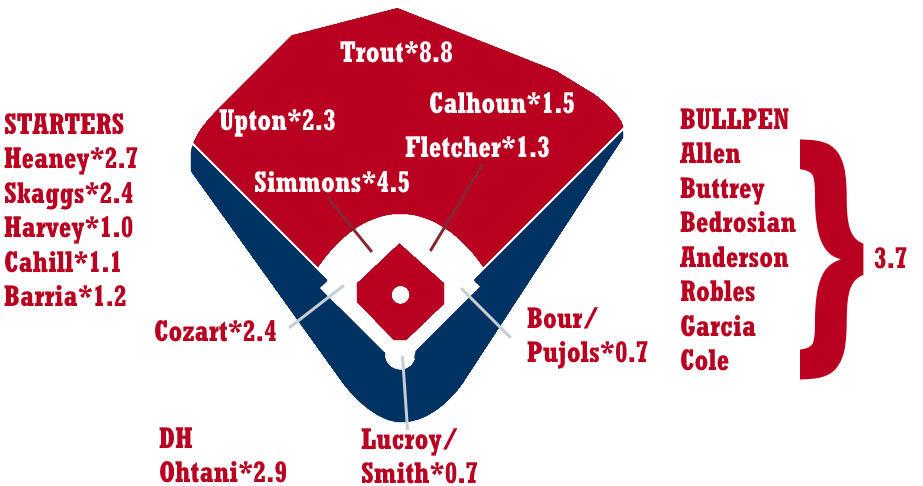
One pedantic note for 2019: for the WAR graphic, I’m using FanGraphs’ depth chart playing time, not the playing time ZiPS spits out, so there will be occasional differences in WAR totals.

Ballpark graphic courtesy Eephus League. Depth charts constructed by way of those listed here at site.

Batters – Counting Stats
Player B Age PO G AB R H 2B 3B HR RBI BB SO SB CS
Mike Trout R 27 CF 145 495 105 144 26 4 38 92 118 134 25 5
Andrelton Simmons R 29 SS 150 561 66 156 28 3 10 66 37 51 11 3
Shohei Ohtani L 24 DH 120 330 56 89 19 1 20 63 37 111 9 3
Justin Upton R 31 LF 141 518 76 122 23 1 28 85 61 180 9 3
Zack Cozart R 33 3B 90 339 48 84 17 3 11 36 31 62 2 1
Jabari Blash R 29 RF 112 352 55 76 16 1 22 59 46 147 5 4
Kole Calhoun L 31 RF 140 520 72 124 22 3 18 68 54 133 5 2
David Fletcher R 25 2B 128 520 57 132 25 4 5 44 25 65 10 3
Justin Bour L 31 1B 120 381 45 90 14 1 21 69 52 113 1 0
Jose Miguel Fernandez L 31 1B 114 416 51 108 19 0 12 47 30 52 2 2
Jonathan Lucroy R 33 C 120 413 43 102 18 2 7 46 32 69 1 0
Luis Rengifo B 22 SS 132 544 66 130 24 7 9 51 46 106 27 16
Jo Adell R 20 CF 99 408 50 89 19 3 16 52 23 140 11 4
Jarrett Parker L 30 LF 85 275 36 58 10 1 13 39 29 116 4 3
Wilfredo Tovar R 27 SS 116 399 40 95 16 1 5 32 22 62 14 7
Jefry Marte R 28 1B 106 319 41 73 15 1 14 45 25 77 4 2
Jose Briceno R 26 C 89 312 31 66 11 1 10 33 14 80 3 2
Zach Houchins R 26 3B 113 434 46 96 17 2 14 52 21 108 2 3
Kevan Smith R 31 C 84 289 30 73 12 0 5 31 15 49 0 0
Ben Revere L 31 LF 90 310 39 82 11 3 3 24 16 31 12 3
Taylor Ward R 25 3B 127 486 58 109 15 0 13 49 49 133 9 1
Ryan Schimpf L 31 2B 101 341 46 69 13 1 17 54 42 152 1 2
Cesar Puello R 28 LF 90 315 41 74 13 1 7 32 28 89 8 4
Dustin Garneau R 31 C 73 246 26 50 11 0 7 27 18 64 0 2
Julian Leon R 23 C 70 243 29 45 9 0 8 27 27 97 0 2
Tommy La Stella L 30 3B 104 195 21 47 9 0 3 19 19 34 0 1
Chris B. Young R 35 RF 75 181 24 38 8 1 7 19 18 50 2 1
Michael Hermosillo R 24 CF 104 382 46 82 16 3 10 38 31 125 11 8
Roberto Pena R 27 C 59 203 17 43 7 0 3 15 8 41 0 1
Peter Bourjos R 32 CF 118 290 33 63 12 5 5 25 16 79 3 4
Matt Thaiss L 24 1B 124 516 59 120 24 4 12 56 40 123 6 5
Albert Pujols R 39 1B 114 455 42 110 16 0 15 69 26 69 1 0
Sherman Johnson L 28 3B 104 363 40 70 15 2 6 31 41 112 7 3
Brennon Lund L 24 CF 106 441 47 100 15 3 6 37 31 126 16 5
Jared Walsh L 25 1B 119 456 53 98 25 1 16 56 34 164 1 1
Jahmai Jones R 21 2B 126 520 60 113 19 5 12 49 43 150 19 8
Eric Young Jr. B 34 CF 122 388 44 83 13 4 5 32 27 94 16 6
Bo Way L 27 CF 100 358 33 79 10 3 1 22 22 78 10 9
Stephen McGee R 28 C 55 170 19 30 7 0 4 15 23 70 0 0
Jose Rojas L 26 1B 110 426 45 96 18 2 11 45 23 112 6 5
Jack Kruger R 24 C 99 405 39 88 15 1 5 30 24 100 7 4
Brandon Marsh L 21 CF 119 499 56 103 19 4 11 49 44 191 10 5
Connor Justus R 24 SS 118 428 44 75 13 2 6 30 44 142 6 7
David MacKinnon R 24 1B 117 423 50 85 17 1 5 33 60 127 0 0
Roberto Baldoquin R 25 SS 81 302 24 60 7 2 2 20 15 92 4 5
Brandon Sandoval R 24 RF 101 383 37 85 10 2 3 24 25 105 14 10
Brendon Sanger L 25 RF 106 379 41 76 15 1 8 35 41 121 4 3


Batters – Rate Stats
Player PA BA OBP SLG OPS+ ISO BABIP RC/27 Def WAR No. 1 Comp
Mike Trout 628 .291 .433 .590 180 .299 .328 10.1 1 8.3 Willie Mays
Andrelton Simmons 608 .278 .325 .392 97 .114 .292 4.9 17 4.2 Luke Appling
Shohei Ohtani 370 .270 .343 .515 133 .245 .347 6.6 0 2.2 Carlos May
Justin Upton 588 .236 .321 .446 109 .210 .303 5.1 1 2.1 Bob Bailey
Zack Cozart 378 .248 .315 .413 99 .165 .274 4.7 3 1.5 Rick Schu
Jabari Blash 407 .216 .317 .455 110 .239 .295 4.9 1 1.5 Karl Pagel
Kole Calhoun 583 .238 .312 .396 94 .158 .287 4.4 5 1.4 Jacque Jones
David Fletcher 556 .254 .293 .346 76 .092 .282 3.8 7 1.2 Alberto Gonzalez
Justin Bour 437 .236 .327 .444 111 .207 .279 5.2 -2 1.1 Paul Sorrento
Jose Miguel Fernandez 453 .260 .316 .392 95 .132 .273 4.5 3 0.7 Jim Bowie
Jonathan Lucroy 455 .247 .304 .351 81 .104 .282 3.9 -2 0.7 Tony Pena
Luis Rengifo 601 .239 .306 .358 83 .119 .282 3.8 -6 0.6 D’Angelo Jimenez
Jo Adell 439 .218 .269 .397 81 .179 .290 3.8 0 0.5 Matt Kemp
Jarrett Parker 308 .211 .292 .396 88 .185 .308 3.9 2 0.4 Damon Mashore
Wilfredo Tovar 427 .238 .280 .321 66 .083 .271 3.2 4 0.3 Alex Prieto
Jefry Marte 351 .229 .293 .414 93 .185 .259 4.3 -1 0.3 Ricky Freeman
Jose Briceno 330 .212 .246 .349 62 .138 .252 2.9 4 0.3 Jim Horner
Zach Houchins 461 .221 .260 .366 71 .145 .263 3.2 5 0.2 Clay Bellinger
Kevan Smith 313 .253 .298 .346 78 .093 .289 3.7 -3 0.2 Joe Azcue
Ben Revere 330 .265 .301 .348 79 .084 .286 4.1 2 0.1 Tike Redman
Taylor Ward 543 .224 .299 .335 76 .111 .282 3.6 -4 0.0 Carlos Villalobos
Ryan Schimpf 391 .202 .297 .396 89 .194 .302 3.9 -9 0.0 Shanie Dugas
Cesar Puello 359 .235 .316 .349 84 .114 .306 3.9 -2 -0.1 Domingo Michel
Dustin Garneau 271 .203 .263 .333 64 .130 .246 2.8 0 -0.1 Chad Moeller
Julian Leon 280 .185 .282 .321 67 .136 .268 2.8 -2 -0.1 Nicholas Derba
Tommy La Stella 217 .241 .313 .333 80 .092 .278 3.6 -4 -0.2 Johnny Burnett
Chris B. Young 203 .210 .287 .381 83 .171 .250 3.7 -2 -0.2 Mike Devereaux
Michael Hermosillo 432 .215 .290 .351 76 .136 .291 3.4 -4 -0.2 Xavier Paul
Roberto Pena 216 .212 .248 .291 49 .079 .252 2.4 3 -0.2 Pedro Grifol
Peter Bourjos 312 .217 .265 .345 67 .128 .282 3.0 1 -0.2 Dewayne Wise
Matt Thaiss 564 .233 .291 .364 80 .132 .283 3.6 2 -0.4 Willie Upshaw
Albert Pujols 486 .242 .284 .376 81 .134 .256 3.8 0 -0.4 Ray Knight
Sherman Johnson 411 .193 .279 .295 59 .102 .261 2.8 0 -0.5 Mike Hickey
Brennon Lund 482 .227 .285 .315 66 .088 .304 3.3 -4 -0.5 Chris Duffy
Jared Walsh 498 .215 .272 .379 78 .164 .297 3.5 1 -0.5 Jay Kirkpatrick
Jahmai Jones 572 .217 .282 .342 72 .125 .282 3.4 -8 -0.6 Desi Relaford
Eric Young Jr. 425 .214 .271 .307 60 .093 .270 3.0 -1 -0.6 Calvin Murray
Bo Way 392 .221 .275 .274 53 .053 .280 2.4 4 -0.7 Anthony Iapoce
Stephen McGee 196 .176 .281 .288 58 .112 .271 2.7 -6 -0.7 Jeff Ontiveros
Jose Rojas 455 .225 .267 .354 70 .129 .281 3.2 4 -0.7 Larry Barnes
Jack Kruger 435 .217 .267 .296 56 .079 .277 2.7 -2 -0.7 Mike Knapp
Brandon Marsh 547 .206 .272 .327 65 .120 .310 3.0 -2 -0.7 Xavier Paul
Connor Justus 487 .175 .267 .257 46 .082 .246 2.1 3 -0.9 Niuman Romero
David MacKinnon 494 .201 .306 .281 65 .080 .275 2.9 -1 -1.1 Dustin Yount
Roberto Baldoquin 324 .199 .242 .255 38 .056 .279 1.9 1 -1.2 Jason Bowers
Brandon Sandoval 413 .222 .272 .282 54 .060 .298 2.5 2 -1.4 Brent Bish
Brendon Sanger 426 .201 .282 .309 64 .108 .272 2.9 -7 -1.7 Alex Miranda


Pitchers – Counting Stats
Player T Age W L ERA G GS IP H ER HR BB SO
Andrew Heaney L 28 10 8 3.95 28 28 161.7 163 71 23 38 148
Tyler Skaggs L 27 8 7 3.94 22 22 112.0 113 49 12 36 100
Jose Suarez L 21 5 5 4.18 26 26 116.3 110 54 16 46 115
Jaime Barria R 22 10 9 4.39 31 31 145.7 151 71 20 46 106
Griffin Canning R 23 8 7 4.33 23 23 114.3 111 55 14 47 99
Shohei Ohtani R 24 6 5 3.79 15 15 78.3 67 33 9 36 94
Cody Allen R 30 5 4 3.50 66 0 64.3 53 25 7 26 74
Trevor Cahill R 31 8 8 4.28 22 22 111.3 108 53 15 47 96
Matt Harvey R 30 7 8 4.56 27 24 132.3 144 67 21 30 101
Ty Buttrey R 26 3 3 3.88 49 2 67.3 61 29 6 32 71
John Lamb L 28 4 4 4.63 19 19 83.7 89 43 13 30 74
Patrick Sandoval L 22 5 6 4.75 24 19 102.3 103 54 16 45 90
Cam Bedrosian R 27 5 5 3.88 67 0 60.3 59 26 7 22 56
Alex Meyer R 29 4 4 4.43 16 11 63.0 59 31 7 34 62
Felix Pena R 29 5 6 4.73 24 22 123.7 129 65 20 45 112
Luis Garcia R 32 3 3 3.81 63 0 56.7 56 24 4 23 51
Dillon Peters L 26 7 9 4.74 24 22 117.7 133 62 16 38 77
Justin Anderson R 26 3 3 4.10 61 0 63.7 57 29 6 38 68
Taylor Cole R 29 3 3 4.19 53 0 73.0 68 34 10 33 73
Noe Ramirez R 29 5 5 4.19 61 0 73.0 68 34 11 28 77
Ivan Pineyro R 27 6 7 4.81 25 19 116.0 128 62 18 31 83
Joe Gatto R 24 6 8 5.00 25 25 113.3 123 63 10 67 67
Matt Ramsey R 29 3 2 4.08 39 1 46.3 44 21 5 20 45
Blake Wood R 33 3 3 3.95 52 0 54.7 53 24 5 24 52
Jim Johnson R 36 4 3 4.03 59 0 58.0 60 26 5 19 44
Hansel Robles R 28 4 4 4.17 63 0 69.0 65 32 9 31 67
Nick Tropeano R 28 5 7 4.98 17 17 86.7 92 48 16 35 74
John Curtiss R 26 3 3 4.30 48 0 60.7 56 29 7 31 60
JC Ramirez R 30 7 9 4.94 22 22 125.7 137 69 20 46 87
Dylan Unsworth R 26 5 7 5.07 22 16 103.0 120 58 18 21 59
Keynan Middleton R 25 2 2 4.24 50 0 51.0 49 24 7 22 51
Jeremy Rhoades R 26 6 7 4.52 52 0 71.7 77 36 10 22 52
Miguel Almonte R 26 3 4 5.25 32 9 58.3 61 34 9 30 49
Junichi Tazawa R 33 2 3 4.94 48 0 47.3 51 26 8 17 40
Deck McGuire R 30 6 8 5.22 31 19 110.3 116 64 20 48 90
Akeel Morris R 26 3 3 4.82 50 0 61.7 60 33 7 38 56
Luis Madero R 22 5 7 5.31 22 22 98.3 114 58 17 32 60
Jesus Castillo R 23 6 9 5.31 23 22 101.7 119 60 17 34 56
Ralston Cash R 27 4 6 4.92 46 0 64.0 64 35 9 36 60
Williams Jerez L 27 2 3 5.06 50 0 69.3 72 39 11 34 64
Zac Ryan R 25 4 5 4.95 40 0 63.7 64 35 6 44 50
Jake Jewell R 26 3 4 5.17 50 0 54.0 59 31 8 28 39
Daniel Procopio R 23 2 2 5.40 37 0 53.3 50 32 6 46 53
Forrest Snow R 30 5 8 5.69 27 17 104.3 119 66 24 35 82
Osmer Morales R 26 4 6 5.82 26 20 102.0 114 66 21 49 80
Luis Pena R 23 6 9 6.03 24 24 109.0 120 73 21 66 88
Ryan Clark R 25 4 7 6.39 39 7 76.0 90 54 18 37 58


Pitchers – Counting Stats
Player TBF K/9 BB/9 HR/9 BABIP ERA+ ERA- FIP WAR No. 1 Comp
Andrew Heaney 682 8.24 2.12 1.28 .300 105 95 4.00 2.5 Mark Redman
Tyler Skaggs 483 8.04 2.89 0.96 .307 106 95 3.88 1.7 Steve Trout
Jose Suarez 503 8.90 3.56 1.24 .294 100 100 4.30 1.5 Bill Pulsipher
Jaime Barria 630 6.55 2.84 1.24 .290 95 105 4.57 1.5 Don Welchel
Griffin Canning 504 7.79 3.70 1.10 .291 96 104 4.53 1.3 Walt Terrell
Shohei Ohtani 335 10.80 4.14 1.03 .299 106 94 3.70 1.2 Kerry Wood
Cody Allen 270 10.35 3.64 0.98 .286 119 84 3.57 1.1 Turk Wendell
Trevor Cahill 489 7.76 3.80 1.21 .288 94 106 4.66 1.1 Bob Buhl
Matt Harvey 566 6.87 2.04 1.43 .301 89 113 4.48 0.9 Josh Towers
Ty Buttrey 294 9.49 4.28 0.80 .302 107 93 3.76 0.8 Clay Bryant
John Lamb 367 7.96 3.23 1.40 .308 90 111 4.58 0.7 Trey Moore
Patrick Sandoval 454 7.92 3.96 1.41 .293 88 114 4.92 0.6 Bill Krueger
Cam Bedrosian 259 8.35 3.28 1.04 .301 107 93 3.95 0.6 Jim Acker
Alex Meyer 281 8.86 4.86 1.00 .297 94 106 4.39 0.6 Chris Oxspring
Felix Pena 542 8.15 3.27 1.46 .304 85 117 4.68 0.6 Dennis Burtt
Luis Garcia 246 8.10 3.65 0.64 .311 106 95 3.54 0.6 Kevin Gryboski
Dillon Peters 521 5.89 2.91 1.22 .305 85 118 4.73 0.5 Jeff Mutis
Justin Anderson 286 9.61 5.37 0.85 .300 102 98 4.22 0.5 Marc Pisciotta
Taylor Cole 320 9.00 4.07 1.23 .291 99 101 4.49 0.5 Ruddy Lugo
Noe Ramirez 315 9.49 3.45 1.36 .294 99 101 4.36 0.4 Jim Dougherty
Ivan Pineyro 505 6.44 2.41 1.40 .301 84 119 4.72 0.4 Steve Lemke
Joe Gatto 528 5.32 5.32 0.79 .300 83 120 5.07 0.4 Rick Berg
Matt Ramsey 202 8.74 3.88 0.97 .300 102 98 4.03 0.4 Gabriel Dehoyos
Blake Wood 239 8.56 3.95 0.82 .308 102 98 3.86 0.4 Roger McDowell
Jim Johnson 251 6.83 2.95 0.78 .304 100 100 3.84 0.4 Fred Gladding
Hansel Robles 301 8.74 4.04 1.17 .293 97 103 4.38 0.3 Ruddy Lugo
Nick Tropeano 384 7.68 3.63 1.66 .297 84 120 5.16 0.3 Mark Thompson
John Curtiss 269 8.90 4.60 1.04 .293 97 103 4.40 0.3 Terry Bross
JC Ramirez 556 6.23 3.29 1.43 .295 82 123 5.08 0.3 Dick Fowler
Dylan Unsworth 447 5.16 1.83 1.57 .297 82 122 5.03 0.3 Daniel Griffin
Keynan Middleton 223 9.00 3.88 1.24 .298 95 105 4.35 0.2 Wayne Nix
Jeremy Rhoades 312 6.53 2.76 1.26 .299 92 109 4.60 0.2 Mike Draper
Miguel Almonte 265 7.56 4.63 1.39 .299 79 126 5.17 -0.1 Regular Bob Gibson
Junichi Tazawa 208 7.61 3.23 1.52 .303 84 119 4.80 -0.1 Jason Childers
Deck McGuire 494 7.34 3.92 1.63 .292 77 129 5.37 -0.1 Michael Smith
Akeel Morris 282 8.17 5.55 1.02 .298 84 119 4.80 -0.2 Heathcliff Slocumb
Luis Madero 439 5.49 2.93 1.56 .299 76 132 5.34 -0.2 Matt O’Brien
Jesus Castillo 456 4.96 3.01 1.50 .297 76 132 5.40 -0.2 Matt O’Brien
Ralston Cash 291 8.44 5.06 1.27 .301 82 122 4.93 -0.2 Ryan Henderson
Williams Jerez 313 8.31 4.41 1.43 .305 82 122 5.01 -0.3 Jimmy Hamilton
Zac Ryan 298 7.07 6.22 0.85 .299 82 123 5.07 -0.3 Lloyd Allen
Jake Jewell 249 6.50 4.67 1.33 .300 81 124 5.41 -0.3 Sean Green
Daniel Procopio 255 8.94 7.76 1.01 .299 75 134 5.38 -0.5 Heathcliff Slocumb
Forrest Snow 465 7.07 3.02 2.07 .299 73 137 5.75 -0.5 Jason Roach
Osmer Morales 467 7.06 4.32 1.85 .299 71 140 5.88 -0.6 Jeff Schmidt
Luis Pena 511 7.27 5.45 1.73 .300 69 145 6.02 -0.9 Joel Santo
Ryan Clark 353 6.87 4.38 2.13 .305 63 159 6.32 -1.3 Phil Dumatrait


Disclaimer: ZiPS projections are computer-based projections of performance. Performances have not been allocated to predicted playing time in the majors — many of the players listed above are unlikely to play in the majors at all in 2019. ZiPS is projecting equivalent production — a .240 ZiPS projection may end up being .280 in AAA or .300 in AA, for example. Whether or not a player will play is one of many non-statistical factors one has to take into account when predicting the future.

Players are listed with their most recent teams, unless I have made a mistake. This is very possible, as a lot of minor-league signings go generally unreported in the offseason.

ZiPS’ projections are based on the American League having a 4.29 ERA and the National League having a 4.15 ERA.

Players who are expected to be out due to injury are still projected. More information is always better than less information, and a computer isn’t the tool that should project the injury status of, for example, a pitcher who has had Tommy John surgery.

Both hitters and pitchers are ranked by projected zWAR — which is to say, WAR values as calculated by me, Dan Szymborski, whose surname is spelled with a z. WAR values might differ slightly from those which appear in full release of ZiPS. Finally, I will advise anyone against — and might karate chop anyone guilty of — merely adding up WAR totals on a depth chart to produce projected team WAR.


Effectively Wild Episode 1331: Season Preview Series: Reds and Athletics

EWFI
In the first installment of the seventh annual Effectively Wild season preview series, Ben Lindbergh and Jeff Sullivan banter about Bryce Harper, Scott Boras, team meetings with free agents, the season preview series, the Super Bowl, and mortality, then preview the 2019 Reds (12:11) with The Athletic’s C. Trent Rosecrans, and the 2019 Athletics (47:46) with the San Francisco Chronicle’s Susan Slusser.

Audio intro: The Sadies, "The Very Beginning"
Audio interstitial 1: Nick Drake, "One of These Things First"
Audio interstitial 2: The Coral, "Don’t Think You’re the First"
Audio outro: Beck, "Seventh Heaven"

Link to evaluation of last year’s preview guest predictions
Link to preorder Susan’s A’s book
Link to preorder The MVP Machine

 iTunes Feed (Please rate and review us!)
 Sponsor Us on Patreon
 Facebook Group
 Effectively Wild Wiki
 Twitter Account
 Get Our Merch!
 Email Us: podcast@fangraphs.com


The Padres’ Most Promising Hitter

There was already plenty to like about what Matt Chapman did as a rookie in 2017. But his introduction to the majors looked all the more encouraging upon further and deeper review. It’s long forgotten now, but Chapman got off to a miserable start. Through the middle of July, he had a wRC+ of 64, to go with nearly 40% strikeouts. The defense was there — the defense was always going to be there — but it was fair to wonder whether Chapman’s bat had what it would take to succeed. It was early, yes, but Chapman had been exposed. He seemed to be overmatched.

And then, in a flash, he turned the tables. The rest of the way, he carried a wRC+ of 120, and he trimmed his strikeouts all the way to 26%. The way Chapman finished set him up for a breakout and breakthrough 2018, with a 137 wRC+ and a superstar WAR. The strikeout issues were nowhere to be found. Not that Chapman exactly qualifies as a traditional contact hitter, but he makes enough contact to tap consistently into his power. Chapman put the rough intro behind him, and he hasn’t looked back.

With Chapman in mind, allow me to shift the conversation toward Franmil Reyes. Unlike Chapman, Reyes is never going to win a Platinum Glove. If he’s going to have a career, it’ll have to be a career in which he hits. But the good news is that he just made a strong impression. Like Chapman the season before, Reyes just used the final two months to set himself up for a dazzling campaign.

Read the rest of this entry »


Harper or Machado Megadeal Would Be out of Character for Chisox

With most of the game’s top-spending teams apparently determined to remain on the sidelines instead of wooing either Bryce Harper or Manny Machado, the White Sox have been conspicuous in their reported pursuit of both. That’s a surprise, given both the team’s recent lack of success and their historical avoidance of big contracts, but late last month, general manager Rick Hahn acknowledged that fans would likely be disappointed if they didn’t land one of the winter’s big fish.

Given that the White Sox haven’t finished above .500 since 2012, and that last year, their second year of a long-term rebuilding program, they lost 100 games — their highest total since 1970 — it might seem like an odd time to spend big money. Then again, at a time when so many teams appear to have lost their checkbooks, if Chicago’s desire to spend is sincere, they may be tapping into a market inefficiency. Considering their history under owner Jerry Reinsdorf, however, it’s fair to be skeptical until the ink is dry on a contract for either Harper or Machado.

For starters, note that of the 30 teams, only five have yet to sign a player to either an extension or a free agent deal worth more than $72 million:

Largest Contracts in Team History
Team Player Years $ Type Signed
Indians Edwin Encarnacion 3 $60.0 FA 1/5/17
Pirates Jason Kendall 6 $60.0 Ext 11/18/00
Athletics Eric Chavez 6 $66.0 Ext 3/18/04
White Sox Jose Abreu 6 $68.0 FA 10/29/13
Royals Alex Gordon 4 $72.0 FA 1/6/16
Rays Evan Longoria 6 $100.0 Ext 11/26/12
Brewers Ryan Braun 5 $105.0 Ext 4/21/11
Cardinals Matt Holliday 7 $120.0 FA 1/7/10
Blue Jays Vernon Wells 7 $126.0 Ext 12/18/06
Braves Freddie Freeman 8 $135.0 Ext 2/4/14
Mets David Wright 8 $138.0 Ext 12/4/12
Padres Eric Hosmer 8 $144.0 FA 2/19/18
Phillies Cole Hamels 6 $144.0 Ext 7/25/12
Rockies Troy Tulowitzki 10 $157.8 Ext 11/30/10
Orioles Chris Davis 7 $161.0 FA 1/21/16
Astros Jose Altuve 7 $163.5 Ext 3/19/18
Giants Buster Posey 9 $167.0 Ext 3/29/13
Cubs Jason Heyward 8 $184.0 FA 12/15/15
Twins Joe Mauer 8 $184.0 Ext 3/21/10
Diamondbacks Zack Greinke 6 $206.5 FA 12/9/15
Nationals Max Scherzer 7 $210.0 FA 1/21/15
Dodgers Clayton Kershaw 7 $215.0 Ext 1/17/14
Red Sox David Price 7 $217.0 FA 12/4/15
Reds Joey Votto 10 $225.0 Ext 4/2/12
Angels Albert Pujols 10 $240.0 FA 12/8/11
Mariners Robinson Cano 10 $240.0 FA 12/12/13
Tigers Miguel Cabrera 8 $248.0 Ext 3/31/14
Rangers Alex Rodriguez 10 $252.0 FA 12/12/00
Yankees Alex Rodriguez 10 $275.0 FA 12/13/07
Marlins Giancarlo Stanton 13 $325.0 Ext 11/18/14
SOURCE: https://www.mlbtraderumors.com/2015/10/mlb-team-largest-contract.html
Revised from a 2015 MLB Trade Rumors list. All dollar figures in millions. Signing dates via MLB Trade Rumors, Cot’s Contracts, or Baseball-Reference. FA = free agent, Ext = extension.

Read the rest of this entry »


2019 ZiPS Projections – Pittsburgh Pirates

After having typically appeared in the hallowed pages of Baseball Think Factory, Dan Szymborski’s ZiPS projections have now been released at FanGraphs for more than half a decade. The exercise continues this offseason. Below are the projections for the Pittsburgh Pirates.

Batters

The depth chart graphic for the Pirates (as seen below) pulls off a neat little trick. In this case, it manages to highlight both the strengths and weaknesses of the Pirates in one bite-sized scoop. Pittsburgh is excellent at finding just below average to average talent for peanuts, and average or better talent for whatever is a little bit better than that (perhaps Chex Mix?). It keeps the Pirates from ever truly returning to the Kingdom of Reekdom they reigned over from 1993 to about 2010. Having a roster Ryanfull of free one-win players, two-win players who are paid like one-win players, and three-win players who are paid like two-win players means you have a highly efficient roster. But it’s a highly efficient roster that will generally win between 77-85 games.

What the Pirates missed in their best days, and largely are missing today, was the willingness to add stars. The low payrolls of the rebuilding era never really gave way to short-term payroll ceilings well above the team’s long-term comfort levels. Everyone who has read me over the last five years knows I’m not a Royals apologist, but Kansas City did do this one thing much better than the Pirates did, even if the players Kansas City chose weren’t exactly my favorite. Chris Archer has star upside, but the Pirates had to trade players with star potential to bring him in. If the small market model doesn’t have a path to league-average payrolls, it necessitates an immense amount of success on the player development side. Sometimes, you just need to spend money instead of prospects.

There aren’t a lot of surprises in the hitting projections, but it is a very deep group. ZiPS has an amusing tendency with Pittsburgh to pick unnecessarily cruel, Pirates-related comps. Jung Ho Kang and Kevin Kramer are projected to be able to replace any injured Pirates infielders without the team losing a beat, and ZiPS remains a fan of Starling Marte over the long haul. This team may have the smallest gap between their ideal starting lineup and a starting lineup comprised of their Plan B’s of any team in baseball.

Pitchers

ZiPS is still optimistic about Chris Archer, but it’s now at the point where it expects him to fall short of his projected FIP. He’s only underperformed by 0.22 runs of ERA over his career, but ZiPS believes that given his defenses, he should have been over-performing his FIP, not falling short of it. The projections are increasingly optimistic about Trevor Williams, believing that he’ll continue to do better with home runs than most pitchers do with his hit profile. But it’s understandably not buying his .261 BABIP allowed in 2018 as near his actual ability.

Of the low-key reliever breakouts from 2018, ZiPS is a believer in Richard Rodriguez, a skeptic about Edgar Santana, and on the fence about ex-Giant Kyle Crick. The computer still does not understand why Michael Feliz isn’t much better at preventing the other team from scoring than his results to date have been.

Bench and Prospects

ZiPS uses a Total Zone-esque approach for minor-league defense, and it continues to back up the scouting reports for Ke’Bryan Hayes that rave about his defense. It doesn’t show up in the projections yet, but ZiPS sees a strong probability that Cole Tucker develops into a 10-12 home run hitter just as Royce Clayton, his top comp, did for awhile. Ryne Sandberg and Eric Young, Classic Edition, round out his top three. No, he doesn’t actually have a one-in-three chance of becoming a Hall of Famer. As sleepers go, the favorite of ZiPS may be Dario Agrazal, a well-built righty with a hard sinker but no real pitch that puts away batters (strikeouts are better than grounders). He’s not really on the prospect radar — the Pirates would not have snuck him off the 40-man roster if he were — but he does interest ZiPS and remains worth keeping an eye on. Groundball pitchers with hard sinkers who don’t strike guys out sometimes work out surprisingly well.

One pedantic note for 2019: for the WAR graphic, I’m using FanGraphs’ depth chart playing time, not the playing time ZiPS spits out, so there will be occasional differences in WAR totals.

Ballpark graphic courtesy Eephus League. Depth charts constructed by way of those listed here at site.

Batters – Counting Stats
Player B Age PO G AB R H 2B 3B HR RBI BB SO SB CS
Starling Marte R 30 CF 136 524 73 144 28 4 15 64 28 105 31 12
Corey Dickerson L 30 LF 141 522 65 148 36 5 18 61 26 100 5 3
Gregory Polanco L 27 RF 132 479 71 123 30 4 19 73 53 114 14 4
Adam Frazier L 27 2B 139 449 61 123 26 5 8 50 38 71 6 7
Jung Ho Kang R 32 3B 99 328 43 82 17 1 13 48 30 89 3 3
Josh Bell B 26 1B 150 525 74 138 28 5 17 76 71 107 3 5
Ke’Bryan Hayes R 22 3B 121 469 55 114 22 6 5 44 45 102 12 5
Colin Moran L 26 3B 126 429 52 113 20 2 13 59 36 98 0 2
Francisco Cervelli R 33 C 98 321 38 81 13 2 7 42 44 80 2 3
Kevin Newman R 25 SS 130 518 59 135 28 3 4 45 32 73 16 6
Kevin Kramer L 25 2B 131 485 58 119 25 4 10 54 36 130 9 5
Jose Osuna R 26 3B 137 431 56 111 31 2 12 58 29 87 3 3
Elias Diaz R 28 C 91 302 33 77 15 1 7 36 20 53 1 1
Cole Tucker B 22 SS 130 523 61 121 21 8 6 47 47 128 29 13
Josh Harrison R 31 2B 116 424 52 111 21 2 8 44 21 80 7 3
Lonnie Chisenhall L 30 RF 97 303 36 81 19 2 8 42 24 58 4 1
Jacob Stallings R 29 C 79 277 29 66 18 1 3 32 15 60 1 2
Jason Martin L 23 CF 130 490 59 120 25 6 13 56 38 130 10 11
Pablo Reyes R 25 LF 126 443 52 109 22 3 9 47 35 92 12 9
Erik Gonzalez R 27 2B 118 346 40 86 17 2 7 34 12 92 8 4
Arden Pabst R 24 C 67 238 24 54 10 1 5 23 13 56 1 2
Bryan Reynolds B 24 CF 99 390 47 89 18 4 8 42 32 106 3 2
Sean Rodriguez R 34 2B 97 211 28 42 8 1 8 25 23 79 2 1
Jared Oliva R 23 CF 106 409 47 91 16 5 5 36 30 112 21 9
Patrick Kivlehan R 29 RF 125 390 47 93 20 3 13 50 26 108 5 3
Wyatt Mathisen R 25 1B 99 322 38 75 15 2 7 34 31 83 2 2
Erich Weiss L 27 1B 102 348 38 80 17 4 6 36 27 92 4 2
Stephen Alemais R 24 2B 107 382 40 89 15 4 3 31 31 80 12 9
Will Craig R 24 1B 124 467 54 101 23 2 12 55 41 143 4 3
Steve Baron R 28 C 60 204 19 44 7 0 2 14 13 55 1 1
Daniel Nava B 36 LF 60 154 15 37 6 0 2 14 16 34 1 0
Christian Kelley R 25 C 90 320 31 68 11 1 4 26 24 84 0 3
Jackson Williams R 33 C 52 178 16 35 5 0 2 11 14 44 0 0
Jason Delay R 24 C 63 218 20 41 5 1 1 13 16 57 1 0
Eric Wood R 26 RF 106 361 45 80 19 3 11 48 31 111 5 2
JB Shuck L 32 LF 119 334 34 80 16 3 3 25 26 43 7 3
Logan Hill R 26 LF 106 381 43 76 14 2 13 46 34 151 3 4

Batters – Rate Stats
Player PA BA OBP SLG OPS+ ISO BABIP RC/27 Def WAR No. 1 Comp
Starling Marte 552 .275 .326 .429 102 .155 .319 5.4 5 3.2 Bake McBride
Corey Dickerson 548 .284 .320 .475 111 .192 .322 5.7 5 2.8 Garret Anderson
Gregory Polanco 532 .257 .331 .455 109 .198 .301 5.6 3 2.5 Troy O’Leary
Adam Frazier 487 .274 .335 .408 100 .134 .311 4.9 2 2.2 Joe Randa
Jung Ho Kang 358 .250 .332 .427 103 .177 .305 5.0 1 1.9 Steve Buechele
Josh Bell 596 .263 .349 .432 110 .170 .302 5.4 -3 1.8 Sid Bream
Ke’Bryan Hayes 514 .243 .311 .348 78 .104 .301 3.9 9 1.8 D’Angelo Jimenez
Colin Moran 465 .263 .321 .410 96 .147 .314 4.7 1 1.7 Scott Cooper
Francisco Cervelli 365 .252 .357 .371 97 .118 .316 4.6 -3 1.6 Al Lopez
Kevin Newman 550 .261 .307 .349 77 .089 .297 4.0 4 1.5 Freddy Sanchez
Kevin Kramer 521 .245 .303 .375 82 .130 .316 4.0 2 1.3 Ty Wigginton
Jose Osuna 460 .258 .306 .422 94 .165 .298 4.6 -3 1.2 Jeffrey Baisley
Elias Diaz 322 .255 .302 .381 83 .126 .289 4.1 1 1.1 Sandy Alomar
Cole Tucker 570 .231 .298 .337 71 .105 .296 3.6 3 1.1 Royce Clayton
Josh Harrison 445 .262 .309 .377 84 .116 .307 4.3 -1 1.0 Manny Trillo
Lonnie Chisenhall 327 .267 .324 .422 100 .155 .308 5.1 -1 0.9 Mike Brown
Jacob Stallings 292 .238 .282 .343 68 .105 .294 3.3 5 0.7 Mike DiFelice
Jason Martin 528 .245 .299 .400 87 .155 .308 4.0 -4 0.7 Daryl Boston
Pablo Reyes 478 .246 .302 .370 81 .124 .292 3.9 6 0.7 Reed Peters
Erik Gonzalez 358 .249 .277 .370 73 .121 .320 3.7 2 0.4 Pat Meares
Arden Pabst 251 .227 .268 .340 63 .113 .277 3.0 4 0.4 Joe Depastino
Bryan Reynolds 422 .228 .289 .356 73 .128 .293 3.6 0 0.3 Craig Cooper
Sean Rodriguez 234 .199 .289 .360 74 .161 .274 3.5 0 0.3 Dave Matranga
Jared Oliva 439 .222 .285 .323 64 .100 .295 3.3 3 0.2 Maiko Loyola
Patrick Kivlehan 416 .238 .293 .405 86 .167 .297 4.2 -3 0.2 Keith Williams
Wyatt Mathisen 353 .233 .311 .357 80 .124 .293 3.8 1 0.2 Chris Pritchett
Erich Weiss 375 .230 .289 .353 73 .124 .296 3.6 4 0.1 Johan Limonta
Stephen Alemais 413 .233 .291 .317 64 .084 .288 3.1 2 0.0 Brett Harrison
Will Craig 508 .216 .293 .351 73 .135 .285 3.5 3 -0.2 Julio Vinas
Steve Baron 217 .216 .269 .279 49 .064 .286 2.5 1 -0.2 Scott Sandusky
Daniel Nava 170 .240 .324 .318 75 .078 .297 3.7 -4 -0.4 Brian Jordan
Christian Kelley 344 .213 .278 .291 54 .078 .276 2.6 -1 -0.4 Jose Molina
Jackson Williams 192 .197 .258 .258 40 .062 .250 2.2 0 -0.4 Chad Moeller
Jason Delay 234 .188 .261 .234 36 .046 .250 2.1 1 -0.5 Brian Moon
Eric Wood 392 .222 .286 .382 79 .161 .289 3.8 -5 -0.5 Edgardo Baez
JB Shuck 360 .240 .294 .332 69 .093 .267 3.5 -6 -1.1 Doug Dascenzo
Logan Hill 415 .199 .275 .349 67 .150 .290 3.1 -5 -1.1 Jim Betzsold

Pitchers – Counting Stats
Player T Age W L ERA G GS IP H ER HR BB SO
Jameson Taillon R 27 11 9 3.53 30 30 173.3 168 68 21 33 154
Chris Archer R 30 10 8 3.72 30 30 169.3 162 70 19 53 185
Trevor Williams R 27 11 10 4.06 28 28 155.3 153 70 16 53 116
Joe Musgrove R 26 9 8 4.05 26 21 126.7 131 57 17 24 108
Felipe Vazquez L 27 4 2 2.89 71 0 71.7 58 23 5 26 88
Keone Kela R 26 5 3 2.82 54 0 51.0 38 16 4 19 67
Richard Rodriguez R 29 4 3 3.53 56 0 71.3 64 28 8 22 80
Chad Kuhl R 26 7 7 4.39 23 23 119.0 121 58 14 52 109
Mitch Keller R 23 7 8 4.59 25 25 129.3 132 66 16 59 104
Dario Agrazal R 24 5 6 4.45 18 17 91.0 106 45 12 17 49
Kyle Crick R 26 3 3 3.73 66 0 60.3 52 25 5 34 63
Steven Brault L 27 5 6 4.53 39 13 107.3 108 54 12 57 93
Blake Weiman L 23 3 3 3.84 38 0 61.0 63 26 7 11 49
Clay Holmes R 26 7 8 4.68 31 22 117.3 118 61 12 67 98
Michael Feliz R 26 3 3 4.22 56 0 59.7 56 28 8 26 70
Roberto Gomez R 29 4 5 4.76 32 9 75.7 82 40 10 28 57
Tyler Lyons L 31 2 2 4.22 44 0 53.3 52 25 8 17 54
Jordan Lyles R 28 4 5 4.72 39 11 93.3 99 49 13 31 75
Aaron Slegers R 26 7 9 5.11 22 21 116.3 133 66 19 32 69
Nick Kingham R 27 7 10 4.95 27 25 123.7 135 68 22 38 97
Brandon Waddell L 25 7 9 4.94 26 22 116.7 125 64 12 61 82
Geoff Hartlieb R 25 5 5 4.50 45 0 56.0 57 28 6 28 45
James Marvel R 25 7 10 5.17 25 24 134.0 154 77 17 52 76
Johnny Hellweg R 30 1 1 4.18 24 0 23.7 22 11 1 17 20
J.T. Brubaker R 25 6 9 5.02 26 26 132.7 148 74 19 54 96
Nick Burdi R 26 1 1 4.40 14 0 14.3 14 7 2 9 14
Edgar Santana R 27 3 3 4.55 62 0 65.3 69 33 10 18 54
Damien Magnifico R 28 3 4 4.82 45 3 61.7 59 33 4 49 51
Cam Vieaux L 25 7 10 5.34 23 23 121.3 141 72 19 45 76
Bo Schultz R 33 1 1 4.85 35 0 39.0 40 21 5 17 27
Brandon Maurer R 28 4 4 4.76 60 0 58.7 60 31 7 29 51
Scooter Hightower R 25 4 5 4.76 63 0 64.3 70 34 10 19 49
Eduardo Vera R 24 7 9 5.19 27 25 137.0 163 79 23 35 76
Dovydas Neverauskas R 26 2 3 4.92 59 0 67.7 66 37 9 40 67
Alex McRae R 26 6 9 5.28 27 21 124.3 145 73 17 52 79
Vicente Campos R 26 3 5 5.70 17 12 66.3 77 42 12 35 43
Luis Escobar R 23 6 10 5.64 24 23 113.3 119 71 15 80 90
Matt Eckelman R 25 3 5 5.96 37 2 51.3 58 34 9 29 37
Elvis Escobar L 24 2 4 5.93 37 0 54.7 55 36 7 50 51
Jesus Liranzo R 24 2 4 6.71 40 3 53.7 56 40 13 46 57


Pitchers – Rate Stats
Player TBF K/9 BB/9 HR/9 BABIP ERA+ ERA- FIP WAR No. 1 Comp
Jameson Taillon 715 8.00 1.71 1.09 .293 113 89 3.62 3.1 Brad Radke
Chris Archer 716 9.83 2.82 1.01 .314 110 91 3.43 3.0 Kevin Millwood
Trevor Williams 668 6.72 3.07 0.93 .288 98 102 4.17 1.8 John Denny
Joe Musgrove 533 7.67 1.71 1.21 .302 101 99 3.92 1.7 Dave Eiland
Felipe Vazquez 299 11.05 3.27 0.63 .301 138 73 2.86 1.6 Al Hrabosky
Keone Kela 208 11.82 3.35 0.71 .291 145 69 2.72 1.2 Troy Percival
Richard Rodriguez 299 10.09 2.78 1.01 .303 116 86 3.46 0.9 Rich Bordi
Chad Kuhl 527 8.24 3.93 1.06 .308 91 110 4.28 0.9 Todd Eggertsen
Mitch Keller 576 7.24 4.11 1.11 .297 87 115 4.68 0.7 Jim Clancy
Dario Agrazal 392 4.85 1.68 1.19 .303 89 112 4.48 0.7 Rick Wise
Kyle Crick 267 9.40 5.07 0.75 .292 107 94 4.03 0.6 Mark Acre
Steven Brault 486 7.80 4.78 1.01 .303 88 114 4.66 0.5 Brad Weis
Blake Weiman 255 7.23 1.62 1.03 .303 104 96 3.72 0.5 Chris Key
Clay Holmes 534 7.52 5.14 0.92 .302 85 118 4.68 0.5 Mike Torrez
Michael Feliz 259 10.56 3.92 1.21 .314 97 103 3.95 0.3 Glenn Dooner
Roberto Gomez 335 6.78 3.33 1.19 .305 86 116 4.63 0.3 Jeff Farnsworth
Tyler Lyons 228 9.11 2.87 1.35 .301 94 106 4.20 0.2 Brian Shouse
Jordan Lyles 408 7.23 2.99 1.25 .303 84 119 4.51 0.2 Bert Bradley
Aaron Slegers 510 5.34 2.48 1.47 .297 80 124 5.07 0.2 Dave Eiland
Nick Kingham 542 7.06 2.77 1.60 .299 80 124 4.99 0.2 Jared Gothreaux
Brandon Waddell 533 6.33 4.71 0.93 .304 81 124 4.80 0.2 Greg Kubes
Geoff Hartlieb 253 7.23 4.50 0.96 .300 91 110 4.65 0.1 Joe Davenport
James Marvel 605 5.10 3.49 1.14 .303 79 126 5.01 0.1 Jake Joseph
Johnny Hellweg 109 7.61 6.46 0.38 .300 95 105 4.29 0.1 Ted Abernathy
J.T. Brubaker 598 6.51 3.66 1.29 .306 79 126 4.97 0.1 Jake Joseph
Nick Burdi 66 8.79 5.65 1.26 .300 93 107 5.10 0.0 Jeff Smith
Edgar Santana 282 7.44 2.48 1.38 .301 88 114 4.50 0.0 Jeff Tam
Damien Magnifico 292 7.44 7.15 0.58 .299 83 121 4.92 -0.1 Hal Reniff
Cam Vieaux 547 5.64 3.34 1.41 .305 77 130 5.22 -0.1 Jason Cromer
Bo Schultz 172 6.23 3.92 1.15 .287 82 122 4.82 -0.1 Milo Candini
Brandon Maurer 263 7.82 4.45 1.07 .305 84 120 4.55 -0.2 Jose Segura
Scooter Hightower 281 6.85 2.66 1.40 .302 84 120 4.72 -0.2 Ken Clay
Eduardo Vera 606 4.99 2.30 1.51 .302 77 130 5.16 -0.2 Heath Totten
Dovydas Neverauskas 307 8.91 5.32 1.20 .303 81 124 4.81 -0.3 Heathcliff Slocumb
Alex McRae 568 5.72 3.76 1.23 .311 75 133 5.10 -0.3 Matt Achilles
Vicente Campos 309 5.83 4.75 1.63 .301 72 139 5.92 -0.4 Kevin Hodges
Luis Escobar 538 7.15 6.35 1.19 .301 71 142 5.59 -0.7 Edwin Morel
Matt Eckelman 240 6.49 5.08 1.58 .302 67 150 5.86 -0.8 Sean Green
Elvis Escobar 269 8.40 8.23 1.15 .306 67 149 5.91 -0.9 Steve Rosenberg
Jesus Liranzo 262 9.56 7.71 2.18 .301 59 169 6.91 -1.3 Wilson Guzman


Disclaimer: ZiPS projections are computer-based projections of performance. Performances have not been allocated to predicted playing time in the majors — many of the players listed above are unlikely to play in the majors at all in 2019. ZiPS is projecting equivalent production — a .240 ZiPS projection may end up being .280 in AAA or .300 in AA, for example. Whether or not a player will play is one of many non-statistical factors one has to take into account when predicting the future.

Players are listed with their most recent teams, unless I have made a mistake. This is very possible, as a lot of minor-league signings go generally unreported in the offseason.

ZiPS’ projections are based on the American League having a 4.29 ERA and the National League having a 4.15 ERA.

Players who are expected to be out due to injury are still projected. More information is always better than less information, and a computer isn’t the tool that should project the injury status of, for example, a pitcher who has had Tommy John surgery.

Both hitters and pitchers are ranked by projected zWAR — which is to say, WAR values as calculated by me, Dan Szymborski, whose surname is spelled with a z. WAR values might differ slightly from those which appear in full release of ZiPS. Finally, I will advise anyone against — and might karate chop anyone guilty of — merely adding up WAR totals on a depth chart to produce projected team WAR.