Ben Lindbergh and Meg Rowley banter about a Shohei Ohtani survey, early WBC action, Andrew McCutchen’s new team, Payton Tolle’s triple-digits t-shirt, ABS-driven changes to Alex Bregman’s and Bo Naylor’s listed heights, wonky player cards, why teams start spring training days so early, Dodgers pitching problems, and the prevalence of inventive slides, then preview the 2026 Seattle Mariners (50:22) with The Seattle Times’Ryan Divish, and the 2026 Miami Marlins (1:34:43) with MLB.com’s Christina De Nicola, plus a few postscript updates (2:17:42).
Thomas Cordy, Palm Beach Post/USA Today Network via Imagn Images
The World Baseball Classic is officially back! We’re been running preview content for the last several weeks, but now that the tournament is actually underway, you’ve got to pick a team to root for. You may even want to pick one team from each of the four pools. To help you decide on your favorite, I’ll be offering a reason to cheer for each of the 20 teams in the field. We started with Pool C earlier today, and we’ll run Pools A and B tomorrow.
Dominican Republic
Listing teams alphabetically has us starting with the powerhouse of the group. How’s this for a lineup?
This isn’t just a lineup without any weak spots. It’s a dream team, and it still leaves stars like Jeremy Peña and Oneil Cruz on the bench!
The real reason to root for the Dominican Republic, though, is that they’ll be out for revenge. They won the 2013 WBC, but in 2023, losses to Venezuela and Puerto Rico left them 2-2 in pool play, and the run differential tiebreaker kept them from advancing. The Dominican Republic didn’t even make it out of pool play! Manager Rodney Linares heard about it in a big way. Albert Pujols is at the helm now, and he knows he’s got to do better.
Pool D is a bit softer this time around, with the Netherlands taking the place of Puerto Rico, but the this team might not care. They’re out for blood, and it’s not hard to envision them going scorched earth and running up the run differential as much as they can. With that lineup, they’ll have more than enough firepower. They just hung 12 runs on the Tigers on Tuesday. If what you’re looking for in a WBC team is a high likelihood that watching them play will feel similar to watching a Rambo movie, then the Dominican Republic is your squad.
Israel
Look, I don’t know if we’re going to see Robert Stock pitch, or how much he’ll throw even if we do, but he’s the kind of guy you cheer for. I wrote an article about his journey last year, but it’s worth digging even deeper, because it really puts the “World” in “World Baseball Classic.” No less an authority than Baseball America named Stock the best 13-year-old player in the country in 2003, the best 14-year-old player in 2004, and then the overall Youth Player of the Year in 2005. “The 6-foot, 180-pound 15-year-old was tossing 90-mph fastballs by the time he was 14 and has been known to connect on 400-foot home runs, using a wood bat,” wrote Alan Matthews. Stock enrolled at USC as both a catcher and a pitcher so that he could become draft eligible when he was 19.
The Cardinals took him in the second round in 2009, but things were a lot harder in the pros. After three years of trying to make it as a catcher, Stock switched back to pitching. After three more years, Stock still hadn’t advanced to Double-A, and the Cardinals released him. He bounced to the Astros, then the Pirates, then the Reds, and finally to the Padres, who finally promoted him to the big leagues in 2018. Still armed with an upper-90s fastball as a 28-year-old rookie, Stock made the most of the chance. He ran a 2.50 ERA and 2.71 FIP across 32 appearances and 39 2/3 innings.
The success was fleeting. Stock struggled in 2019 and kept bouncing, to the Phillies, the Red Sox, the Cubs, and the Mets. In 2022, he landed with the Doosan Bears of the KBO as a starter, running a 3.60 ERA and earning another shot despite running a 11.5% walk rate. He went to Driveline, started 2023 pitching for Israel in the WBC and reported to Triple-A Nashville on a minor league deal with the Brewers, but after just three starts, Milwaukee let him go. He finished the season with the Long Island Ducks of the independent Atlantic League.
Stock threw a no-hitter in Long Island, but his overall numbers weren’t great. He spent 2024 pitching for Tecolotes de los Dos Laredos of the Mexican League, but before he did, he completely overhauled his mechanics. He dropped his arm angle from right around the league average to a sidearm slot. He went from throwing the four-seamer more than half the time to being an east-west sinker-slider guy with 40 inches of break differential between the two pitches. He was an entirely new pitcher. He went 9-4 with a 3.39 ERA with Dos Laredos, and then the won the pitching Triple Crown in the Mexican Winter League, going 10-2 with a 1.60 ERA.
Stock returned to the Red Sox in 2025, putting up solid numbers in Triple-A but struggling in two big league appearances. He’s now in minor league camp with the Mets, where he’s struck out six batters and allowed just one baserunner across three scoreless innings. Stock is now 36 years old with just 75 1/3 major league innings under his belt but a whole lot of miles.
Netherlands
The Netherlands boast a lot of familiar Curaçaoan faces. They’ll have stars like Ozzie Albies, Xander Bogaerts, and Kenley Jansen. They’ll have old friend Didi Gregorius, the only Didi in major league history, who last appeared in the majors in 2022 and has been playing in the Mexican League. They’ll even have brothers of familiar faces in Jeremi Profar and Sharlon Schoop. But Ceddanne Rafaela is the wild card here.
Fresh off a Gold Glove, Boston’s center fielder already has two home runs and a 224 wRC+ in spring training and – you know what? I’m going to have to stop there. I love to watch Rafaela play. He’s exciting in ways both good and bad. He makes you scream when he does something spectacular with his glove, and he makes you scream when he waves at yet another slider in the dirt. But Kiri Oler already nailed the thing that should make us root for the Netherlands in her Pool D preview. It’s this song, “Honkbal Hoofdklasse (On My Radio Tonight)” by Johannes Vonk and the Clogheads, which I listened to on repeat as I wrote this section:
Just to be clear, Johannes Vonk and the Clogheads are not an actual band. This song was recorded in 2020 by Milo Edwards and Nate Bethea of the comedy podcast “Trashfuture,” and jokingly attributed to the fictional 80s band with the 80-grade name. I don’t know much about Trashfuture, but this song is perfect, and after listening to it 10 times in a row, I am ready to run through a brick wall (or even a dam) for the Netherlands and their merry band of honkbalers.
Nicaragua
Nicaragua went winless in 2023, and if the team is going to win a game this time around, it will be on the shoulders of New York Met Mark Vientos. Along with Carlos Rodriguez of the Brewers, he’s one of two current major leaguers on the Nicaraguan roster (free agent Erasmo Ramírez is also suiting up), and although he struggled to a 97 wRC+ in 2025, it’s hard to get the image of his three-win 2024 season, in which he ran a 132 wRC+ and blasted 27 homers in just 111 games, out of your mind. After five spring training games, Vientos somehow has an average exit velocity of 96 mph (!) and a batting average of .077 (?!). He has a 110-mph lineout, a 109.9-mph double play, a 105.2-mph fly out, and then another double play at 104.7 mph. Playing against the Mets in an exhibition game on Tuesday, Vientos did finally get a ball to touch grass, ripping a 108-mph single.
The only logical(ish) conclusion I can draw is that Vientos has been saving all of his luck for team Nicaragua. He’s planning on running a BABIP of .850 in the WBC, blooping and blasting his country past the rest of Pool D and into the knockout round, relying on the wisdom of manager Dusty Baker to hit ‘em where they ain’t.
If you’re a Yankees or Phillies fan and you don’t feel comfortable rooting for a Met, maybe you can root for Jeter Downs, who is still not Mookie Betts, but is thriving with the Softbank Hawks of the NPB, running a 123 wRC+ in 2025.
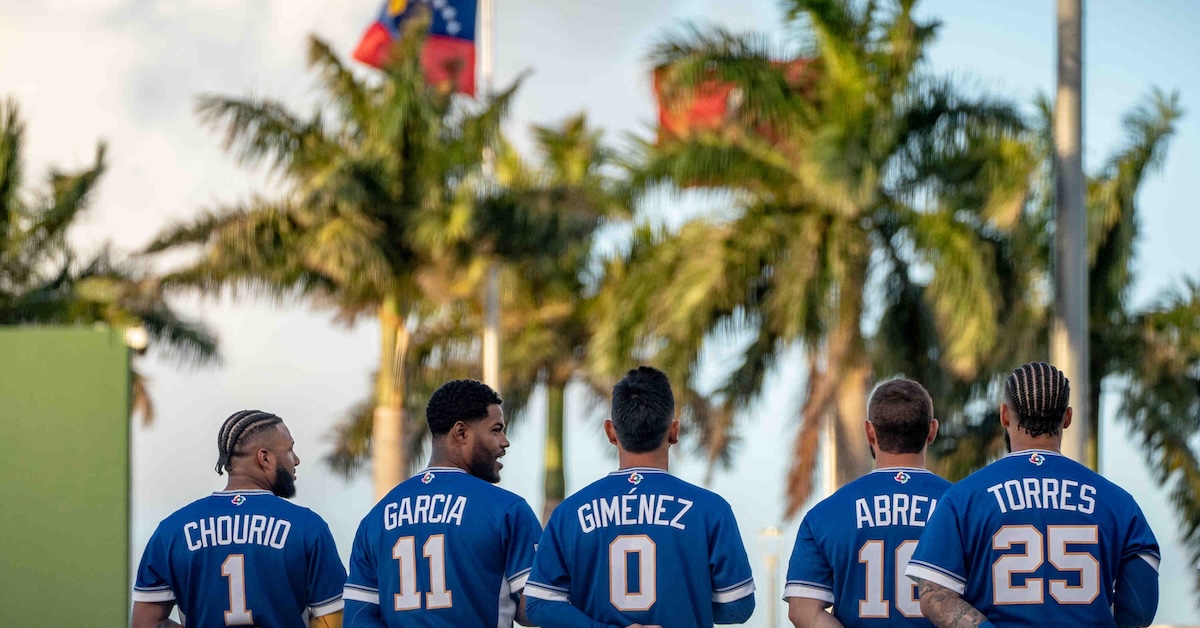
Venezuela
I’m not telling you anything you don’t know here, but Venezuela’s lineup is extremely good. They’ve got Ronald Acuña Jr., Jackson Chourio, and Wilyer Abreu in the outfield. They’ve got Willson Contreras, Luis Arraez, Eugenio Suárez, Maikel Garcia, and Andrés Giménez on the infield. They’ve got William Contreras and Salvador Perez behind the plate. That’s a lot of great bats and great gloves. Garcia and Abreu both won Gold Gloves in 2025, and Giménez is a three-time winner who took home the Platinum Glove in 2024. Honestly, maybe the exciting thing should be the glovework. But what I’m most excited about is the bullpen.
Venezuela doesn’t have much starting pitching depth behind Ranger Suarez, but pitching in the WBC is an all-hands-on-deck enterprise, and Venezuela has a whole lot of big arms to choose from. Daniel Palencia ran a 2.91 ERA and saved 22 games last year, with his four-seamer averaging 99.6 mph. Angel Zerpa’s sinker averaged 96.6. Anthony Molina, Antonio Senzatela, Luinder Avila, and José Buttó were all above 95 mph. Eduardo Rodriguez and Yoendrys Gómez don’t bring as much heat, but their four-seamers were both well above the league average in terms of whiff rate.
Not all of these guys are standouts, but that’s a really deep ‘pen. Venezuela may well mash their way to the knockout round, but they could just as easily make it there by putting up zero after zero.
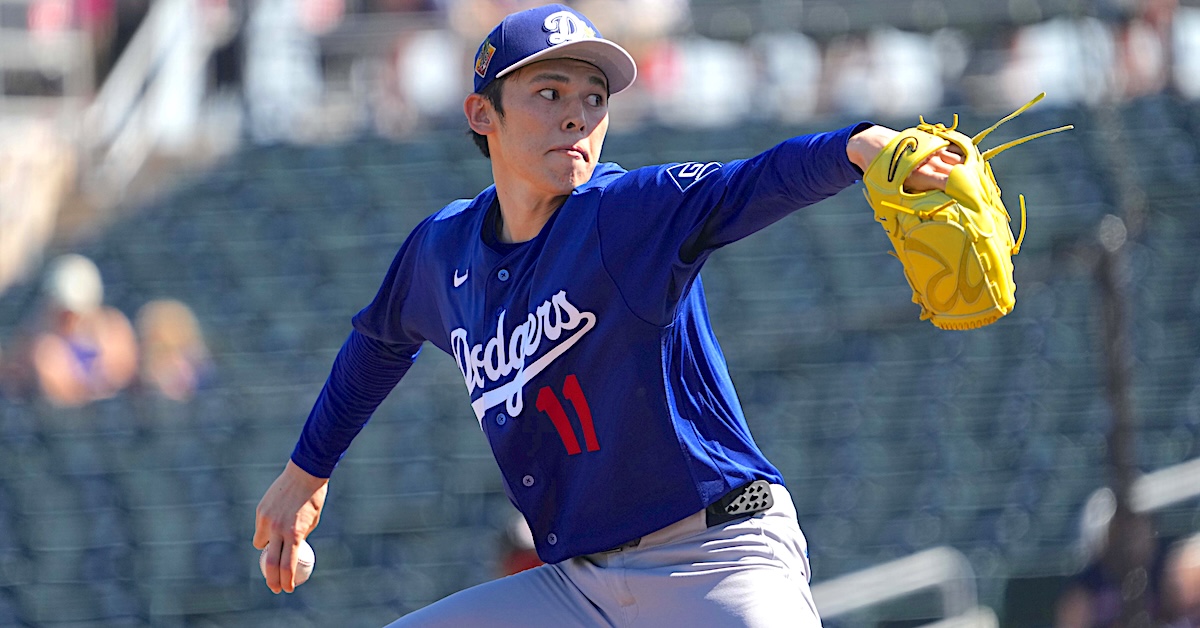
You should never worry about spring training results; it’s a small sample against uneven competition, in which the outcome of the game is irrelevant. But it’s not going great for Roki Sasaki. In two Cactus League starts, the Dodgers’ 24-year-old right-hander has allowed half of the 20 batters he’s faced to reach. His ERA is 18.90, and no matter the context, you never want to see a pitcher with a post-Civil War ERA.
For people doing the Chicken Little act about the Dodgers signing every big free agent, Sasaki — not Yoshinobu Yamamoto, Shohei Ohtani, or Kyle Tucker — is the guy who should’ve been scariest. The Dodgers signed a 23-year-old NPB ace even though, by dint of his youth, money was not an issue. If the Dodgers could land Sasaki, perhaps their dominance would become self-perpetuating. Read the rest of this entry »
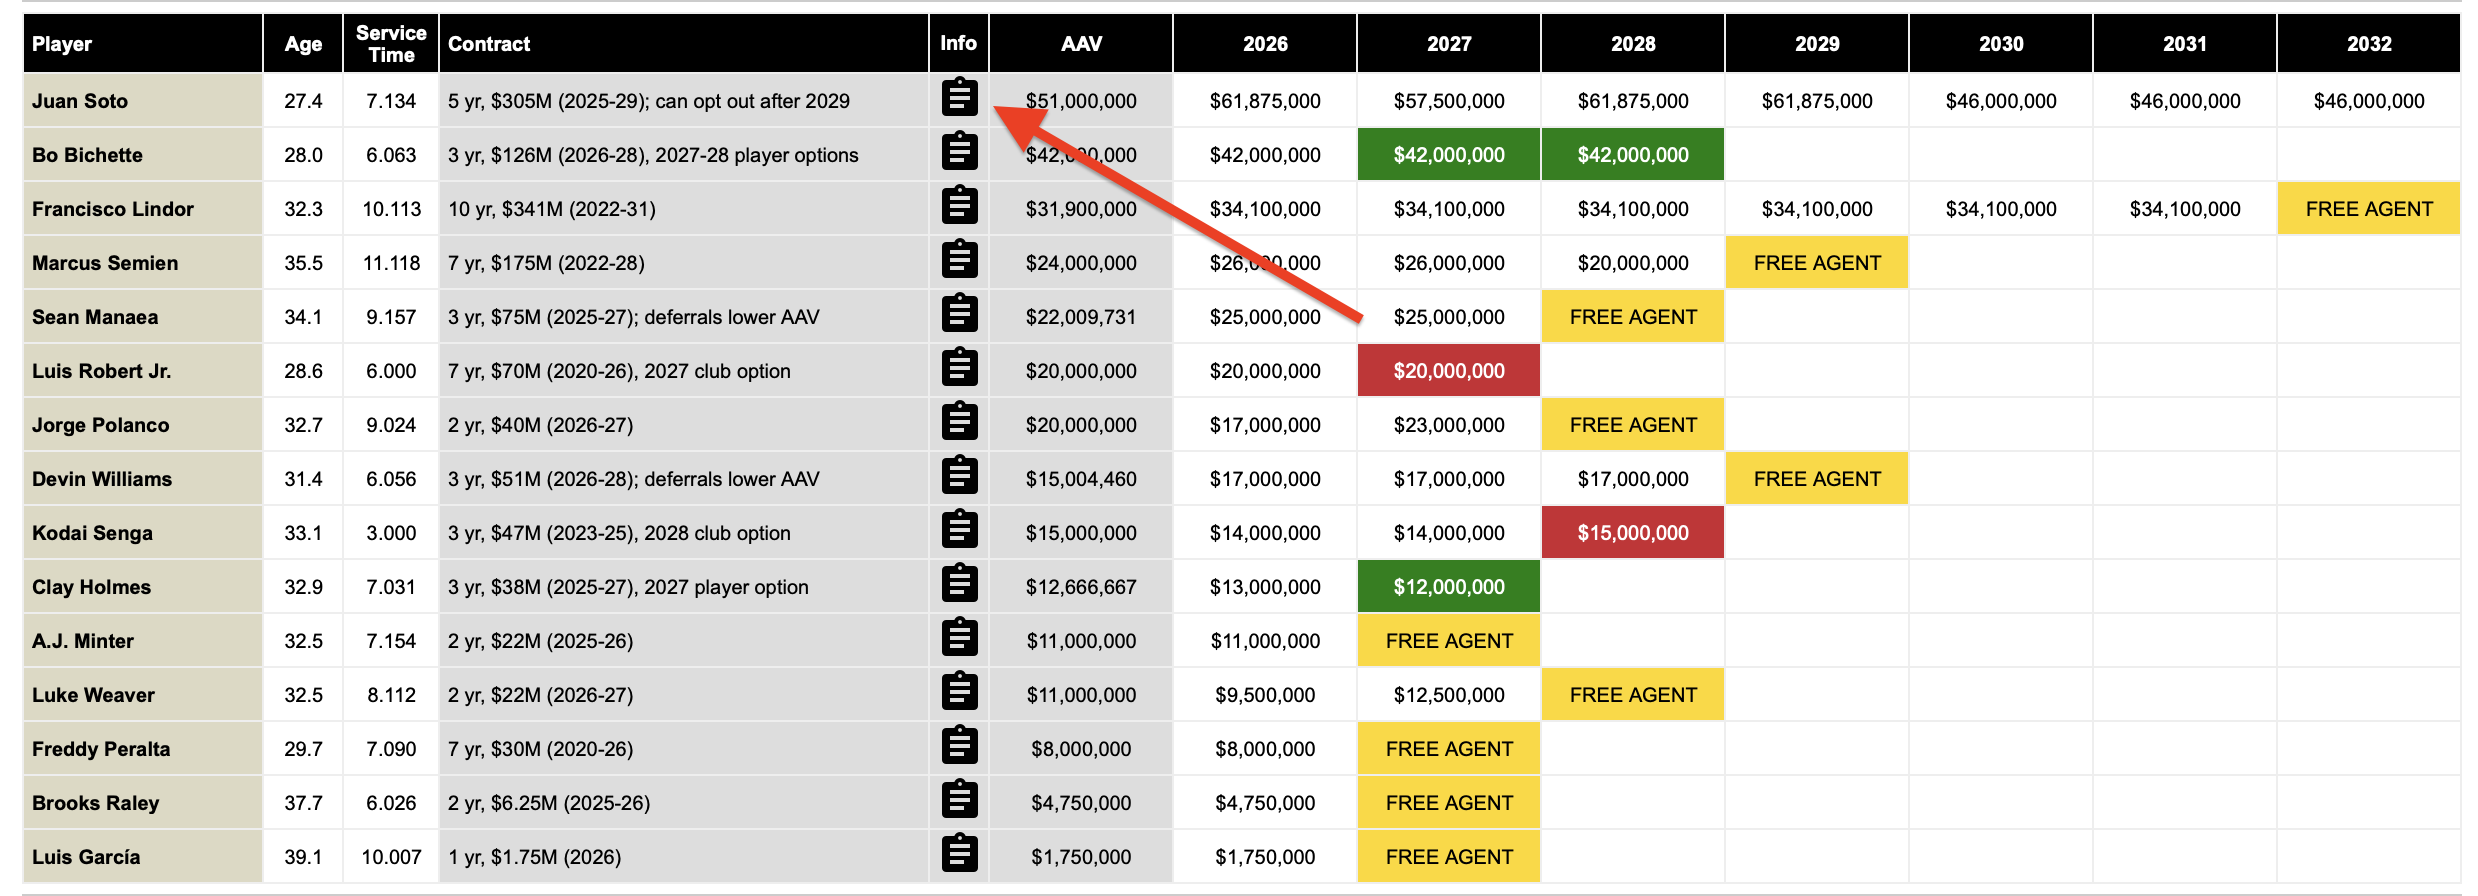
Following the introduction of contract incentive data last month, the RosterResource payroll pages now have much more detailed player-level contract information! I think we’ve always done a great job of showcasing a team’s payroll calculation, but we’ve lacked detailed information for individual contracts, especially long ones that go beyond the seven-year timeframe displayed on the team payroll pages.
To view a player’s contract information, all you have to do is click on the little clipboard icon next to the Contract column on the team payroll page:
The World Baseball Classic is officially back! We’re been running preview content for the last several weeks, but now that the tournament is actually underway, you’ve got to pick a team to root for. You may even want to pick one team from each of the four pools. To help you decide on your favorite, I’ll be offering a reason to cheer for each of the 20 teams in the field. We’re starting with Pool C because it’s kicking off today. So is Pool D, whose reasons will run a little later this afternoon. Pools A and B aren’t getting underway until tomorrow, so that’s when we’ll run their excitement primers.
Australia
Australia was one of the big surprises of the 2023 WBC. In the first game of pool play, the Australians took down South Korea in an 8-7 barnburner. Both teams lost to Japan and won all their other games, which was enough to push Australia into the knockout round and keep South Korea out. Australia lost to Cuba by just one run in the quarterfinals. This time around, their final game in Pool C will be against – you guessed it – South Korea, and if the seeds hold true, then that game will once again decide who moves on to the knockout round and who goes home. It should be an exciting one!
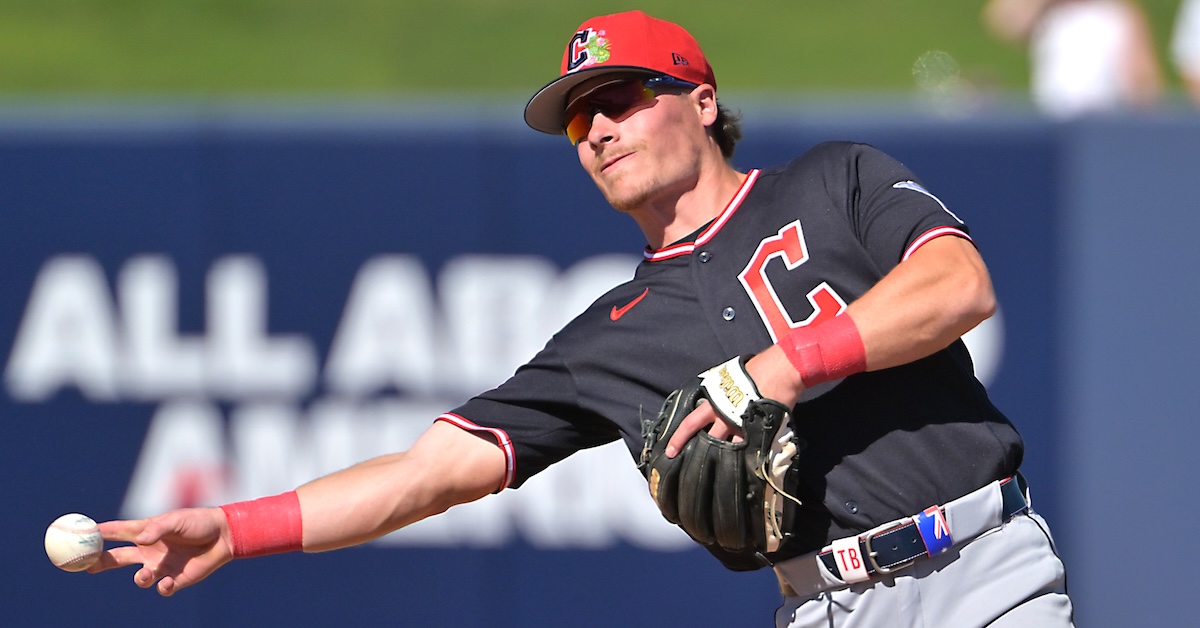
I was going to overthink things and talk about Tim Kennelly here. The guy is 39 and made it to Triple-A with the Phillies, and then he went back home and laid siege to the Australia Baseball League record books. He’s the all-time league leader in hits, homers, and RBIs, and he’s second in stolen bases. But we should keep things simple and talk about Travis Bazzana. Read the rest of this entry »
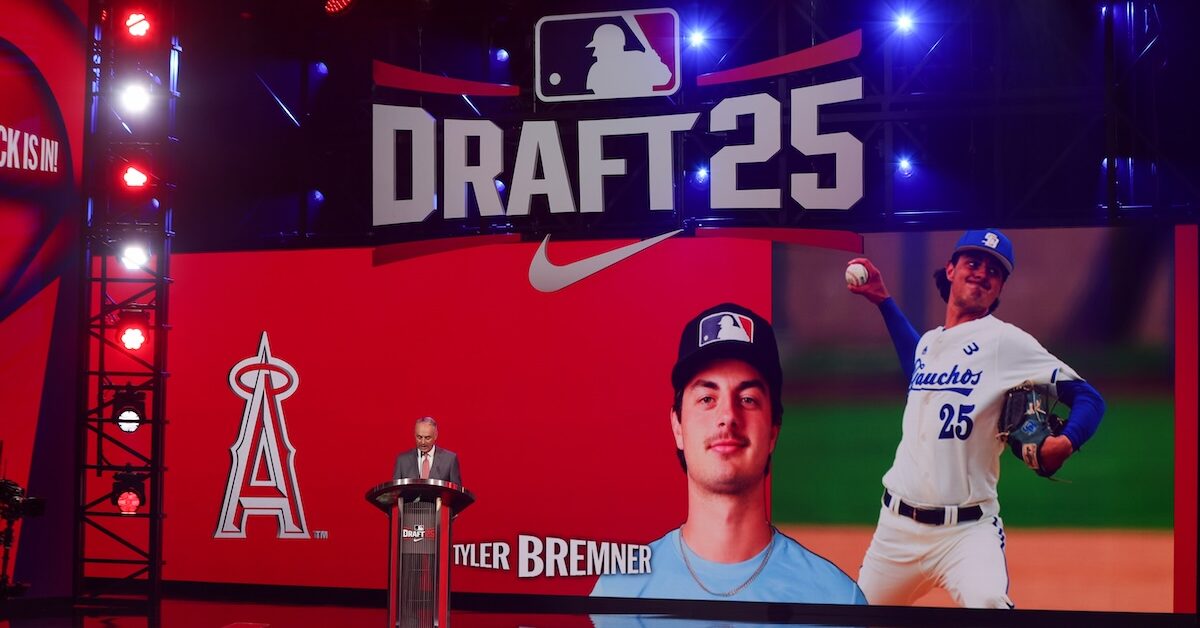
Tyler Bremner is the top prospect in what is widely viewed as a below-average Los Angeles Angels system. Drafted second overall last summer out of UC Santa Barbara, the 21-year-old right-hander is anything but below average — and that is especially true when it comes to his signature offering. Bremner boasts one of the best changeups of any prospect, in any organization. Factor in a fastball that sits mid-90s and touches 98, and you can see why my colleague Brendan Gawlowski referred to Bremner as “the draft’s most big league-ready player.”
Premium strike-throwing is another of Bremner’s attributes. As Gawlowski pointed out in his January write-up, the 6-foot-2, 195-pound San Diego native not only averaged fewer than 2.5 walks per nine innings across three collegiate seasons, he also “missed a ton of bats.” His draft-year strikeout rate was a heady 35.8%.
Bremner discussed his high-spin changeup, his sometimes-sinking four-seamer, and what he’s been learning in big league camp, prior to a recent game at Tempe Diablo Stadium.
———
David Laurila: I’ve read that you have a 70-grade changeup. What can you tell me about it?
Tyler Bremner: “I’ve kind of had the same grip since high school. I wouldn’t say it’s the most conventional grip. It’s a circle change, but I’m sliding down from the two-seam, so my middle and ring fingers are both on the horseshoe. I also like to tuck my pinky under it. That’s maybe a little unconventional, I guess. Not many people tuck their pinky like that.
“The grip is one thing, but there is also how you throw it. I’ve been blessed with being able to pronate the ball pretty well. For me, it’s not about trying to kill spin. I’m basically making it spin hard the other way, so I get that diving action. My arm speed also helps make it look like a heater. At the end of the day, you can have a changeup that moves a lot, but if it comes out in a way that hitters can pick it up — they can see the circle, or the spin is different than the fastball — then it’s not going to be as effective as one that isn’t as nasty. A changeup plays well if it is deceptive off the heater, so I’m really just trying to keep the arm speed and make it look like a fastball.”
After the signing of Framber Valdez served as an exclamation point on what had been a fairly quiet offseason, the Detroit Tigers have established themselves as the preseason favorites in the AL Central. With a generally deep lineup and a solid rotation further buttressed by what is likely Justin Verlander’s swan song, you have to like Detroit’s chances, even if you think that the Royals or Guardians could prove to be a bigger threat than Vegas currently does.
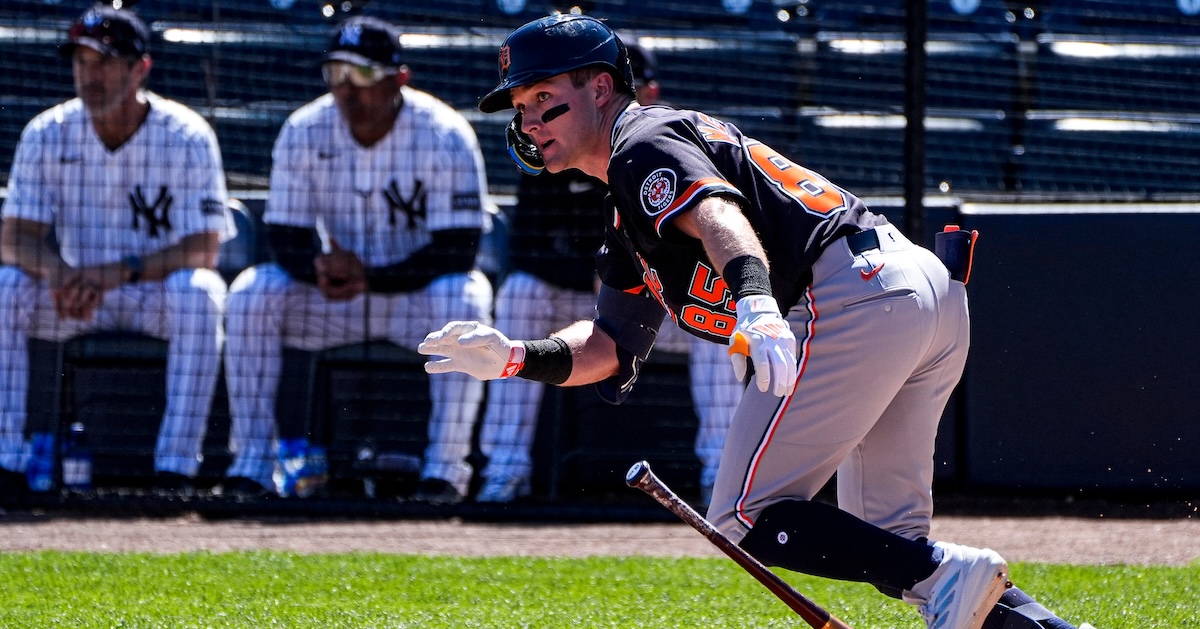
But as someone who has now spent decades feeding data into a cold, impersonal machine and watching it spit out projections, I know about as well as anyone that the future is horribly uncertain. Predictions are not destiny, and a team with a 75% chance of making the playoffs still has a one-in-four shot of watching them on TV. Over the next few weeks, the Tigers need to answer as many questions about their team as possible, and one of the biggest is whether their top prospect, Kevin McGonigle, will start the season in Detroit or Toledo. And if the Tigers are truly in win-now mode, McGonigle being in the Opening Day lineup is the absolutely correct move to make.
That the Tigers have made “now” into their most important timeframe isn’t an assertion that I’m just pulling out of nothingness. With the negotiating gap between Tarik Skubal and Detroit on an extension reportedly in the range of $250 million, retaining Skubal’s services for 2026 only makes sense if you’re going for it. If their goal is simply to try to quietly cruise into the playoffs with 86 wins, then they might as well have traded Skubal to a team that is willing to go all-in, and hoped that they’ll do fine with the impressive players they’re likely to get in return. Read the rest of this entry »
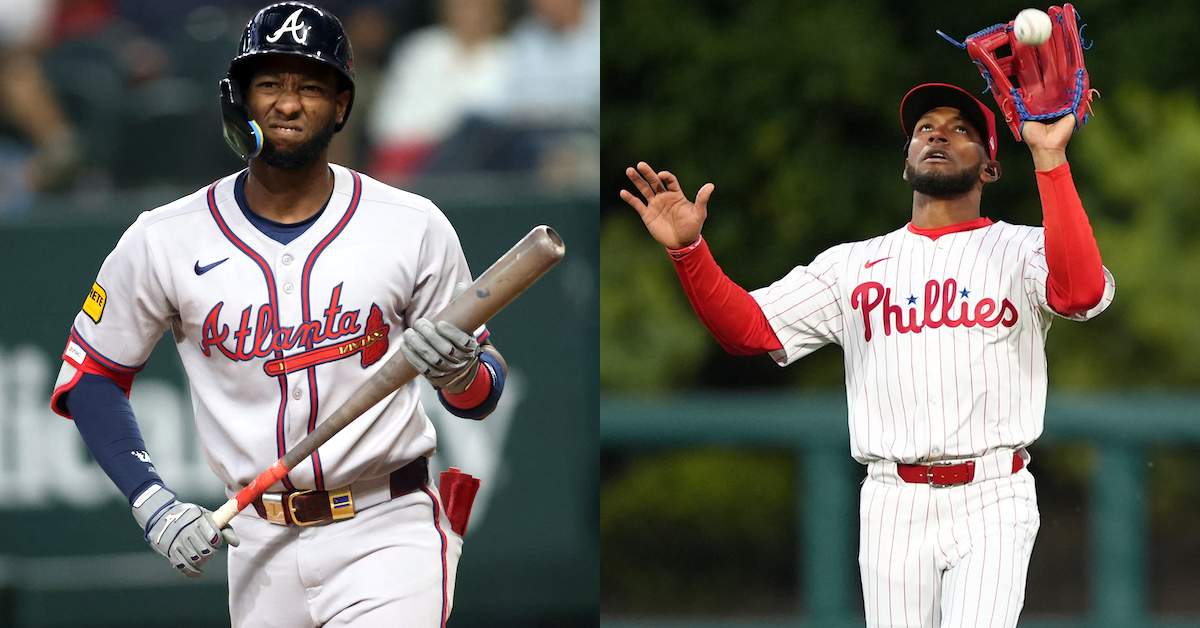
In 2024, 11 years after he was the consensus no. 1 prospect in the game, Jurickson Profar finally broke out, setting career highs in home runs (24), wRC+ (139) and WAR (4.3), making his first All-Star team, and helping the Padres to an NL Wild Card berth. He cashed in that winter; after never making more than $7.75 million in a season, Profar signed a three-year, $42 million deal with the Braves. Four games into his tenure with his new team, however, he drew an 80-game suspension for violating the Joint Drug Agreement. While he was productive upon returning and figured prominently in the plans of a team expected to contend for the NL East title this season, on Tuesday, the 33-year-old outfielder drew a second PED suspension, this one for the entire 2026 season.
Profar wasn’t the only player reported to be facing a PED suspension on Tuesday, or even the only NL East outfielder who had run afoul of the game’s drug policy. According to multiplesources, the Phillies’ Johan Rojas has an 80-game suspension looming for a first-time offense. While MLB officially announced Profar’s suspension in a press release sent at 6:47 p.m. ET on Tuesday — over six hours after ESPN’s Jeff Passan first broke the news — Rojas’ is not yet official.
Both players are reportedly appealing their suspensions. An hour after Passan’s tweet, The Athletic’s Ken Rosenthal reported that the Major League Baseball Players Association is filing a grievance on Profar’s behalf. It’s not clear yet on what grounds the union is challenging the suspension, but such a case would be heard by MLB’s independent arbitrator, Martin F. Scheinman. Later that afternoon, The Athletic’s Charlotte Varnes and Matt Gelb reported that Rojas is appealing his suspension, as well. He is starting in center field and batting seventh in Philadelphia’s exhibition game on Wednesday against Team Canada. Read the rest of this entry »
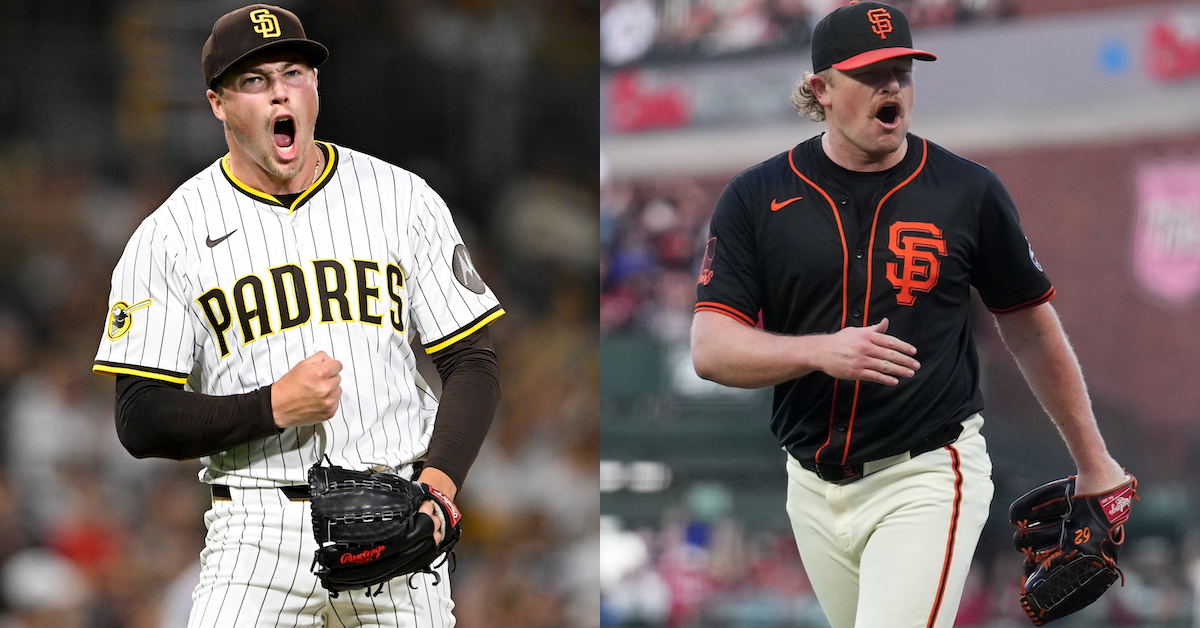
If you spend some time poking around the nooks and crannies of FanGraphs, you’ll eventually encounter one weird thing. Go to our Depth Charts Team WAR Totals page, and you’ll see all 30 teams arranged by the amount of WAR we project them to accrue this season. Go to our Projected Standings page, and you’ll see the winning percentage we expect for each team. Sometimes, those two pages seem to be displaying the exact same information. Sometimes, they don’t quite line up.
Take right now, for instance. We project the Padres for 40.8 WAR, the Giants for 38.7 WAR, and the Diamondbacks for 38.2 WAR. Look at the projected standings, however, and we have the Padres down for a .490 winning percentage, the Giants at .504, and the Diamondbacks at .501. That doesn’t feel right. Shouldn’t the team with the most projected WAR also project for the best record? Well, buckle up, because to explain how this works, we’re going to have to do some math.
We’ll break this one down into two parts. First, what does a team WAR projection mean? Most basically, it’s the sum of each player on that team’s WAR projection, but we’ll have to get more specific than that. Our projection systems can spit out a WAR, but that’s not their real output. They project actual on-field baseball results. Manny Machado’s Depth Charts projection is for 644 plate appearances, 28 doubles, 26 homers, 127 strikeouts, and so on. The WAR part of it gets calculated after the fact. Read the rest of this entry »