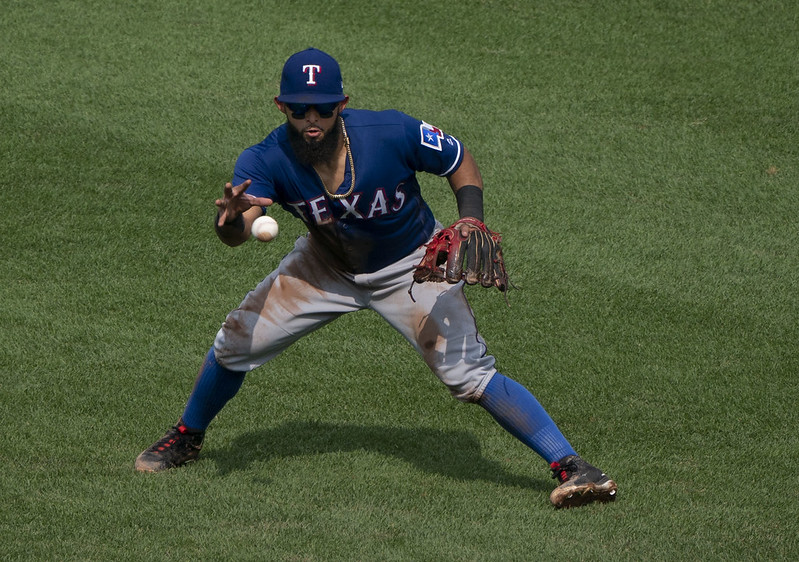
Brett Anderson is Back in Green and Gold (Again)

Just under two weeks ago, when I was writing a piece connecting the unsigned players from among our Top 50 Free Agents list to teams that appeared to have needs, Wade Miley came off the board by signing a one-year deal with the Astros. A similar thing happened in writing that piece’s sequel, covering a handful of the best of the unranked and unsigned free agents, as Brett Anderson pre-empted the publication by re-signing with the A’s on a one-year deal. He’ll cost a pittance, as he’s guaranteed a modest $1.5 million, with another $1 million possible in undisclosed incentives.

Though it feels like he’s been around forever, Anderson just turned 31 on February 1. That said, the 2006 second-round pick by the Diamondbacks (out of high school in Stillwater, Oklahoma) has already spent parts of 10 seasons in the majors. I should emphasize the word parts there because, well, we’ve rarely seen a whole season from him. As a rookie with the A’s in 2009 — a season in which he entered ranked seventh on Baseball America’s Top 100 Prospects list — he made 30 starts and threw 175.1 innings en route to 3.5 WAR. But only once since then has he started 30 times in a major league season. Hell, only once since then has he even reached 20 starts in the bigs: in 2015, he completed a solid 31-start, 180.1-inning campaign for the Dodgers (3.69 ERA, 3.94 FIP, 1.6 WAR). Read the rest of this entry »


Rocco Baldelli Extols Charlie Montoyo’s Leadership Skills (And Nelson Cruz’s, Too)

Rocco Baldelli knows Charlie Montoyo well. Not only did they spend the last four seasons together on Tampa Bay’s coaching staff, but Baldelli once played for the 53-year-old Montoyo in the minors. Minnesota’s new manager counts Toronto’s new manager as both a mentor and a friend.

Not surprisingly, Baldelli was effusive in his praise when I asked him about Montoyo. Citing his experience and leadership skills, he opined that the Blue Jays are getting “a tremendous manager and a great person.” Fittingly, Montoyo was hired on October 25, the same day his 37-year-old protege was tabbed by the Twins.

Baldelli wasn’t caught by surprise when he heard the news from north of the border. He knew that Montoyo had interviewed with the Cincinnati Reds, and that he would soon be doing the same with Toronto. The second of those sit-downs obviously went well. Mere days after meeting with him, the Blue Jays announced Montoyo’s hiring.

All told, five candidates went through the interview process in Toronto. Baldelli didn’t want to go on the record as to whether he was one of them, but he did allow that his post-season vacation plans were put on hold for a period of weeks. Multiple teams met with him about their openings. That was to be expected. The “future-manager” tag was assigned to him by myriad members of the media over the course of the 2018 season. Read the rest of this entry »


2019 Top 100 Prospects Chat

12:02

Eric A Longenhagen: Hi there, everyone. By now you probably know where the top 130 list is, so let’s get right to this. Kiley will be along shortly.

12:02

Jared: Who are some potential high leverage RP’s in the upper minors, with big stuff? Eric (not sure who’s doing the chat) gave me a good list last year at this time that included Jose Alvarado.

12:03

Eric A Longenhagen: That list you’re referring to was last year’s Picks to Click article, and this year’s version of it drops tomorrow.

12:03

Jackson: Swaggerty: is it his defense that puts him so high? Highest ranking I’ve seen from a publication.

12:04

Eric A Longenhagen: CF with speed and power, his tools belong there. You could argue the swing issues should force him down toward the other power/speed CFs with contact issues, but whose bat are you betting on improving, the new guy or someone like Monte Harrison who hasn’t made much progress over several years?

12:04

Jim Bob Cooter: Why you guys so down on Franklin Perez? Is a lat injury now considered serious or something?

Read the rest of this entry »


2019 ZiPS Projections – Tampa Bay Rays

After having typically appeared in the hallowed pages of Baseball Think Factory, Dan Szymborski’s ZiPS projections have now been released at FanGraphs for more than half a decade. The exercise continues this offseason. Below are the projections for the Tampa Bay Rays.

Batters

The Rays are similar to the St. Louis Cardinals in that they’re almost always one of the highest-floor teams in baseball. Since the team’s breakout season in 2008, which saw them reach the World Series, they’ve only really had one season that you could reasonably call lousy, the 68-94 campaign in 2016. Otherwise, Tampa’s been middling at worst, with a stretch of high-70s/low-80s wins that in large part reflects some draft struggles.

Since 2009, the Rays have only really hit on two players in the draft: Kevin Kiermaier and Blake Snell. Now, the jury is still out on some of these drafts, especially the more recent ones, but it’s hard for a team with Tampa Bay’s revenue model — and given some of the surrounding issues, they’re one of the few teams that really does seem to struggle financially — to compete consistently without drafts paying off. Read the rest of this entry »


2019 Top 100 Prospects

Below is our list of the top-100 prospects in baseball. The scouting summaries were compiled with information provided by available data, industry sources, as well as from our own observations.

Note that prospects are ranked by number but also lie within tiers demarcated by their Future Value grades. The FV grade is more important than the ordinal rankings. For example, the gap between prospect No. 5 on this list, Victor Robles, and prospect No. 35, Sean Murphy, is 30 spots, and there’s a substantial difference in talent there. The gap between Travis Swaggerty (No. 56) and Adrian Morejon (No. 86), meanwhile, is also 30 numerical places, but the difference in talent is relatively small. You may have noticed that there are more than 100 prospects in the table below, and more than 100 scouting summaries. That’s because we have also included 50 FV prospects who didn’t make the 100; their reports appear below, under the “Other 50 FV Prospects” header. The same comparative principle applies to them.

As a quick explanation, variance means the range of possible outcomes in the big leagues, in terms of peak season. If we feel a prospect could reasonably have a best big league season of anywhere from one to five WAR, that would be “high” variance, whereas someone like Colin Moran, whose range is something like two to three WAR, would be “low” variance. High variance can be read as a good thing, since it allows for lots of ceiling, or a bad thing, since it allows for a lower floor. Your risk tolerance could lead you to sort by variance within a given FV tier if you feel strongly about it. Here is a primer explaining the connection between FV and WAR. For further explanation of the merits and drawbacks of Future Value, read this.

You’ll also notice that this year, we’ve added probable FV outcome distribution graphs for each prospect on our list. This is our attempt to graphically represent how likely each FV outcome is for each prospect. Using the work of Craig Edwards, we found the base rates for each FV tier of prospect (separately for hitters and pitchers), and the likelihood of each FV of outcome. For example, based on Craig’s research, the average 60 FV hitter on a list becomes a perennial 5+ WAR player over his six controlled years 26% of the time, and a 27% chance of accumulating, at most, a couple WAR during his six controlled years. We started with these base rates for every player, then manually tweaked them to reflect how we think the player differs from the average player in that FV tier, since a player in rookie ball and a player in Triple-A with the same FV grade obviously don’t have exactly the same odds of success. So, these graphs are based on empirical findings, but with the subjectivity of our opinions included to more specifically reflect what we think the odds are of various outcomes. This is just a concept we’ve been kicking around for a while, one we hope to continue to refine to try to better communicate things about prospects.

Read the rest of this entry »


The Velocity Surge Has Plateaued

Among the proposals exchanged by MLB and the MLBPA was the idea of studying the mound. More specifically, baseball is interested in studying what might happen were the mound to be lowered, or were the mound to even be moved back. In a sense, adjusting the mound might seem radical, but of course, the mound has been lowered before, and baseball wants to see if it might be able to combat the ever-increasing strikeout rates. The league-average strikeout rate in 1998 was 16.9%. A decade later, it was 17.5%. Yet a decade later than that, it was 22.3%. That’s a 27-percent increase in strikeouts over the course of ten years. You can see why people might want to nip this in the bud.

Why have strikeouts been on the rise? How might you explain all the swinging and missing? I suppose there are the people who might just grumble the term “launch angle” and leave it at that, but a more compelling explanation might be the league-wide increase in velocity. It’s been hard not to notice — as they say, now every bullpen has a half-dozen guys who come out throwing 95 miles per hour. Billy Wagner used to throw 96. Now everybody throws 96. And the less time hitters have to react, the more often they’re going to whiff. Case closed! We’ve all solved it, together.

Except for the part where velocity has ceased increasing. The velocity surge was something I think a lot of us just took for granted. Teams like velocity, and players are training harder than ever before. But the surge has slowed, if not stopped. You don’t need to dig too deep to find evidence.

Read the rest of this entry »


Meg Rowley FanGraphs Chat – 2/12/19

2:00
Meg Rowley: Hello and welcome to the chat!

2:00
Meg Rowley: Allow me a brief moment to retrieve my coffee from the microwave.

2:00
Meg Rowley: Shall be back shortly.

2:02
Meg Rowley: I have returned. Many thanks for your collective patience.

2:03
Chris: Have the odds the Padres land Harper gone up or down since your last chat?

2:04
Meg Rowley: I suppose down slightly, though I still think I think that he ends up in Philly. I still think I think that.

Read the rest of this entry »


Let’s Find Homes for a Few More Unsigned Free Agents

On February 1, I checked in on the 10 players who made our Top 50 Free Agents list in November but had yet to sign contracts, attempting to match them up with teams still in need of that missing piece. Since then, the much-anticipated J.T. Realmuto trade has gone down, and the first camps have opened to pitchers and catchers, but none of those 10 players has come off the board. Instead we’re left with an endless swirl of rumors and rationalizations. Bryce Harper has talked to the Padres and Giants, but they don’t want to pay him $300 million! The Yankees have continued to check in on Manny Machado, but won’t improve upon an offer termed “low” by a source close to the player! Mike Moustakas may return to the Brewers! This is quite a party.

Alas, not really. It’s frustrating to watch this broken system playing out, and it has to be even more so for the players — not only the aforementioned ranked ones, but the dozens upon dozens beyond them who are being frozen out as well. These are real people who don’t know yet where they (and their families, in many cases) are going to spend the better part of the next year, and they’re being squeezed to the point of accepting a fraction of the money they might have reasonably expected just a couple of years ago. In many cases, the fates of these unranked, unsigned players are interconnected with the pricier options; a team in the market for rotation help, pursuing the likes of Dallas Keuchel (No. 4 on our list) or Gio Gonzalez (No. 33) might wind up going for one of the starters below if they don’t land their top choice.

As with my previous roundup, what follows here is an attempt to match the best of the rest of those currently unemployed with teams in need, using a combination our projected standings and Depth Charts, MLB Trade Rumors, Roster Resource, Cot’s Contracts, and some imagination. Consider it prescriptive, rather than predictive; the further down the pecking order one goes, the more one may as well be throwing darts. Read the rest of this entry »


Dustin Fowler on His Biggest Adjustment

Dustin Fowler may need to make an adjustment. The 24-year-old outfielder is coming off a rookie campaign that saw him slash an anemic .224/.256/.354, with six home runs, in 203 plate appearances. The Triple-A portion of his season was encouraging — a .310 BA and an .817 OPS — but his performance against big league pitching fell short of expectations. He went into the year ranked as Oakland’s No. 4 prospect.

He’d already made a notable adjustment. Prior to being acquired by the A’s in the 2017 trade deadline deal that sent Sonny Gray to the Yankees, Fowler had lowered his hands at the urging of then hitting coach, P.J. Pilittere. The reason was twofold: the team that drafted Fowler out of a Dexter, Georgia high school felt it would help him tap into his power. Every bit as importantly, his left-handed stroke wasn’t consistently catching up to high-octane heat.

Fowler talked about the 2016 adjustment midway through last season.

———

Dustin Fowler: “I hadn’t had much coaching growing up, so I was very raw. I’d just had small-town coaching — not the big coaching I needed — so going into pro ball was the first time I got some real one-on-ones on how to hit.

“I was very tall in my stance. I was upright, and my hands were over my head. Ever since grabbing a bat, I’d put them up there. My hand-eye coordination was good enough to make it work against pitching that wasn’t as good — slower pitching — but it worked less and less here. There’s a big difference from high school to pro ball. The pitches here harder, and I wasn’t catching up to balls. I was just fouling them off, or making fly-ball outs. Read the rest of this entry »


2019 ZiPS Projections – San Francisco Giants

After having typically appeared in the hallowed pages of Baseball Think Factory, Dan Szymborski’s ZiPS projections have now been released at FanGraphs for more than half a decade. The exercise continues this offseason. Below are the projections for the San Francisco Giants.

Batters

Be very careful when scrolling down to look at the depth chart. The way these things work, the first thing you’ll see is the outfield, which is likely to remain an absolutely brutal mess, one that couldn’t even be half-solved by a Ronald Acuña/Juan Soto-esque rise to power by Heliot Ramos, one of San Francisco’s few top prospects. Let’s put it this way: ZiPS projects Rule 5 draftee Drew Ferguson to be arguably the best outfielder on the team, with two of the other top outfielders being a minor-league signing and a waiver claim from the Rangers. The good news is that most of the group actually projects above replacement-level, so there’s a weird amount of adequacy in terms of the depth, but the projections give absolutely none of the team’s current group a chance to have much of an upside.

Things get sunnier when you look at the infield, which is the primary reason the Giants are likely to still be projected above the Padres for one last run (though probably just for one, unless the Padres are notably unlucky or incompetent). ZiPS essentially projects improvement for all of the team’s infield starters, kind of a rarity given the generally justifiable grumpy conservativeness to which projections systems are prone. The quality of the infield lends itself well to the argument that the Giants probably ought to have won more games last year. Not enough to be a playoff team, mind you, but at least enough to tone down the bleakness.

The worrisome thing about the offense is that most of the highlight players are at ages where their downsides can still hit like a ton of bricks and fast, and there’s no counterbalancing breakout potential. To the team’s credit, they’ve given every indication they realize that the outfield is bit of a tire fire. The Giants were in on all of the Marlins outfielders last winter, brought in Andrew McCutchen for 2018 (before trading him to the Yankees), and are now courting Bryce Harper. If any team is able to convince Harper to sign a shorter-term contract, San Francisco seems like a possibility; a superstar season from Harper could get the team into plausible contention, given their outfield weakness. And time is of the essence — if the infield starters don’t bounce back, this team is absolute toast.

I am still confused as to the baseball purpose of Pablo Sandoval remaining on the roster. Did someone in the organization finish last in their fantasy baseball league, and this is their punishment?

Pitchers

Johnny Cueto could theoretically return in September, but I think the smart money is still on him not making an appearance until 2020. Which, in addition to being unfortunate for Cueto, is rather bad timing for the Giants, who are less likely to be playing meaningful games in 2020 than this year.

Madison Bumgarner only gets a two-WAR projection, but that’s over just 147 innings, due largely to his attendance over the last two seasons, when he’s missed time due to freak injuries, one caused by something somewhat unusual (a dirt bike), the other by something somewhat mundane (a line drive). Since no elbow or shoulders were involved, I’m more optimistic about Bumgarner getting back to the 200 inning range than the projections are, which would boost his WAR to around three. ZiPS projects Dereck Rodriguez to be roughly league-average, which will be disappointing to Giants fans after a season in which Rodriguez was one of the team’s few highlights, but he has a very short record track record and a low K rate, so ZiPS isn’t putting him on the Kyle Hendricks pile yet. He’s certainly unlikely to repeat the 0.68 HR/9, even playing in Oracle Park.

The bullpen isn’t flashy, but the front-end is solidly above-average, and the team’s depth projects as more than adequate for its needs. San Francisco has shown an ability to turn random pieces into good relievers, and has a solid record with reclamation projects, such as Sam Dyson.

Bench and Prospects

After Joey Bart and Heliot Ramos, both likely to get official projections next year, the cupboard gets bare quickly. ZiPS does project Shaun Anderson to be a decent No. 3 starter for a time in his prime, and it has a long-term fascination with Conner Menez, but there’s just not much there there. Honestly, if the Giants had better prospects after their top two guys, I’d expect them to already have been traded for a starting pitcher. Most teams have a position player or two who ZiPS thinks projects better than the scouting reports indicate, but I’m just not seeing anybody here. Despite playing in the Pacific Coast League, Triple-A Sacramento only had one player who hit 15 homers (Chris Shaw).

One pedantic note for 2019: for the WAR graphic, I’m using FanGraphs’ depth chart playing time, not the playing time ZiPS spits out, so there will be occasional differences in WAR totals.

Ballpark graphic courtesy Eephus League. Depth charts constructed by way of those listed here at site.

Batters – Counting Stats
Player B Age PO G AB R H 2B 3B HR RBI BB SO SB CS
Buster Posey R 32 C 115 423 53 122 24 1 8 53 48 56 4 1
Brandon Crawford L 32 SS 143 507 59 129 29 4 14 67 46 115 4 4
Brandon Belt L 31 1B 117 416 57 104 25 3 15 53 62 122 4 1
Joe Panik L 28 2B 122 444 57 122 24 4 7 44 40 47 4 1
Evan Longoria R 33 3B 136 528 58 136 31 3 16 65 34 105 3 1
Alen Hanson B 26 2B 132 398 51 99 18 8 9 42 21 88 17 7
Breyvic Valera B 27 2B 126 424 50 113 16 4 5 38 37 48 7 7
Anthony Garcia R 27 LF 126 449 60 111 25 1 16 56 43 108 3 2
Drew Ferguson R 26 CF 92 348 45 85 18 2 6 31 39 101 9 6
Austin Slater R 26 RF 118 411 48 105 22 2 8 48 34 113 9 4
Stephen Vogt L 34 C 116 373 40 92 20 2 12 47 34 75 0 1
John Andreoli R 29 LF 115 420 52 94 19 4 6 35 51 130 20 7
Steven Duggar L 25 CF 117 467 55 116 26 4 6 42 46 139 13 6
Brock Stassi L 29 1B 89 286 35 68 16 1 6 30 37 67 0 1
Mac Williamson R 28 LF 101 348 46 81 17 1 14 43 30 103 3 2
Abiatal Avelino R 24 SS 132 489 53 119 20 6 9 43 26 108 16 6
Henry Ramos B 27 CF 99 347 39 91 17 3 7 35 24 75 6 4
Donovan Solano R 31 SS 110 397 39 102 22 1 4 33 16 61 2 1
Jerry Sands R 31 1B 93 307 36 71 16 1 10 36 33 88 2 1
Ryan Howard R 24 SS 120 465 47 118 23 3 4 41 27 77 6 4
Cameron Rupp R 30 C 90 311 31 67 15 1 10 34 29 110 0 0
Aramis Garcia R 26 C 101 386 40 84 17 1 11 41 22 128 0 1
Cesar Puello R 28 LF 90 315 42 78 14 2 6 30 29 85 8 4
Levi Michael B 28 SS 103 375 44 85 16 3 6 30 26 114 9 4
Ryder Jones L 25 3B 124 458 50 108 24 3 11 47 25 117 3 2
Mike Gerber L 26 CF 108 411 46 89 19 3 12 44 29 148 5 3
Rene Rivera R 35 C 61 173 14 37 7 0 5 21 10 58 0 0
Jin-De Jhang L 26 C 62 230 22 55 10 1 2 18 13 34 1 1
Ali Castillo R 30 3B 107 355 33 86 14 2 2 26 16 47 7 7
Ronnie Freeman R 28 C 71 231 22 52 9 1 3 17 14 57 0 0
Trevor Brown R 27 C 58 179 16 39 8 0 2 13 13 40 2 0
Caleb Gindl L 30 LF 84 266 27 60 12 2 4 24 22 64 1 2
Miguel Gomez B 26 2B 118 437 43 112 22 4 8 45 10 73 1 0
C.J. Hinojosa R 24 SS 102 395 40 92 18 2 4 31 29 68 6 4
Eury Perez R 29 RF 73 219 23 57 9 3 1 19 11 38 13 5
Pablo Sandoval B 32 3B 92 293 28 70 13 1 8 35 20 60 0 0
Zach Green R 25 1B 106 385 43 80 22 2 12 46 26 155 1 1
Chris Shaw L 25 LF 131 495 55 113 27 2 19 62 30 175 1 0
Peter Maris L 25 2B 87 317 35 72 12 3 6 28 27 72 5 5
Hamlet Marte R 25 C 72 265 27 56 12 1 6 23 17 95 2 1
Luigi Rodriguez B 26 RF 100 362 39 78 14 3 11 37 23 138 10 8
Myles Schroder R 31 1B 93 322 30 67 13 2 6 27 14 97 5 3
Heath Quinn R 24 LF 92 350 37 75 15 0 8 32 28 126 3 1
Matt Winn R 26 C 93 326 31 54 13 1 8 28 27 163 0 0
Sandro Fabian R 21 RF 120 455 43 91 20 1 10 41 18 138 2 3
Josh Rutledge R 30 2B 57 170 16 34 6 1 2 11 11 57 1 1
Jalen Miller R 22 2B 130 524 53 115 26 2 8 46 25 145 8 5


Batters – Rate Stats
Player PA BA OBP SLG OPS+ ISO BABIP RC/27 Def WAR No. 1 Comp
Buster Posey 479 .288 .363 .407 109 .118 .318 5.7 7 3.8 Earl Battey
Brandon Crawford 566 .254 .320 .410 97 .156 .304 4.7 9 3.2 Jay Bell
Brandon Belt 484 .250 .351 .433 112 .183 .319 5.5 8 2.8 Leon Durham
Joe Panik 495 .275 .337 .394 98 .119 .295 5.0 0 2.0 Jeff Treadway
Evan Longoria 574 .258 .305 .419 94 .161 .295 4.7 1 1.9 Tim Wallach
Alen Hanson 427 .249 .286 .402 84 .153 .299 4.2 3 1.3 Luis Rivas
Breyvic Valera 470 .267 .324 .358 86 .092 .291 4.1 2 1.2 Wallace Johnson
Anthony Garcia 506 .247 .323 .414 99 .167 .292 4.8 -2 1.1 Kurt Bierek
Drew Ferguson 396 .244 .329 .359 87 .115 .328 4.1 -1 1.0 Larry Bigbie
Austin Slater 455 .255 .319 .377 89 .122 .334 4.4 1 0.9 Ruben Mateo
Stephen Vogt 413 .247 .310 .408 93 .161 .280 4.5 -8 0.8 Bill Freehan
John Andreoli 478 .224 .311 .331 75 .107 .310 3.7 7 0.8 Reggie Williams
Steven Duggar 517 .248 .317 .360 84 .111 .342 4.1 -5 0.7 Rich Becker
Brock Stassi 328 .238 .326 .364 88 .126 .291 4.1 3 0.7 Ray Giannelli
Mac Williamson 386 .233 .303 .408 91 .175 .290 4.3 0 0.7 Scott Bryant
Abiatal Avelino 523 .243 .285 .364 75 .121 .296 3.8 -3 0.6 Hector Luna
Henry Ramos 378 .262 .309 .389 88 .127 .317 4.3 -4 0.5 Andrew Locke
Donovan Solano 421 .257 .288 .348 72 .091 .295 3.6 -1 0.4 Alvaro Espinoza
Jerry Sands 344 .231 .308 .388 88 .156 .292 4.2 1 0.4 Jarrod Patterson
Ryan Howard 503 .254 .298 .342 74 .088 .297 3.6 -4 0.4 Dean DeCillis
Cameron Rupp 344 .215 .285 .367 76 .151 .298 3.6 -4 0.4 Chad Moeller
Aramis Garcia 413 .218 .264 .352 66 .135 .296 3.2 1 0.4 Alvin Colina
Cesar Puello 360 .248 .329 .362 88 .114 .321 4.3 -2 0.3 Domingo Michel
Levi Michael 416 .227 .295 .333 71 .107 .310 3.5 -3 0.3 Doug Baker
Ryder Jones 493 .236 .282 .373 76 .138 .294 3.7 -2 0.3 Brennan King
Mike Gerber 447 .217 .271 .365 71 .148 .307 3.4 0 0.2 Justin Bowles
Rene Rivera 188 .214 .267 .341 64 .127 .291 3.1 0 0.1 Shawn Wooten
Jin-De Jhang 247 .239 .280 .317 62 .078 .273 3.1 0 0.1 Dave Miley
Ali Castillo 379 .242 .276 .310 59 .068 .275 2.8 7 0.1 Robert Eenhoorn
Ronnie Freeman 249 .225 .270 .312 58 .087 .287 2.9 1 0.0 Kyle Geiger
Trevor Brown 195 .218 .278 .296 57 .078 .270 3.0 -1 -0.1 David Duff
Caleb Gindl 292 .226 .285 .331 67 .105 .283 3.2 2 -0.2 Jeff Wetherby
Miguel Gomez 451 .256 .273 .380 75 .124 .292 3.8 -6 -0.2 Donnie Hill
C.J. Hinojosa 432 .233 .287 .319 65 .086 .272 3.2 -4 -0.2 Keoni DeRenne
Eury Perez 239 .260 .303 .342 75 .082 .311 3.9 -2 -0.3 Jason Bourgeois
Pablo Sandoval 319 .239 .292 .372 79 .133 .276 3.8 -7 -0.3 Geoff Blum
Zach Green 422 .208 .270 .369 72 .161 .312 3.4 1 -0.4 Ryan Mulhern
Chris Shaw 533 .228 .278 .406 83 .178 .312 4.0 -7 -0.4 Glenn Davis
Peter Maris 351 .227 .287 .341 70 .114 .276 3.3 -5 -0.4 Chris Lombardozzi
Hamlet Marte 285 .211 .257 .332 59 .121 .305 2.9 -6 -0.7 David Ross
Luigi Rodriguez 391 .215 .264 .362 68 .146 .315 3.1 0 -0.7 Tony Barron
Myles Schroder 348 .208 .255 .317 54 .109 .279 2.7 5 -0.8 Marc Sagmoen
Heath Quinn 384 .214 .279 .326 64 .111 .310 3.1 -2 -0.8 Lance Hallberg
Matt Winn 357 .166 .233 .285 40 .120 .297 2.2 -1 -0.9 Steve Lomasney
Sandro Fabian 485 .200 .238 .314 49 .114 .264 2.4 10 -0.9 John Lindsey
Josh Rutledge 184 .200 .255 .282 46 .082 .288 2.4 -4 -0.9 Paul Hoover
Jalen Miller 559 .219 .261 .323 58 .103 .288 2.9 -3 -1.0 Chris Patten


Pitchers – Counting Stats
Player T Age W L ERA G GS IP H ER HR BB SO
Madison Bumgarner L 29 8 8 3.86 24 24 147.0 139 63 21 37 135
Johnny Cueto R 33 7 7 3.92 22 22 133.0 131 58 17 35 110
Dereck Rodriguez R 27 7 7 4.19 27 26 146.0 150 68 18 45 114
Drew Pomeranz L 30 7 8 4.42 28 21 116.0 111 57 14 57 107
Derek Holland L 32 7 8 4.54 29 25 134.7 135 68 19 56 118
Jeff Samardzija R 34 7 8 4.59 22 22 131.3 134 67 19 35 109
Will Smith L 29 3 2 2.94 57 0 52.0 41 17 5 17 69
Tony Watson L 34 5 4 3.17 66 0 59.7 54 21 6 15 57
Andrew Suarez L 26 9 11 4.60 30 29 162.3 176 83 24 47 130
Conner Menez L 24 8 10 4.52 27 27 125.3 123 63 14 74 115
Carlos Navas R 26 4 4 3.93 43 1 68.7 66 30 7 24 63
Reyes Moronta R 26 4 3 3.39 65 0 58.3 44 22 4 36 74
Mark Melancon R 34 2 2 3.22 47 0 44.7 43 16 3 11 35
Ty Blach L 28 7 9 4.55 37 18 128.7 143 65 14 36 73
Chris Stratton R 28 8 11 4.73 28 26 144.7 155 76 18 57 111
Keyvius Sampson R 28 8 10 4.69 26 19 126.7 106 66 15 76 129
Derek Law R 28 3 3 3.67 49 0 56.3 54 23 4 20 49
Sam Dyson R 31 4 4 3.84 64 0 58.7 58 25 5 20 44
Shaun Anderson R 24 6 9 4.86 25 24 129.7 142 70 20 41 97
Logan Webb R 22 3 4 4.81 27 24 88.0 91 47 11 42 70
Chase Johnson R 27 3 4 4.74 19 17 62.7 68 33 6 29 40
Dillon McNamara R 27 3 3 4.21 39 1 51.3 51 24 5 23 44
Ray Black R 29 3 3 3.94 56 0 48.0 33 21 5 34 77
Tyler Rogers R 28 3 3 4.02 52 0 65.0 65 29 4 28 47
Sam Coonrod R 26 5 7 4.89 22 18 95.7 99 52 12 49 79
Pat Venditte R 34 3 3 4.44 38 0 48.7 46 24 6 24 45
Jake Barrett R 27 2 3 4.03 53 0 58.0 52 26 6 31 62
Sam Moll L 27 2 2 4.02 40 0 47.0 48 21 4 18 37
Travis Bergen L 25 3 3 4.13 30 0 28.3 26 13 3 13 27
Steven Okert L 27 2 2 4.10 52 0 48.3 46 22 7 16 49
Tyler Herb R 27 5 8 5.17 21 21 108.0 120 62 14 49 73
Manny Parra L 36 2 2 4.14 39 0 45.7 46 21 3 23 35
Jamie Callahan R 24 3 3 4.50 29 1 40.0 41 20 4 19 32
Sam Wolff R 28 2 3 4.37 29 0 35.0 32 17 4 21 39
Pierce Johnson R 28 3 3 4.52 45 3 63.7 60 32 7 35 64
Enderson Franco R 26 6 9 5.22 26 21 119.0 135 69 17 52 86
Jordan Schafer L 32 1 1 4.59 27 1 33.3 32 17 4 17 33
Brandon Beachy R 32 1 1 5.79 6 6 23.3 26 15 4 14 15
Pat Ruotolo R 24 2 3 4.89 41 0 42.3 40 23 8 22 51
Josh Osich L 30 1 1 4.71 54 1 57.3 59 30 7 28 47
Casey Kelly R 29 7 11 5.22 28 23 131.0 151 76 21 45 89
Joan Gregorio R 27 4 6 5.35 20 15 79.0 83 47 14 39 71
Melvin Adon R 25 4 6 5.40 19 16 80.0 89 48 9 51 55
Carlos Diaz L 25 2 3 4.80 40 0 50.7 50 27 4 34 40
Kieran Lovegrove R 24 2 3 4.91 42 0 55.0 54 30 5 39 47
Garrett Williams L 24 5 8 5.30 31 16 88.3 92 52 8 67 66
Jose Valdez R 29 3 4 5.27 45 0 54.7 54 32 8 36 52
Taylor Hill R 30 5 9 5.48 23 19 106.7 130 65 18 31 53
Tyler Beede R 26 5 9 5.55 30 17 99.0 108 61 15 60 83
Jordan Johnson R 25 6 11 5.62 24 23 115.3 128 72 19 63 83
Ryan Halstead R 27 2 4 5.64 38 0 52.7 60 33 12 16 42
Michael Connolly R 27 4 8 5.85 25 14 92.3 112 60 17 37 53


Pitchers – Rate Stats
Player TBF K/9 BB/9 HR/9 BABIP ERA+ ERA- FIP WAR No. 1 Comp
Madison Bumgarner 612 8.27 2.27 1.29 .285 102 98 4.03 2.0 Bud Black
Johnny Cueto 561 7.44 2.37 1.15 .290 100 100 4.08 1.7 Bob Forsch
Dereck Rodriguez 630 7.03 2.77 1.11 .297 97 103 4.28 1.7 Steve Fireovid
Drew Pomeranz 511 8.30 4.42 1.09 .294 92 109 4.43 1.0 Rich Robertson
Derek Holland 590 7.89 3.74 1.27 .296 90 112 4.59 1.0 Shawn Estes
Jeff Samardzija 557 7.47 2.40 1.30 .295 89 113 4.26 0.9 Bill Gullickson
Will Smith 212 11.94 2.94 0.87 .300 134 75 2.78 0.9 Ken Dayley
Tony Watson 247 8.60 2.26 0.91 .289 124 80 3.45 0.8 Tony Castillo
Andrew Suarez 705 7.21 2.61 1.33 .306 86 117 4.47 0.8 Bobby Livingston
Conner Menez 571 8.26 5.31 1.01 .302 87 115 4.71 0.8 Trevor Wilson
Carlos Navas 295 8.26 3.15 0.92 .299 103 97 3.86 0.6 Daryl Irvine
Reyes Moronta 253 11.42 5.55 0.62 .290 116 86 3.41 0.6 Brian Wilson
Mark Melancon 186 7.05 2.22 0.60 .294 122 82 3.26 0.6 Dick Coffman
Ty Blach 557 5.11 2.52 0.98 .299 87 115 4.34 0.5 Mike Caldwell
Chris Stratton 640 6.91 3.55 1.12 .305 83 120 4.52 0.5 Kevin Hodges
Keyvius Sampson 558 9.17 5.40 1.07 .273 84 119 4.57 0.4 Victor Zambrano
Derek Law 241 7.83 3.20 0.64 .301 107 93 3.51 0.3 Mark Lee
Sam Dyson 253 6.75 3.07 0.77 .293 103 97 3.93 0.3 Jack Aker
Shaun Anderson 569 6.73 2.85 1.39 .302 81 123 4.77 0.3 Mike Lincoln
Logan Webb 396 7.16 4.30 1.13 .300 82 122 4.82 0.2 Jesus Silva
Chase Johnson 284 5.74 4.16 0.86 .302 83 120 4.70 0.2 Sean White
Dillon McNamara 227 7.71 4.03 0.88 .303 97 103 4.22 0.1 Casey Daigle
Ray Black 211 14.44 6.38 0.94 .301 100 100 3.55 0.1 Dwayne Henry
Tyler Rogers 287 6.51 3.88 0.55 .299 98 102 3.98 0.1 Bruce Dal Canton
Sam Coonrod 434 7.43 4.61 1.13 .302 81 124 4.85 0.1 Allen Edwards
Pat Venditte 216 8.32 4.44 1.11 .290 92 109 4.57 0.1 Jim Czajkowski
Jake Barrett 256 9.62 4.81 0.93 .299 98 102 4.12 0.1 George Smith
Sam Moll 205 7.09 3.45 0.77 .306 98 102 3.96 0.1 Jim Crawford
Travis Bergen 124 8.58 4.13 0.95 .291 99 101 4.21 0.1 Mike Venafro
Steven Okert 207 9.12 2.98 1.30 .295 96 104 4.18 0.1 Javier Lopez
Tyler Herb 490 6.08 4.08 1.17 .305 79 127 5.01 0.0 Ben Fritz
Manny Parra 205 6.90 4.53 0.59 .303 95 105 4.11 0.0 Joe Gibbon
Jamie Callahan 179 7.20 4.28 0.90 .303 90 111 4.43 0.0 Rick Greene
Sam Wolff 158 10.03 5.40 1.03 .304 93 107 4.38 0.0 Gabriel Dehoyos
Pierce Johnson 285 9.05 4.95 0.99 .301 87 115 4.36 -0.1 Ryan Henderson
Enderson Franco 542 6.50 3.93 1.29 .311 78 128 5.05 -0.1 Rick Sutcliffe
Jordan Schafer 148 8.91 4.59 1.08 .301 86 116 4.35 -0.1 C.J. Nitkowski
Brandon Beachy 109 5.79 5.40 1.54 .293 68 147 6.02 -0.2 Jim Abbott
Pat Ruotolo 189 10.84 4.68 1.70 .305 83 120 4.97 -0.3 Lariel Gonzalez
Josh Osich 258 7.38 4.40 1.10 .301 84 119 4.72 -0.3 John Curtis
Casey Kelly 586 6.11 3.09 1.44 .307 76 132 5.07 -0.3 Jim Magrane
Joan Gregorio 357 8.09 4.44 1.59 .301 74 136 5.29 -0.3 Carl Dale
Melvin Adon 379 6.19 5.74 1.01 .309 73 137 5.34 -0.4 Rich Dorman
Carlos Diaz 235 7.11 6.04 0.71 .299 82 122 4.79 -0.4 Brian Adams
Kieran Lovegrove 257 7.69 6.38 0.82 .301 83 121 4.91 -0.4 Lloyd Allen
Garrett Williams 423 6.72 6.83 0.82 .304 74 134 5.31 -0.4 Ken Chase
Jose Valdez 253 8.56 5.93 1.32 .299 77 129 5.29 -0.6 Marty McLeary
Taylor Hill 478 4.47 2.62 1.52 .303 72 139 5.39 -0.6 Allen Davis
Tyler Beede 464 7.55 5.45 1.36 .310 71 141 5.44 -0.7 Julien Tucker
Jordan Johnson 535 6.48 4.92 1.48 .300 70 143 5.67 -0.8 Jim Hunter
Ryan Halstead 233 7.18 2.73 2.05 .300 70 143 5.60 -0.9 Dwayne Pollok
Michael Connolly 424 5.17 3.61 1.66 .305 67 148 5.79 -1.0 Scott Shoemaker


Disclaimer: ZiPS projections are computer-based projections of performance. Performances have not been allocated to predicted playing time in the majors — many of the players listed above are unlikely to play in the majors at all in 2019. ZiPS is projecting equivalent production — a .240 ZiPS projection may end up being .280 in AAA or .300 in AA, for example. Whether or not a player will play is one of many non-statistical factors one has to take into account when predicting the future.

Players are listed with their most recent teams, unless I have made a mistake. This is very possible, as a lot of minor-league signings go generally unreported in the offseason.

ZiPS’ projections are based on the American League having a 4.29 ERA and the National League having a 4.15 ERA.

Players who are expected to be out due to injury are still projected. More information is always better than less information, and a computer isn’t the tool that should project the injury status of, for example, a pitcher who has had Tommy John surgery.

Both hitters and pitchers are ranked by projected zWAR — which is to say, WAR values as calculated by me, Dan Szymborski, whose surname is spelled with a z. WAR values might differ slightly from those which appear in full release of ZiPS. Finally, I will advise anyone against — and might karate chop anyone guilty of — merely adding up WAR totals on a depth chart to produce projected team WAR.