Andrew Cashner and Theoretical Home Run Shenanigans

The Boston Red Sox and the Baltimore Orioles completed a trade over the weekend, with Baltimore sending pitcher Andrew Cashner to Boston in return for center fielder Elio Prado and third baseman Noelberth Romero.

At 28-65, the Orioles appear likely to be eliminated from the playoff race sometime in August. Andrew Cashner is a free agent at the end of the season, and even if Baltimore had a less implausible shot at the playoffs, it makes a lot of sense to get something in return for the right-hander while the getting is good. In this case, the getting is two very deep dives into the Red Sox organization. Prado and Romero are both 17 year-olds out of Venezuela. Neither player is anywhere near the top of the prospect radar at this point. To grab a couple of lottery picks, the Orioles agreed to pay half of Cashner’s salary to the Red Sox, a figure just a bit under $2 million. If either prospect works out, it won’t be a new experience for Cashner, who has been swapped for Anthony Rizzo and Luis Castillo in previous trades.

Cashner has had a decent season on paper, but the Orioles’ return suggests that there is a good deal of skepticism surrounding his 3.83 ERA and 4.25 FIP. The bump in Cashner’s peripherals in 2019 is at least enough for ZiPS to think of him as a one-win player. That’s par for the course for a fifth starter, and it just so happens that’s exactly what the Red Sox were in the market for. It isn’t something that will show up well in playoff projections, but remember that teams can no longer pick up major league-caliber fourth and fifth starter types in August, which means that teams ought to take more care to prepare for emergencies now. And pitchers famously have lots of emergencies. Brian Johnson is currently out due to an intestinal issue, and given that he’s been out for weeks, it seems to be something a good bit more serious than overindulging in spicy chili. He has thrown a couple of bullpens, but his trip to the IL creates some uncertainty, which isn’t a good state of being for a contending team. And Cashner is likely a safer below-average pitcher than Hector Velazquez. Read the rest of this entry »


Dan Szymborski FanGraphs Chat – 7/15/2019

12:02
Avatar Dan Szymborski: Release the Chaten!

12:02
Roberto Beers: The lull in HS content has left me drifting to other F2P games, namely TFT. Have you played? Thoughts on the AutoChess genre?

12:03
Avatar Dan Szymborski: Intrigued by it, but haven’t dipped my toes in yet. HS has been fun!

12:03
Joe: Do you have updated ZIPS numbers for Tatis? I know his babip can’t stay this good so what are realistic expectations for him?

12:03
Avatar Dan Szymborski: You should see a WAR update in the trade value series. I may do something more substantial before the offseason.

12:03
Matt: Please confirm that your name is not in fact, “Szymbobski”

Read the rest of this entry »


2019 Trade Value: #41 to #50

Max Scherzer proved to be the most difficult player to place on this year’s list. (Photo: Keith Allison)

As is the annual tradition at FanGraphs, we’re using a week around the All-Star Game — when the industry pauses to take a metaphorical breather — to take stock of the top-50 trade chips in the sport. For more context on exactly what we’re trying to do here, see the Honorable Mentions post linked at the top of the page.

For this post and the four to follow, I’ll present a graphic (by way of the wizard Sean Dolinar) breaking down each player’s objective skill level (represented, in this case, by a five-year WAR projection from ZiPS), contract/team-control details, rank in last year’s series, and then year-by-year details of age, WAR, and contract through the end of 2023, although a couple players have control beyond those five years, and some, you’ll notice, show projections for fewer years to reflect when those players reach free agency. For those readers who are partial to spreadsheets rather than blocks of text, I’ll also include all of the players we’ve ranked so far in grid format at the bottom of the post.

It should be noted that the ZiPS WAR forecasts influenced the rankings a bit. For players who were bunched together, it acted as an impartial tiebreaker of sorts, but the industry opinions I solicited drove the rankings.

With that said, let’s get to the bottom 10 spots on this year’s Trade Value list. Read the rest of this entry »


A’s Make Homer Bailey an Unexpected Deadline Upgrade

Homer Bailey woke up Sunday morning expecting to start a game between two teams going nowhere, but instead discovered that he would be joining a playoff chase. Kansas City shipped the righty to the Oakland A’s in exchange for 23-year-old shortstop Kevin Merrell.

Bailey, 33, has been a cromulent arm for KC this season, with a 4.80 ERA and 4.47 FIP in 90 innings. His 1.1 WAR is his best figure since 2014, while his 8.10 K/9 is his best mark since 2013.

Merrell, the 33rd overall pick back in 2017, ranked 20th on Eric and Kiley’s list of Oakland’s top farmhands before the season. Speed is Merrell’s calling card, but his 80-grade wheels haven’t had much chance to shine this year in Double-A, as he’s sporting a meager .246/.292/.339 line in 82 games.

Oakland will be Bailey’s fourth organization in the last eight months. After a 12-year stint with the Reds, he was shipped to the Dodgers in a seven-player swap that sent Yasiel Puig, Matt Kemp, Alex Wood and Kyle Farmer to Cincinnati in return for prospects Jeter Downs and Josiah Gray. Bailey’s inclusion in the deal was motivated entirely by finances, however, as the $22.45 million he was owed in 2019 was a close match with the $21.75 million owed to Kemp; the structure of Bailey’s contract made it more luxury tax-friendly to the Dodgers. One day after the trade was completed, Bailey was released by Los Angeles, and in February, he signed a minor league contract with the Royals.

While he rarely lived up to his billing as a top prospect, Bailey was a pretty good starter early in the decade, when he accrued 6.3 WAR from 2012-13 while throwing more than 200 innings each year. The Reds rewarded Bailey, then 27, with a six-year, $105 million contract extension. Twenty-three starts into what appeared to be another good season in 2014, he was shut down with an arm injury. He underwent Tommy John surgery, made just a combined eight starts from 2015-16, and in parts of four seasons following his injury, held a 6.25 ERA and 5.13 FIP in 231.2 innings.

It isn’t difficult to see why two playoff aspirants didn’t have room for Bailey. Just seven months later, however, another win-now team was willing to part with a top-20 prospect to add him to their rotation. What changed?

Well, for one, it’s always been somewhat difficult to differentiate between Good Bailey and Bad Bailey. His average fastball velocity in 2012 was 93.2 mph. In 2018, it was 93.0 mph. His chase rate in 2013 was 34.5%. In 2018, it was 33.0%. His swinging strike rate, pitch usage, and ground ball rates were consistent as well. And yet he’d gone from a solid No. 2 starter to nearly unemployed.

Bailey’s numbers in many of those areas haven’t changed much this season, either. His average four-seamer is 92.8 mph. His chase rate is just a couple ticks lower than last season. His groundball rate is up three points, and his swinging strike rate has climbed modestly as well.

There is, however, one big difference in Bailey’s repertoire. His career fastball percentage sits around 60%. In years after his surgery, it was 55%. This year, it’s down to 49.3%. His slider percentage, 17% a year ago, is down more than four points. Those missing fastballs and sliders have turned into splitters:

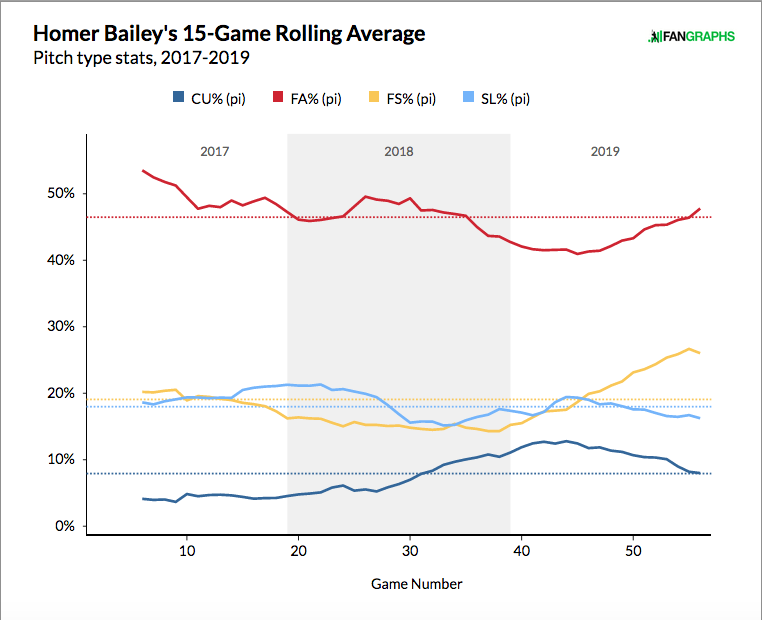
Bailey’s thrown his splitter on 27.3% of his offerings in 2019, more than eight points higher than any other season of his career. It’s a great pitch for him to lean on: According to Statcast, opponents have just a .195 xBA .250 xSLG against the split, and their actual numbers aren’t exceeding those estimates by much. Of the five pitches Bailey has used in 2019, three of them have an xwOBA above .350. Finding a pitch as reliable as the splitter has been vital for him, and as he’s thrown it more, he’s been more effective. In his last five starts, he’s thrown 29 innings and posted a 2.48 ERA.

That was good enough for Oakland to add him to its starting rotation. The A’s have weathered Frankie Montas’ suspension well, but they still need rotation help. Montas had a 2.70 ERA and 2.9 WAR in 90 innings before receiving an 80-game suspension on June 21. Since then, Oakland starters have accumulated 1.7 WAR, good for seventh-best in baseball, though their 4.85 xFIP suggests they’ve been a bit fortunate.

Mike Fiers, Brett Anderson and Chris Bassitt have been serviceable starters, but all three are outperforming their FIPs by a wide gap. Tanner Anderson and Daniel Mengden are passable options, but the rotation is clearly Oakland’s weakest part of the roster. Critically, Oakland’s internal prospective reinforcements all have question marks. Jharel Cotton and Sean Manaea are on track to rejoin the team in August, but they’re both returning from serious injuries: Manaea hasn’t pitched this year and Cotton has been out since 2017. The two top pitching prospects in the organization in A.J. Puk and Jesus Luzardo, meanwhile, have thrown only a handful of innings this season, and probably aren’t realistic options to contribute down the stretch. The A’s need an arm or two, and they got a cheap one in Bailey.

Because the Dodgers are paying $22.45 million in salary owed to Bailey for the 2019 season, Oakland is on the hook for just the remaining $250,000. As far as prospect cost, a top-20 prospect isn’t nothing, but Merrell has a long road ahead of him. As Eric and Kiley wrote back in March, a move to the outfield is likely in his future, and there isn’t much power at all in his bat. His speed makes him interesting, but he’ll need to take a big step forward to profile as a regular.

That’s all that it cost to bring Bailey to Oakland, an organization that has done well with similarly beleaguered pitchers recently. Last June, they signed Edwin Jackson — a pitcher who hadn’t posted an ERA under 5.00 since 2015 — and watched him spin 92 innings of 3.33 ERA ball the rest of the year. They also coaxed 110 splendid innings out of Trevor Cahill’s oft-injured and sporadically-effective right arm. The A’s have been a good home for pitchers who once seemed over the hill, and perhaps Bailey will continue the pattern. Just seven months ago, he was a cast-off. But in Kansas City, he showed he wasn’t done. Now, in Oakland, he can show how much more he has left.


2019 Trade Value: Intro and Honorable Mentions

The industry has placed Brendan McKay just outside the top-50 players by trade value. (Photo: Keith Allison)

All-Star week has come and gone, which means a lot of things, like that the races for the 2019 postseason have begun to take shape (only a few seem over at this point) and also that many of those who work in baseball just finished taking rushed, abbreviated vacations. Around here, though, it means it is time for a different tradition — namely, the start of our annual Trade Value series.

The inimitable Dave Cameron conducted this exercise for 13 years, 10 of which were for this website. He’s since moved on to the Padres, so FanGraphs has to settle for me in his stead, now for the second year. This list wouldn’t be possible without the model established by Cameron, or the help Sean Dolinar, Dan Szymborski, and Meg Rowley provided in putting together this year’s entry. A special thanks is also due to the industry friends who put up with much rougher early versions of this list, were generous with their time, and helped whip it into shape.

For those new to the series, it represents an attempt to answer the question “Who would bring back the most in trade if he were put on the market before the deadline?” What’s notable about this list — as opposed to the prospect lists I assemble with Eric Longenhagen — is that my opinion doesn’t matter. The goal here isn’t for me to project anyone’s future value but rather to capture the opinions of the industry and express how it values players in reality, right now.

Read the rest of this entry »


Effectively Wild Episode 1404: Do the Hustle

EWFI
Ben Lindbergh, Sam Miller, and professional player (and former Sonoma Stompers coach, catcher, and first baseman) Tommy Lyons discuss the different types of hustle in baseball, deciding what level of hustle is acceptable in a variety of situations and examining how the fan perspective on hustle differs from the player perspective on hustle, plus a postscript (1:14:40) on two Atlantic League plays, the Angels’ combined no-hitter in tribute to Tyler Skaggs, and Bob Gibson’s health.

Audio intro: The Dead Weather, "Hustle and Cuss"
Audio outro: Shinedown, "45 (Acoustic)"

Link to EW Facebook group’s hustle-play suggestions
Link to Ben on hustling to first base
Link to Sport Science segment on diving into first base
Link to THT on diving into first base
Link to FanGraphs on diving into first base
Link to Russell Carleton on trying too hard
Link to video of Upton/Longoria lollygagging argument
Link to video of Atlantic League sprint to first
Link to video of Atlantic League ejection
Link to video of Angels no-hitter
Link to Fabian Ardaya’s story on the Angels’ combined no-hitter
Link to Roger Angell’s Gibson story
Link to order The MVP Machine

 iTunes Feed (Please rate and review us!)
 Sponsor Us on Patreon
 Facebook Group
 Effectively Wild Wiki
 Twitter Account
 Get Our Merch!
 Email Us: podcast@fangraphs.com


Sunday Notes: Robert Stock Stimulates His Nervous System (And Hits Triple Digits)

Robert Stock is following a breakthrough season with a rocky season. Last year, the right-hander broke into the big leagues at age 28, and logged a 2.50 ERA in 32 appearances out of the Padres’ bullpen. This year he’s spent the bulk of his time with San Diego’s Triple-A affiliate, and scuffled in his smattering of opportunities in The Show. Currently on the IL with a bicep strain, Stock has a 10.13 ERA in 10-and-two-thirds innings of work.

There’s more to the Robert Stock story than his late-bloomer status and overall pitching prowess. When I talked to the former Los Angeles-area prep at Petco Park recently, I learned that he’s a converted catcher with an unorthodox workout routine.

“I use a training system called EVO UltraFit,” Stock told me. “It involves electrodes, and obscure ways of lifting weights. You’re doing things like jumping off of stuff, and catching things that are falling.”

Watching an ESPN feature on a former NFL safety was the catalyst. Learning that Adam Archuleta “found success through this weird training system,” he decided to try it himself. Just 13 years old at the time, Stock traveled to Arizona, “where the guru is,” and proceeded to adopt the program. He’s been a disciple ever since.

An electrodes apparatus was charging at Stock’s locker as we spoke. Read the rest of this entry »


FanGraphs Audio: Eric Longenhagen Is Here to Rock and Roll

Episode 865

Lead prospect analyst Eric Longenhagen returns to the program to detail FanGraphs’ recent trip to Cleveland. We discuss his impressions of the Futures Games, as well as what he looks for at showcase events like that, before contemplating the ideal format for the All-Star Game. This host also shares an embarrassing travel story, which she swears is true, and we review several particularly bad MLB.TV commercials and a few shark-related films.

For an extended Futures Game conversation, be sure to listen to the latest episode of The Untitled McDongenhagen Project, during which Eric and Kiley McDaniel discuss the prospects they saw and how their estimations of those prospects changed after last weekend. For prospect-related tweets, be sure to follow Eric and the FanGraphs Prospects account. And as always, you can find the guys’ latest rankings and reports on THE BOARD.

Don’t hesitate to direct pod-related correspondence to @megrowler on Twitter.

You can subscribe to the podcast via iTunes or other feeder things.

Audio after the jump. (Approximate 1 hour and 12 min play time.)


The Blossoming of Marcus Semien

Marcus Semien is having a moment. Semien finished the 2018 season with 3.7 WAR, nearly doubling the next-best total of his career. There was a catch, however, in that Semien’s WAR was largely fueled by a sudden jump in his defensive numbers. While the numbers for Baseball Info Solutions and Ultimate Zone Rating never completely agreed on Semien, they both thought he was a below-average defender at short. Coming into 2018, per 1350 innings, BIS had Semien at -2.7 runs, while UZR had him at -7.6 runs. In 2018, those numbers were +8.5 runs and +7.9 runs respectively, numbers that, if believed, meant that Semien had added 10-to-15 runs of value from somewhere very unexpected.

While a White Sox prospect, it was thought that Semien would likely struggle playing shortstop in the majors. In the minors, he made 60 errors in 2203 innings (37 errors per 1350 innings), which led the White Sox to find as much time for him at second and third base as possible. And while error rates usually come down in the majors, Semien committed 35 errors in his first season as the A’s shortstop. You could argue that errors can be overused as a method of defensive evaluation — and you’d be correct — but there are limits. UZR actually had Semien as slightly above-average in range, with the -11.7 total run estimate coming from a brutal -12.6 runs from errors. That’s not a run-of-the-mill error-prone season, either:

Worst Error Seasons, Shortstops, 2002-2019
Season Name Error Runs
2015 Marcus Semien -12.6
2017 Tim Anderson -10.7
2010 Ian Desmond -10.4
2010 Starlin Castro -9.7
2015 Ian Desmond -8.7
2004 Angel Berroa -7.6
2014 Jonathan Villar -7.3
2011 Eduardo Nunez -7.3
2006 Hanley Ramirez -6.9
2013 Jonathan Villar -6.9
2006 Felipe Lopez -6.9
2004 Kaz Matsui -6.8
2007 David Eckstein -6.7
2011 Elvis Andrus -6.6
2016 Ketel Marte -6.5
2016 Brad Miller -6.3
2009 Everth Cabrera -6.3
2003 Erick Almonte -6.3
2005 Russ Adams -6.3
2004 Rafael Furcal -6.2
2012 Dee Gordon -6.2
2005 Clint Barmes -6.1
2013 Starlin Castro -5.7
2015 Danny Santana -5.7
2003 Rafael Furcal -5.6

Read the rest of this entry »


James Paxton Has Hit a Bump in the Road

Through the first month of the season, it looked like James Paxton was going to build on his breakout 2018 season and elevate himself into the upper echelons of the pitching ranks. Through May 3, he had posted a 3.11 ERA backed by a 2.59 FIP and a ridiculous 33.6% strikeout rate. On May 3, Paxton exited his start with a knee injury and wound up missing four weeks of play, and since his return from the injured list, he just hasn’t been the same.

In his eight starts since May 29, his FIP has shot up to 4.65 and his strikeout rate has fallen to 24.7%. A vintage 11-strikeout performance in his last start on July 7 is propping up that strikeout rate, too; he struck out just three batters in each of his two previous starts before that. The league average strikeout rate for a starter is 22% so complaining about Paxton’s dip in results feels a little like picking nits. It would be easy to chalk up his post-IL results to the lingering effects of the knee injury or just a string of bad luck. But a deeper look into his pitch repertoire reveals some concerning trends.

Back in early May, Sung Min Kim wrote an article detailing the changes Paxton had made to his pitch mix. In short, Paxton “basically swapped the usage rates of his cut fastball and curveball.” And why wouldn’t he want to throw his cutter more often? He generated a ridiculous number of whiffs with the pitch last year (37.2% whiff rate) and batters simply could not square it up when they did make contact with it (6.5% barrel rate). But the effectiveness of the pitch has waned with greater exposure.

In the past, it’s been a put-away pitch Paxton turned to when he was ahead in the count. He would use his fastball and curveball to get ahead and then earn a strikeout with a well placed cutter. Because he’s throwing his cutter more often this season, he’s had to use it earlier in at-bats. There are only so many two-strike counts to throw it in, so some of those extra cutters have come when the count is in the batter’s favor. Here’s what Paxton’s cutter usage has looked like by count over the last four seasons:

James Paxton, Cutter Usage
2016-2018 2019
Batter Ahead 11.9% 17.6%
Even 39.7% 43.3%
Pitcher Ahead 48.4% 39.1%

Not only is he throwing it more often earlier in the count, he’s also throwing it less often when he does get ahead. Trying to steal a strike with his cutter early in an at-bat isn’t necessarily a bad thing — he used his curveball to do exactly that last year — but it becomes a problem when he can’t locate his cutter in the zone:

Paxton’s cutter is at it’s very best if he can locate it down and in against a right-handed batter, right over their back foot. That location takes the pitch out of the strike zone to get a swinging strike. But he’s actually spotted his cutter in the zone more often than you might expect. In years past, he’s thrown his cutter in the zone around 47% of the time, a touch below the league average zone rate for a cutter. Even though it feels high for a put-away pitch, it never really affected his ability to earn a swinging strike. This year, he’s locating his cutter in the zone around 35% of the time, the lowest zone rate of any cutter thrown more than 100 times:

James Paxton, cutter results
Zone% Swing% SwStr% Whiff/Sw%
2016-2018 46.8% 57.9% 21.8% 37.2%
2019 34.9% 48.2% 18.7% 38.7%

He’s locating the pitch as though he was ahead in the count and looking for a whiff, but those pitch locations aren’t exactly ideal earlier in the count. Batters are content to just take a cutter when they hold the advantage, knowing that they’re likely to either whiff or it’ll end up out of the zone as a ball. So even though Paxton’s whiff per swing rate on his cutter is just as good as it has been in the past, because his overall swing rate on the pitch is down almost 10 points, his raw number of swinging strikes is down.

Since 2017, Paxton has added more than two inches of horizontal movement to his cutter. It’s possible that additional movement has affected his command of the pitch:

If he’s throwing his cutter the same way he did last year, aiming at a target that would locate the pitch in the zone, that extra horizontal movement could be carrying the pitch out of the zone despite his intent.

It’s also possible that batters are able to identify his cutter more easily this year. Paxton took a big step forward last year when he started to tunnel his high four-seam fastball with his curveball. But his cutter also benefited from that pitch tunnel as well:

James Paxton, fastball-cutter tunnel
Year Pitch Sequence Batter Hand PreMax PreMax Time
2018 Fastball-Cutter RHB 1.25 0.157
2019 Fastball-Cutter RHB 1.46 0.162
SOURCE: Baseball Prospectus

Last year, Paxton’s fastball-cutter pitch tunnel was excellent. The perceived distance between the two pitches in sequence (PreMax) was well above average and they separated in flight (PreMax Time) just a few milliseconds before the tunnel point. Both measures have deteriorated a bit this year and it’s likely due to the location of these pitches in sequence. Paxton’s pitch tunnel works best when his cutter is located right at the bottom of the zone but not too low. THe average location of his cutter this year has given opposing batters a few extra milliseconds to identify whether a pitch is worth swinging at.

I can’t explain why Paxton has swapped the number of curveballs and cutters he throws this year. Maybe he’s lost the feel for his curveball. But the effectiveness of his secondary pitches has waned with the altered usage pattern. The solution is likely a little more complicated than just swapping back. He’s going to have to figure how to locate his cutter a little better, especially if he needs to use it earlier in counts to keep batters off his fastball.