Since 2019, Rafael Devers has put up 25.2 WAR for the Red Sox. Over that span, only one other player has even reached 10.0; it was Xander Bogaerts, who is no longer with the team. With the exception of the shortened 2020 season, Devers has never finished worse than second on the team in WAR. That includes last season, when he recorded 4.1 WAR despite playing through injuries to both shoulders. He was arguably the worst defensive third baseman in baseball, but he hit so well that he was inarguably the best player on the team, the face of the franchise, and one of the most productive third basemen in the game.
The Red Sox traded away Mookie Betts. They let Bogaerts walk. They kept Devers. When erstwhile chief baseball officer Chaim Bloom signed Devers to a 10-year, $313.5 million contract extension in January 2023, Michael Baumann’s headline read, “The Red Sox Have Finally Extended Rafael Devers.” He’s the longest-tenured member of the team, and only Kristian Campbell, whose extension contains team options for 2033 and 2034, is under contract further into the future. The Red made Devers the cornerstone, but in something straight out of a Suzy Eddie Izzard bit, they have spent the past couple months trying to dig him up and plop him down in different spots. The moves make baseball sense. That’s not the problem. The problem is communication. The team seems to be doing its level best to alienate its biggest star, repeatedly saying one thing in public, and then another to Devers in private. Read the rest of this entry »
A papal conclave is the ultimate news story. It’s an event shrouded in ceremony and secrecy, which takes place incredibly rarely; only three times in the past 40 years, in fact. Even in this era when seeing everything has made the mysterious mundane, the world is left waiting in total ignorance for news of white smoke. Billions of observers, Catholic or not, look on in rapt fascination. And when the conclave produced the first American-born pope, Leo XIV, things only got more fascinating.
I come from a Catholic extended family, but for the most part, I was a devoted low-church protestant in my youth and am largely irreligious now. Nevertheless, I’ve always held the Vatican in a certain esteem. Its grandeur, its rituals, its dense and ancient jargon — all of that looks mystical and romantic from a distance. Is it the sole conduit to Almighty God? Perhaps not, from where I sit. But it’s a fascinating institution nonetheless.
That cloud of fairy tale wonder evaporated in an instant on Thursday, when the cardinal electors chose Cardinal Robert Prevost of Chicago to inherit St. Peter’s throne. Read the rest of this entry »
Mike Bacsik is best known for having surrendered Barry Bonds’s 756th home run. The August 7, 2007 bomb at San Francisco’s AT&T Park gave Bonds the most in MLB history, one more than Henry Aaron. Unlike the legendary bashers, Bacsik is but a mere mortal. A left-handed pitcher for four teams over parts of five seasons, the now-Texas Rangers broadcast analyst appeared in 51 big-league games and logged a record of 10-13 with a 5.46 ERA in 216 innings.
Despite his relative anonymity, the gopher wasn’t the only noteworthy happening in Bacsik’s career. Moreover, those didn’t all take place with him on the mound.
“In my first 14 at-bats, I didn’t get a hit, didn’t strike out, and didn’t walk,” explained Bacsik, who finished 5-for-50 at the dish. “Apparently that’s a record for not having one of those outcomes to begin a career. I didn’t know this until last year when we were in Detroit and they brought it up on the broadcast.”
In Bacsik’s next three plate appearances, he doubled, singled, and struck out — all in the same game. Two years later, in his 44th time standing in a batter’s box, he drew his only career walk.
The first home run that Bacsik allowed — there were 41 in all — was to Kevin Millar. It isn’t his most-memorable outside of the Bonds blast. Read the rest of this entry »
Ben Lindbergh and Ben Clemens of FanGraphs banter about the latest positional drama regarding Rafael Devers, then discuss whether and why pitchers leaguewide are Yu Darvish-ing and Tyler Holton-ing—that is, throwing more pitch types, and varying their pitch types more based on batter handedness—before answering listener emails about home strike zones and combining bad teams to make a good team. Then (44:42) Ben continues the “baseball jobs” series by bringing on Adam Auer, major league dietician for the Brewers and former minor and major league strength and conditioning coach, to talk about how teams are improving player performance through nutrition, exercise, and recovery, followed (1:41:49) by Emory Brinkman, senior editor for Stats Perform, who discusses generating viral fun facts, parsing statistical qualifiers, and data-wrangling.
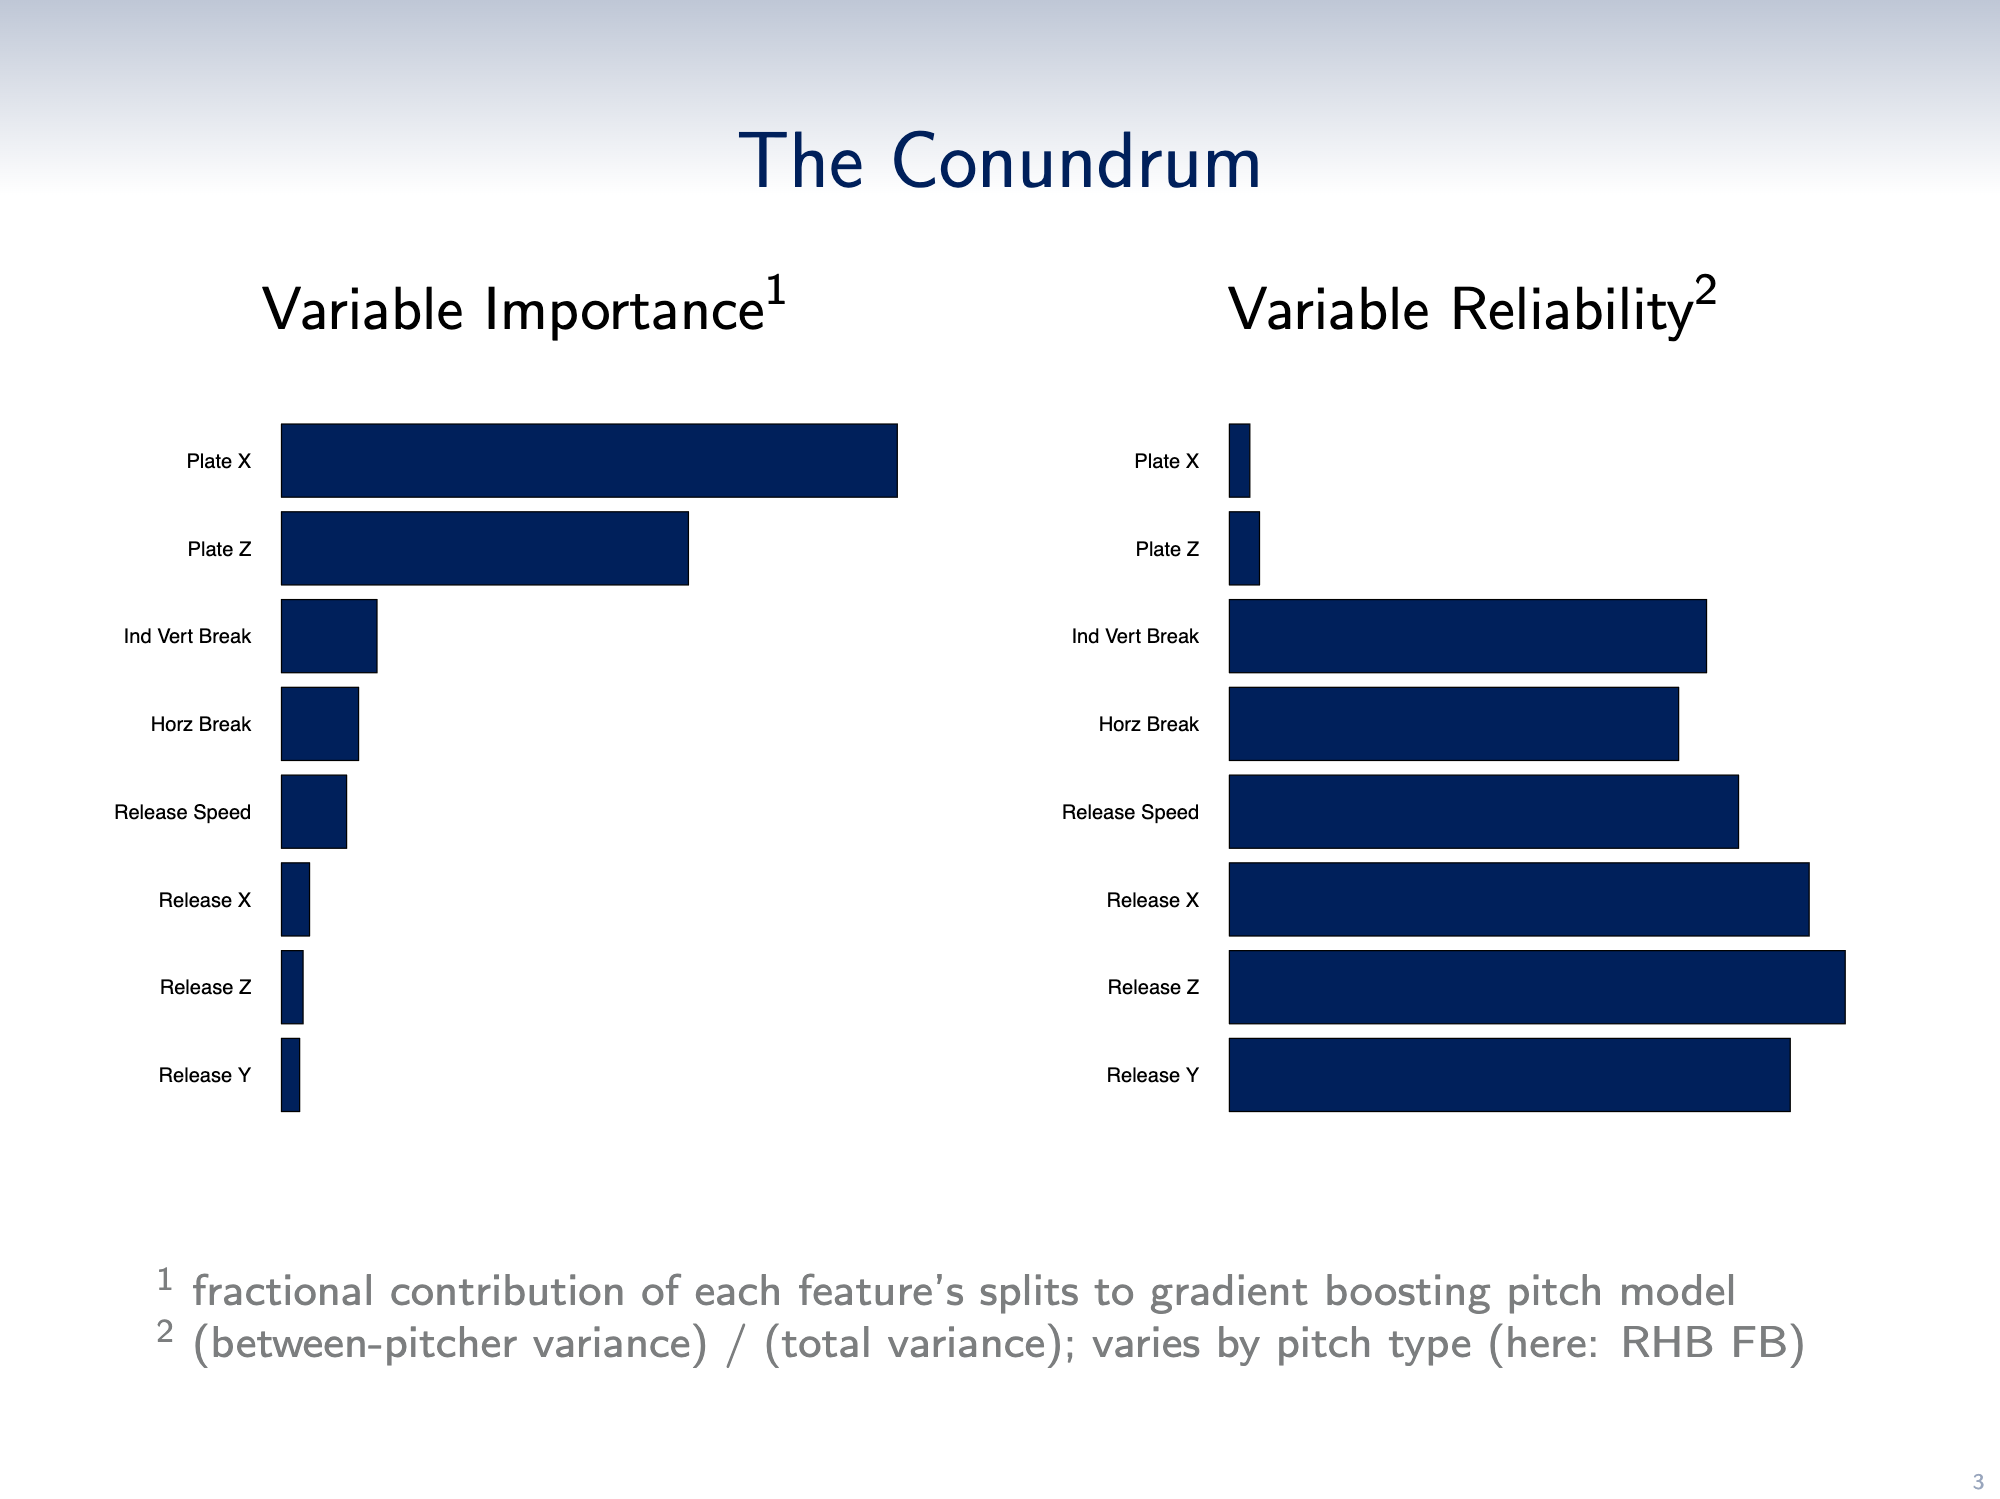
In the introduction to their 2023 Saberseminar presentation, Scott Powers and Vicente Iglesias hit on a fundamental truth about pitching: The variable that bests predicts the outcome of a pitch is the location where it crosses the plate. For a case study, look no further than this tweet from MLB.com’s David Adler about Yoshinobu Yamamoto’s splitters.
Hitters have swung 74 times at Yoshinobu Yamamoto's splitter this season …
If Yamamoto buries his splitter arm side, he’s probably getting a whiff. If it’s on the edge of the zone, it’s likely a foul ball. If it catches plate, it’s getting put in play. The location dictates the outcome.
Given this truth, pitchers who command the ball best ought to dominate. But there’s a catch. As Powers and Iglesias noted, the location is also the variable with the least predictive reliability. If you see a pitcher throw a fastball 98 mph, you can be pretty sure he is going to do it again. A dotted backdoor slider, on the other hand, does not guarantee an entire game of dotted backdoor sliders. Command is both the most important and the least reliable quality for a pitcher.
Scott Powers and Vicente Iglesias, 2023 Saberseminar
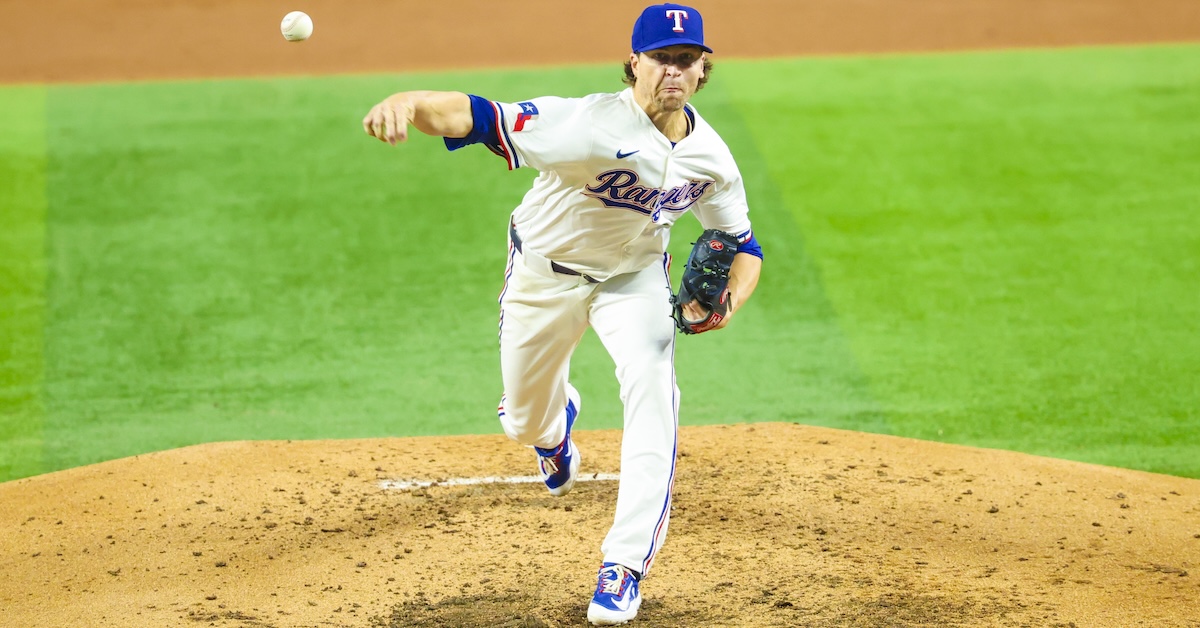
Nobody can nail the corners with every pitch. But pitchers can at least minimize the variance of their locations, finding relative reliability within the chaos of command. And in 2025, there is perhaps nobody more reliable than Jacob deGrom.
deGrom’s flat attack angle fastball and firm slider have (justifiably) built his reputation as a stuff monster. Even after easing up on the gas pedal this season, deGrom is still a darling in the eyes of the models. His overall Stuff+ is in the 80th percentile for starters with at least 30 innings pitched, fueled by his depth-y 89-mph slider. PitchingBot likes deGrom even more, ranking him in the top 10 among those pitchers. Over at Baseball Prospectus, the StuffPro model believes deGrom wields four pitches — his curveball and changeup, in addition to the heater and slider — that all grade out as plus.
deGrom’s unbelievable precision came to my attention while writing about Hunter Gaddis for a piece that was published on Monday. As part of my effort to discern whether Gaddis owed his early-season success to slider command (the verdict: inconclusive), I created a version of the Kirby Index for sliders to see where he landed. That metric measured the variance in release angles and release points and distilled those figures into a single score that captured command ability. Originally, it was designed for fastballs, which tend to be thrown to all parts of the strike zone. It perhaps works even better for sliders, which generally are thrown to fewer targets. Gaddis’ rank among his fellow pitchers was nothing remarkable, but deGrom’s name sitting at the very top caught my attention.
Minimum 50 sliders thrown to right-handed hitters.
As I wrote earlier this year, a more straightforward implementation of the Kirby Index would be to just measure the variance of the actual pitch locations. For this story, I calculated the standard deviation of the vertical and horizontal locations of a given pitcher’s sliders; once again, deGrom found himself at the top of the pack. Look at how much distance there is between him and the next closest pitcher:
Minimum 50 sliders thrown to right-handed hitters.
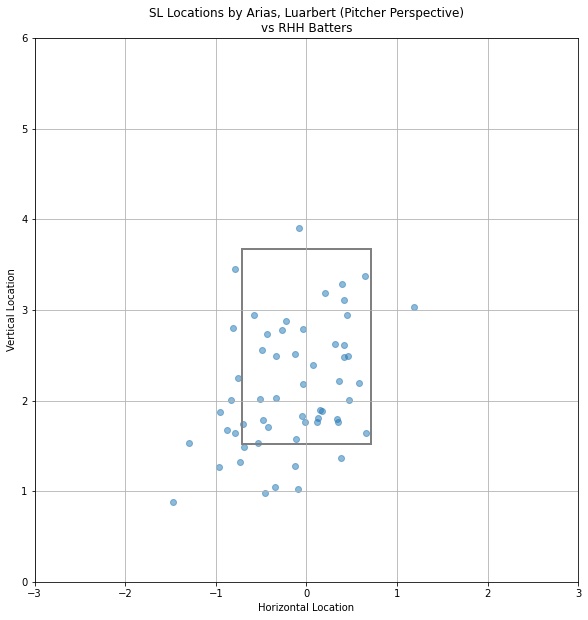
Random tangent here, but you have to admire Luarbert Arias for refusing to throw his junky 82-mph slider anywhere but inside the strike zone.
Anyway, measuring location densities, ultimately, could just point at pitchers who fill up the strike zone; the real test of command is a pitcher’s ability to hit his actual target. To that end, Driveline Baseball provided me with a sample of their proprietary miss distance data. Using Inside Edge tracking data, Driveline measures the distance from the intended target to the actual location of the pitch.
No surprise — deGrom’s slider miss distance ranked first among all pitchers. The league-average miss distance for sliders is about 12.5 inches; this year, deGrom is missing his target by under nine inches, nearly three standard deviations below the average. Any way you slice it, deGrom is commanding his slider like no one else in the sport.
The outcomes have been unassailable. So far, deGrom’s slider has returned a run value of -3.2 per 100 pitches thrown, the best mark for any slider thrown by a starting pitcher. Not only is he getting a bunch of swing and miss — a 38.1% whiff rate, as of this writing — it’s also grabbing a ton of called strikes. When batters do manage to put it in play, they can’t do much with it. The average launch angle on the pitch is just 2°; the xwOBA is a meek .227.
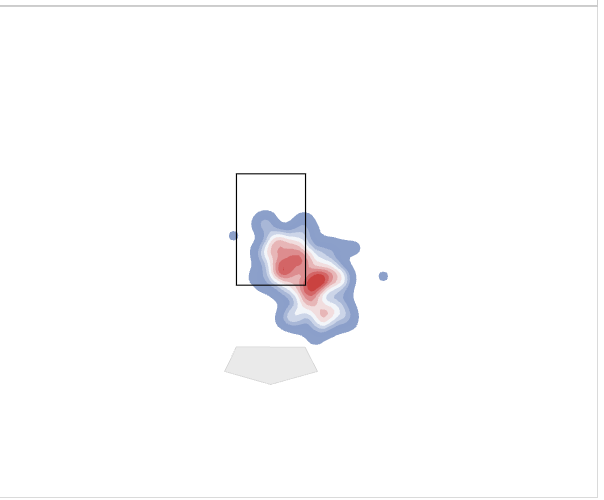
The harmless outcomes on balls in play are a function of deGrom’s targets. To right-handed hitters, he targets the classic low-away corner, breaking off the plate. Note the bimodal distribution on the heatmap — there’s a large concentration of sliders he’ll throw in the zone for strikes, and then another cluster right below the zone that generate chase.
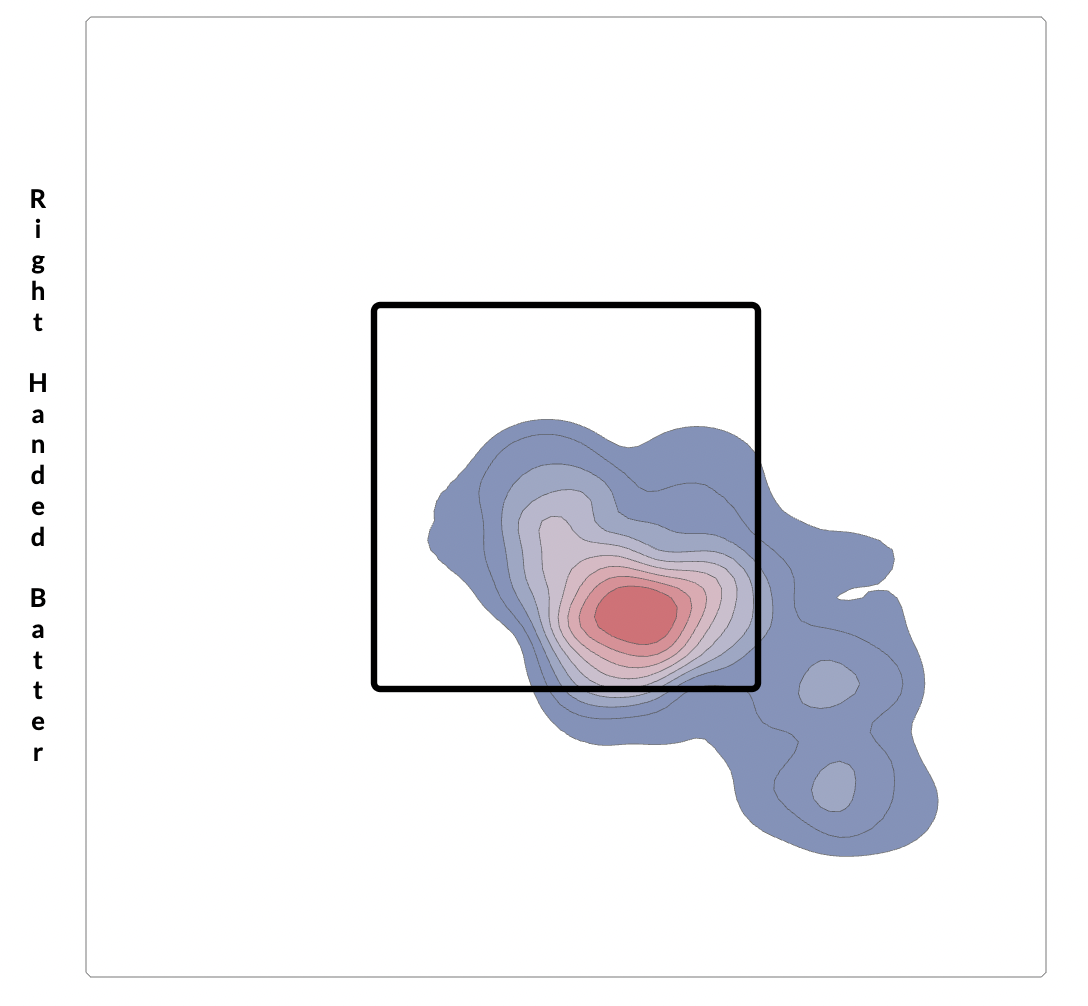
These intentions can be seen in the filtered heatmap clusters. When deGrom throws sliders to righties in zero-strike counts, he tends to be in the zone:
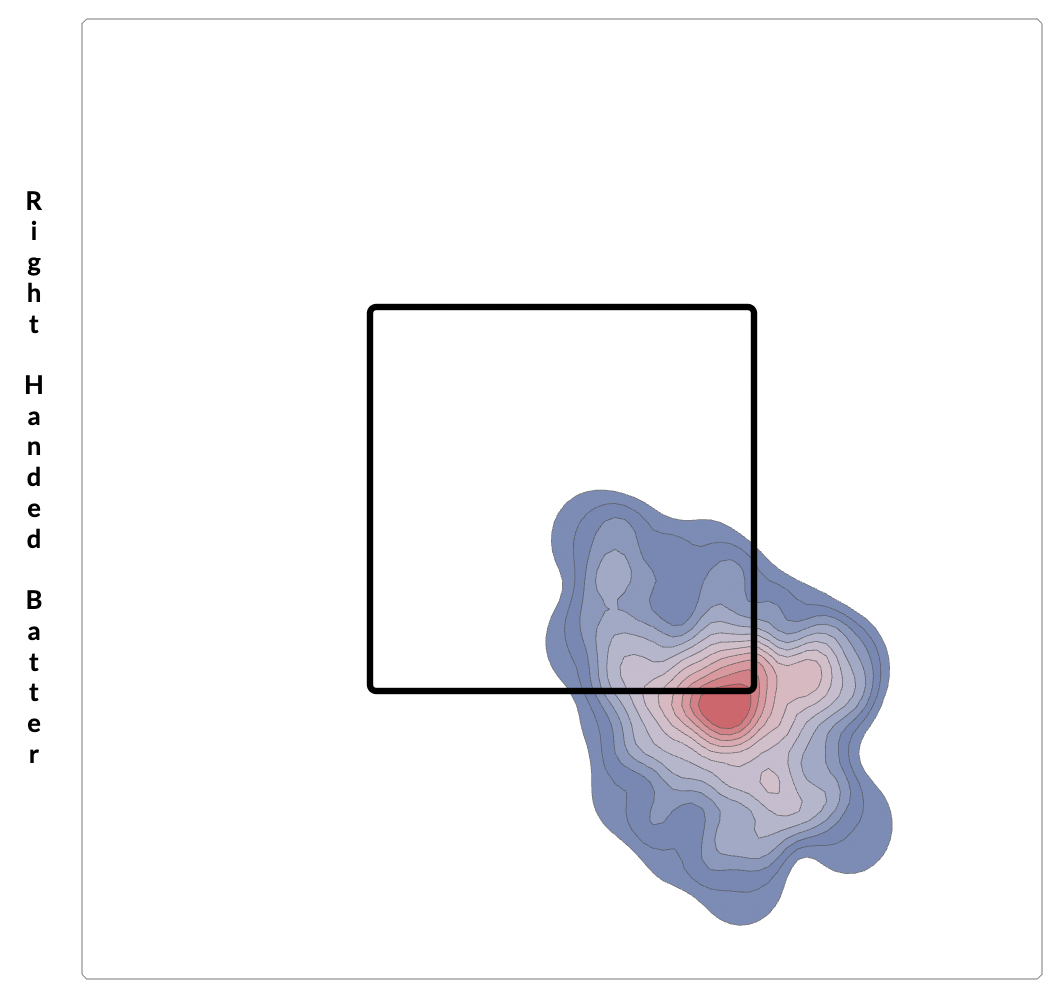
In two-strike counts, he chases the swing and miss:
To lefties, deGrom shows a similar bimodal distribution, but the pattern appears reversed. In early counts, he’s aiming just below the zone; in late counts, he’s looking for called strikes. This sequence to Athletics rookie Nick Kurtz, which featured four sliders, gives a sense of the approach. On 1-0 and 2-0, deGrom tries to bait a chase, but the big lefty resists.
Down 3-0, deGrom fires a middle-middle heater in an auto-take scenario, then returns to the slider in a 3-1 count. Here, deGrom dials in his robotic precision, dotting the lower edge of the strike zone to bring the count full.
On 3-2, he goes there again. Kurtz takes it and pays the price. Though the superimposed strike zone on the broadcast says this pitch is just low, my sense is he deserves that call; if he’s consistently landing pitches within inches of his intended target, you sort of just have to hand it to him.
deGrom isn’t just painting with the slider. I calculated the Kirby Index for four-seam fastballs thrown to righties in 2025; incredibly, he also sits in first place on that list.
Minimum 50 fastballs thrown to right-handed hitters.
As nice as it would be to think that deGrom can be just as good even after dropping two ticks off the fastball, it just isn’t true. Absent improvement elsewhere, losing stuff will bring him back to Earth. But deGrom is far from stagnant. In 2019 — his last full big league season, amid the most dominant phase of his career — his fastball command measured as below average by miss distance. Six years later, it’s hard to argue his command is anything but 80-grade. And as long as the elbow cooperates, it will help him defy gravity.
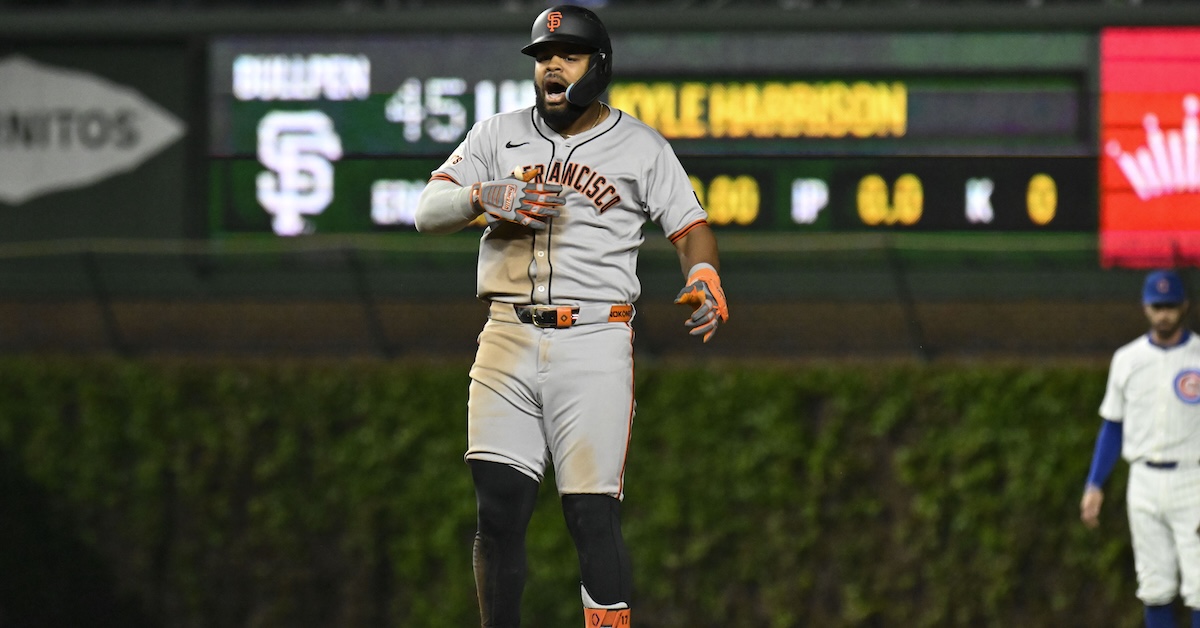
Things did not go well for the Cubs’ Ryan Pressly on Tuesday night against the Giants at Wrigley Field. Chicago had clawed its way back from a fourth-inning, 5-2 deficit, capped by a two-run, ninth-inning rally that sent the game into extra innings. After an uneventful 10th, all hell broke loose in the 11th, as Pressly failed to retire any of the eight batters he faced. By the time the dust settled, nine runs had scored, and unlike the Cubs’ April 18 game against the Diamondbacks, where they answered 10 eighth-inning runs with six of their own on the bottom of the frame and won 13-11, this time they fell 14-5.
As you might expect, it took a bad break or two to blow the doors open in that 11th inning. Following a double by Heliot Ramos and an RBI single by Patrick Bailey, Brett Wisely laid down a sacrifice bunt toward the first base side of the mound. Pressly fielded the ball and made an awkward, backhanded flip to Carson Kelly, but the ball dribbled under the catcher’s glove. Ramos was safe at home and Wisely reached first, still with nobody out. Mike Yastrzemski walked to load the bases, and then Willy Adames was hit by a pitch to force in Bailey. On the replay, it looked like a wild pitch that had gotten by Kelly, which would have advanced the runners and scored the run nonetheless, but home plate umpire Bill Miller ruled the ball had grazed Adames. The call was upheld after the Cubs challenged it, adding another baserunner to the mix, and consecutive singles by Jung Hoo Lee, Matt Chapman, and Wilmer Flores brought in four more runs (two on Chapman’s hit). With the score already a lopsided 11-5, Cubs manager Craig Counsell mercifully gave Pressly the hook.
The onslaught didn’t stop. Reliever Caleb Thielbar entered and finally recorded the first out by striking out Christian Koss before serving up an RBI double to Ramos. Bailey added a sacrifice fly before David Villar, pinch-hitting for Wisely, struck out. The Cubs went down in order against Kyle Harrison in the bottom of the 11th, and that was that. Read the rest of this entry »
I didn’t expect this from Wilyer Abreu. Don’t get me wrong. I love Abreu and I spent much of the offseason writing about him. I even developed a (literal) sliding scale to tabulate just how often and how intensely he dirtied his uniform. Abreu is a high-effort player who absolutely deserved the Rookie of the Year votes and Gold Glove he got last season. But I worried about him too. Abreu has done nothing but hit and play great defense since his 2023 debut, but he’s a lefty who’s been strictly platooned, and he only recently reached a full season’s worth of big league plate appearances. He seemed like a regression candidate, and that was before a gastrointestinal illness cost him a chunk of spring training and several pounds. The Red Sox weren’t even sure he’d be ready to start the season, but he was and he’s raked from day one. After this hot start, should we be all-in on Abreu?
First, I was worried a bit about Abreu’s defense. I didn’t expect him to turn into a pumpkin. He really was the best right fielder in baseball last season by pretty much any measure you can think of, and I expected him to remain great. Although he’s not a speedster, his instincts and effort have allowed him to make three three-star catches, two four-star catches, and one five-star catch this season. However, a ton of his value last year came from nine assists, and as I wrote in the Positional Power Rankings, that’s a volatile stat. You can’t just expect someone to rack up assists year after year, if for no other reason than the fact that word gets out about a rocket arm like Abreu’s. Those gaudy out totals would turn into smaller credits for keeping runners from taking extra bases. Or so I thought. Read the rest of this entry »
Lucas Giolito is looking to return to form following elbow surgery that cost him all of last year. Now 30 years old and in his first season on mound with the Boston Red Sox, Giolito has made a pair of starts — one solid, another squalid — in which he has surrendered 15 hits and nine runs over 9 2/3 innings. At his best, he’s been a top-of-the-rotation pitcher. From 2019-2021, the 6-foot-6 right-hander fashioned a 3.47 ERA and a 3.54 FIP while making a team-high 72 starts for the Chicago White Sox.
Turn the clock back 10 years, and Giolito sat atop our 2015 Washington Nationals Top Prospects list. Our then-lead prospect analyst Kiley McDaniel was understandably bullish about Giolito, writing that the 2012 first-round draft pick had true no. 1 upside.
What did Giolito’s FanGraphs scouting report look like at the time? Moreover, what does he think about it all these years later? Wanting to find out, I shared some of what McDaniel wrote and asked Giolito to respond to it.
———
“Giolito was nationally known by scouts all the way back to when he hit 95 mph at age 15.”
“I always threw hard,” Giolito said. “I was one of the hardest throwers in Little League and everything like that. I started long tossing a lot around the time I got to high school, and just kept building and building. I think I hit 90 when I was 14, and then 95 maybe closer to my 16th birthday. So yeah, it kept going up until I blew my elbow out.
“Probably,” Giolito responded when asked if the velocity was too much, too early. “There wasn’t too much understanding on the medical side, like strengthening, stability — all the stuff that we’re doing now to maintain the little muscles, the big muscles, to support your body when it’s outputting that much force. I was also very skinny. My shoulder blades winged out. I didn’t have much muscular development at that age, but I was moving very fast. It eventually caught up to me.”
“[He] was in the running to go 1-1 as one of the top prep pitchers of all time, until he was shut down with a sprained UCL in his elbow. This led to an expected Tommy John surgery one outing after he signed for an $800,000 overslot bonus as the 16th overall pick.”
“I remember having an outing where I think the Astros’ GM came to see me pitch in person,” Giolito said. “I pitched really well that day. I was on top of the world. It was like, ‘Oh my God, I might be the first-overall pick if I just continue what I’m doing for the rest of the season.’ It was the next outing, or maybe two outings later, where I hurt my elbow. I had to shut down. We didn’t want to do the full TJ yet, because we thought that would hurt me in the draft. Plus, if I was going to get TJ, I wanted to be in a professional organization where you get access to the best care. I tried to rehab it.
“Going into the draft, I had no idea,” added Giolito, a product of Harvard-Westlake High School. “I thought I’d be picked somewhere in the first three rounds, that a team would take a flier on me. I didn’t know I’d be in the first round. That was kind of the beginning of the pre-draft-deal era, but I literally was watching the draft on the TV when they said my name. That was when I found out I was drafted in the first round.
“The Nationals picked me. I was a prep arm with a blown-out elbow, which is a big, big risk. I have Stephen Strasburg to thank, because he was a big prospect who came up, blew his elbow out, got Tommy John, and had a relatively successful recovery from that. The Nationals kind of saw me in that same vein. It was, ‘OK, we’ll get this guy. He’ll have TJ, but we feel confident with this.’”
“The stuff was all the way back this year as he dominated Low-A at age 19/20 in his first full year coming off of surgery. The Nationals were understandably conservative with pitch and innings counts.”
“My first full season back they had my innings count at 100,” Giolito recalled. “I got to 100 innings and they shut me down, and that sucked, because our team was so good. Our starting rotation consisted of me, Reynaldo López, Nick Pivetta. Austin Voth was in the rotation, but he got sent up to High-A at some point that year. We had a really nasty one-two-three with me, Reynaldo, and Nick, but then I got shut down with a few weeks left in the season and had to be a cheerleader. We ended up losing in the playoffs.”
“His knockout curveball, which gets 65 or 70 grades from scouts, is his signature offspeed pitch.”
“Not any more,” replied the righty. “I still have it, but I don’t throw it as often. I always say that Tommy John gave me my changeup. When I was recovering I messed around with changeup grips a lot and found one that was comfortable. I threw it a lot in that same season you mentioned, that Low-A season. I threw a ton of changeups, because the curveball made my elbow hurt that first season back.
“My curveball was good in the minor leagues — I still used it — but we mixed that changeup in a lot. Over time, especially when I developed the slider, the changeup really became the big pitch for me.”
“He has true no. 1 starter upside.”
“Yeah, I mean, I had that with the White Sox for a couple of years,” Giolito said. “I still have confidence that I have true no. 1 starter upside. I just have to come back from this thing and develop some good consistency.”
Charlie Morton has been about to retire for a while now. The lanky curveball specialist first made headlines in the early 2010s; he’d been struggling over his first three major league seasons, so he came up with a novel, but hilariously simple, solution: Copy what Roy Halladay was doing. It worked for a while, but injuries piled up, and it wasn’t until Morton landed with the Astros in 2017 that he really, truly put it together.
In the first season of a two-year deal with the Astros, Morton set new career highs in wins, WAR, and strikeouts. He not only won a championship for the first time in his career, he was the winning pitcher in Game 7 of both the ALCS and the World Series, and got the last out of the season in the latter case. He turned 34 five days after the Astros’ championship parade, and by the following spring he was already musing publicly about hanging up his spikes. Read the rest of this entry »