For the 22nd consecutive season, the ZiPS projection system is unleashing a full set of prognostications. For more information on the ZiPS projections, please consult this year’s introduction, as well as MLB’s glossary entry. The team order is selected by lot, and the next team up is the Boston Red Sox.
Batters
After three years fumbling around the .500 mark and being firmly out of the AL East discussion, the Red Sox returned to the playoffs for the first time since 2021, and were still fighting for the AL East title as late as early September. The season ended with the unsatisfactory conclusion of dropping the Wild Card Series to the Yankees in three games. The Red Sox are a team I have lot of conflicting emotions about. I still don’t think the Mookie Betts situation was handled all that well, and I think they’ve missed some upside opportunities by generally being very quiet at trade deadlines. I also wonder if the whole Alex Bregman–Rafael Devers situation earlier this year could have been avoided with better communication. But this is also a franchise that does big things to improve the team; trading for Garrett Crochet was a huge play, signing Bregman last year was bold, and acquiring both Sonny Gray and Willson Contreras from the Cardinals in separate swaps this offseason were shrewd moves to target specific team problems. I guess the best way to describe the franchise now is “unsentimental.”
However they got here, ZiPS projects the lineup to be an incredibly solid, deep group, with the weakest spots — second base, third base, and catcher — still projecting to be average or better. This isn’t just an artifact of aggressive playing time projections, either, as ZiPS sees a lot of value in the the stable of backups and role players. That Boston was able to send prospects to the White Sox sufficient to land Crochet last offseason while still graduating several prospects to the majors reflects how quietly excellent the organization’s developmental pipeline has been.
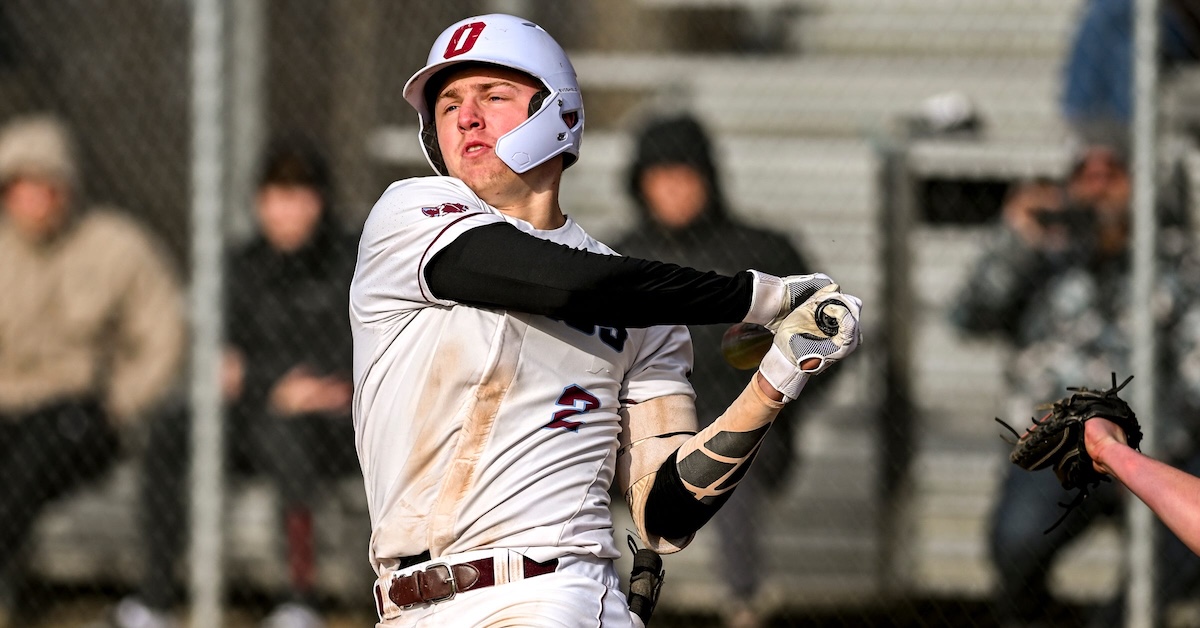
One can see why there’s so much talk about a possible Jarren Duran trade that may or may not involve Ketel Marte. Duran will get plenty of playing time in Boston, but he’s probably even more valuable to a team like Arizona than the Red Sox, who are without any real outfield holes now that Roman Anthony has successfully reached the majors. Kristian Campbell’s projection has taken a big hit, due to a lousy major league debut and a surprisingly underwhelming performance at Triple-A after his demotion; he still projects to have a solid future, though it may not be in Boston. I’m not predicting Trevor Story to be as healthy as our Depth Charts expect, but it was nice to see him get a fully healthy season in for the first time in a while.
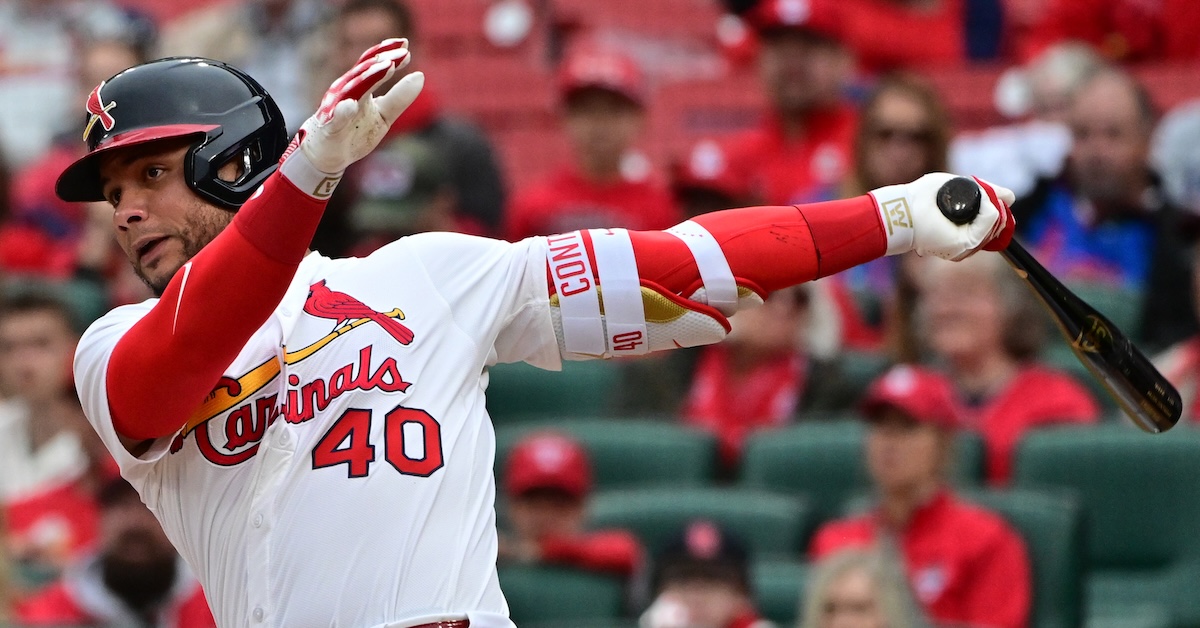
Adding Contreras was a particularly nice deal. If Duran is more valuable to another team than Boston, then Boston is arguably one of the absolute best places for Contreras. No, he isn’t a star, but the Red Sox are prime contenders, and that means they need certainty here rather than someone who could possibly bring higher upside. The Sox cobbled together replacements at first base after Triston Casas ruptured his patella, but that’s a tough position to cobble together offense for on the fly, and Red Sox first basemen only combined for a .244/.305/.386, -0.7 WAR line, easily the worst production at the position of any playoff team this year. Casas’ injury in 2025 and a fractured rib in 2024 cost him a lot of playing time, and even if there’s an expectation that he can turn things around, Boston is in a tough position to actually have to count on that. I still think Casas can have success in the majors, but it may simply be with a franchise that can take a riskier approach.
I’m actually mildly annoyed there isn’t more to complain about, since I’m a man who likes snark, and since I’m from Baltimore, any Red Sox success may hinder the Orioles.
Pitchers
If you asked me after the World Series what the Red Sox most needed in the pitching department, I’d have said a true no. 2 starter between Crochet at the top and their deep stable of mid-rotation starters. They addressed their biggest offensive weakness with a trade, and they did the same thing here, acquiring Gray from the Cardinals. And as with the Crochet trade, they did it without giving up anyone they desperately did not want to lose; Brandon Clarke could be a real plus for the Cardinals someday, but there are a lot of things that need to happen for him to get there.
Crochet has the second-best WAR projection for a pitcher in ZiPS, behind only Tarik Skubal, so there’s no ZiPS reasons to question Crochet’s bonafides as a beast of an ace. No other members of the rotation besides Crochet and Gray get amazing projections, but there are a lot of absolutely useful projections, good enough to make the Red Sox and most of their fans happy. Brayan Bello is a dependable number three, and ZiPS places Payton Tolle, Connelly Early, Kutter Crawford, Kyle Harrison, Patrick Sandoval, and Johan Oviedo in roughly the same tier of average-ish performance. Basically, pulling any two out of the hat gives the Sox one of the better 4/5 situations in the majors. And you can argue that basically all of them have an upside scenario that would at least put them at Gray-level performance, though I’m a little less bullish on Oviedo. A bunch of arms with question and upside is the Dodgers’ approach, and I think it’ll work well here.
Aroldis Chapman has some downside risk due to age, but he was terrific in 2025, when he cut out the walks that had long plagued his profile as his sinker increasingly became a larger part of his arsenal. It’s rare to see pitchers change what makes them successful as they approach 40, and outside of those age concerns, there’s no real reason to worry about him. The days of experimenting with Garrett Whitlock as a starter might be over, but he successfully came back from injury as a dynamite setup man. Likewise, Jordan Hicks is best used as a reliever. Of the projected bullpen, ZiPS is really uneasy about only Zack Kelly. It also thinks that Ryan Watson, a Rule 5 reliever picked up in a trade with the A’s, was a sneaky-good move.
All told, ZiPS thinks the Red Sox ought to eclipse 90 wins and be seriously in the fight for the AL East title. ZiPS also thinks that Boston has less downside than its competition, and an awful lot would have to go wrong for this team to go back to where it was from 2022-24.
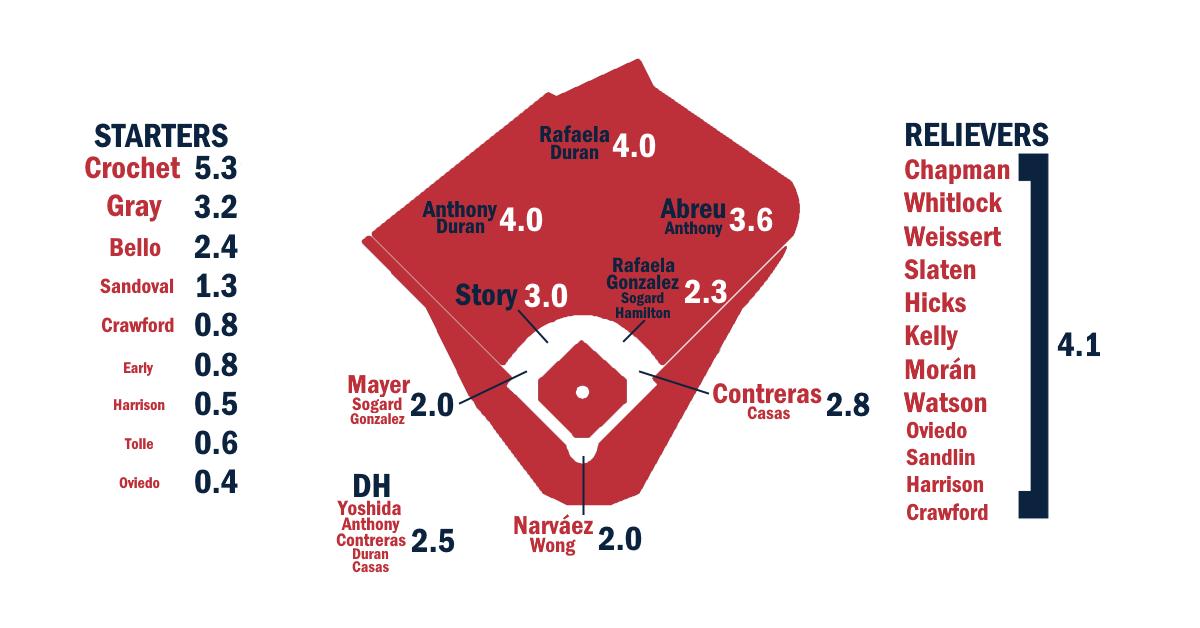
Ballpark graphic courtesy Eephus League. Depth charts constructed by way of those listed here. Size of player names is very roughly proportional to Depth Chart playing time. The final team projections may differ considerably from our Depth Chart playing time.
Batters – Advanced
| Player |
PA |
BA |
OBP |
SLG |
OPS+ |
ISO |
BABIP |
Def |
WAR |
wOBA |
3YOPS+ |
RC |
| Roman Anthony |
588 |
.267 |
.369 |
.443 |
126 |
.176 |
.341 |
7 |
4.0 |
.355 |
129 |
85 |
| Jarren Duran |
643 |
.259 |
.326 |
.445 |
113 |
.186 |
.320 |
11 |
3.7 |
.332 |
110 |
91 |
| Ceddanne Rafaela |
582 |
.264 |
.307 |
.430 |
103 |
.166 |
.313 |
11 |
3.6 |
.318 |
104 |
79 |
| Alex Bregman |
568 |
.251 |
.342 |
.415 |
111 |
.164 |
.266 |
2 |
3.1 |
.331 |
107 |
71 |
| Wilyer Abreu |
458 |
.245 |
.328 |
.438 |
112 |
.193 |
.297 |
9 |
2.5 |
.330 |
111 |
61 |
| Trevor Story |
543 |
.255 |
.301 |
.418 |
98 |
.163 |
.327 |
-2 |
2.4 |
.310 |
93 |
68 |
| Willson Contreras |
478 |
.254 |
.350 |
.443 |
120 |
.189 |
.315 |
1 |
2.2 |
.346 |
114 |
65 |
| Kristian Campbell |
559 |
.246 |
.336 |
.373 |
99 |
.126 |
.325 |
-4 |
1.8 |
.316 |
101 |
64 |
| Nate Eaton |
459 |
.246 |
.307 |
.386 |
93 |
.140 |
.312 |
4 |
1.8 |
.303 |
89 |
55 |
| David Hamilton |
374 |
.228 |
.298 |
.359 |
83 |
.131 |
.282 |
7 |
1.8 |
.291 |
84 |
46 |
| Carlos Narváez |
418 |
.224 |
.307 |
.362 |
87 |
.138 |
.291 |
3 |
1.6 |
.296 |
88 |
42 |
| Vinny Capra |
344 |
.244 |
.313 |
.351 |
86 |
.107 |
.298 |
7 |
1.5 |
.295 |
86 |
35 |
| Nathaniel Lowe |
590 |
.265 |
.341 |
.408 |
109 |
.143 |
.325 |
-1 |
1.5 |
.327 |
105 |
74 |
| Braiden Ward |
382 |
.246 |
.336 |
.331 |
88 |
.085 |
.321 |
0 |
1.4 |
.303 |
90 |
46 |
| Nick Sogard |
492 |
.248 |
.333 |
.343 |
90 |
.095 |
.311 |
-4 |
1.4 |
.303 |
91 |
53 |
| Franklin Arias |
517 |
.247 |
.294 |
.349 |
79 |
.102 |
.279 |
4 |
1.3 |
.282 |
84 |
54 |
| Masataka Yoshida |
398 |
.278 |
.339 |
.414 |
110 |
.136 |
.302 |
0 |
1.2 |
.328 |
105 |
51 |
| Marcelo Mayer |
353 |
.238 |
.295 |
.387 |
89 |
.149 |
.294 |
1 |
1.1 |
.296 |
93 |
38 |
| Triston Casas |
359 |
.239 |
.340 |
.426 |
113 |
.187 |
.290 |
-2 |
1.0 |
.333 |
113 |
45 |
| Ali Sánchez |
265 |
.240 |
.293 |
.347 |
79 |
.107 |
.305 |
5 |
1.0 |
.282 |
77 |
25 |
| Yasmani Grandal |
269 |
.231 |
.313 |
.345 |
84 |
.114 |
.272 |
0 |
0.9 |
.294 |
81 |
26 |
| Romy Gonzalez |
329 |
.266 |
.307 |
.426 |
102 |
.160 |
.338 |
4 |
0.9 |
.314 |
99 |
43 |
| Connor Wong |
351 |
.248 |
.309 |
.386 |
93 |
.138 |
.313 |
-8 |
0.6 |
.304 |
87 |
40 |
| Tristan Gray |
428 |
.223 |
.281 |
.379 |
83 |
.156 |
.291 |
0 |
0.6 |
.286 |
81 |
42 |
| Allan Castro |
472 |
.230 |
.299 |
.340 |
79 |
.110 |
.293 |
-1 |
0.5 |
.284 |
84 |
46 |
| Mikey Romero |
513 |
.229 |
.273 |
.394 |
84 |
.165 |
.299 |
-2 |
0.4 |
.288 |
90 |
53 |
| Elih Marrero |
161 |
.211 |
.280 |
.299 |
63 |
.088 |
.293 |
3 |
0.3 |
.261 |
63 |
14 |
| Trayce Thompson |
352 |
.210 |
.287 |
.365 |
81 |
.155 |
.306 |
-4 |
0.2 |
.286 |
75 |
35 |
| Seby Zavala |
252 |
.184 |
.264 |
.305 |
59 |
.121 |
.288 |
1 |
0.1 |
.255 |
55 |
18 |
| Jason Delay |
248 |
.218 |
.271 |
.284 |
56 |
.066 |
.282 |
3 |
0.1 |
.249 |
56 |
18 |
| A.J. Vukovich |
112 |
.190 |
.277 |
.330 |
69 |
.140 |
.262 |
0 |
0.1 |
.272 |
68 |
9 |
| Johanfran Garcia |
233 |
.206 |
.262 |
.327 |
64 |
.121 |
.282 |
-1 |
0.0 |
.260 |
73 |
19 |
| Ahbram Liendo |
477 |
.218 |
.279 |
.271 |
56 |
.053 |
.317 |
6 |
0.0 |
.249 |
63 |
40 |
| Matt Lloyd |
379 |
.234 |
.307 |
.368 |
88 |
.134 |
.306 |
-1 |
0.0 |
.295 |
86 |
40 |
| Brooks Brannon |
375 |
.226 |
.269 |
.339 |
69 |
.113 |
.330 |
-4 |
-0.1 |
.266 |
76 |
33 |
| Ronaldo Hernández |
291 |
.219 |
.268 |
.342 |
69 |
.123 |
.259 |
-4 |
-0.1 |
.267 |
69 |
25 |
| Corey Rosier |
391 |
.221 |
.296 |
.309 |
70 |
.088 |
.283 |
3 |
-0.1 |
.272 |
72 |
37 |
| Max Ferguson |
435 |
.197 |
.286 |
.281 |
60 |
.084 |
.266 |
-1 |
-0.3 |
.258 |
64 |
36 |
| Andruw Musett |
379 |
.205 |
.266 |
.282 |
54 |
.077 |
.281 |
-1 |
-0.4 |
.247 |
61 |
26 |
| Justin Gonzales |
395 |
.242 |
.299 |
.354 |
82 |
.112 |
.289 |
-9 |
-0.4 |
.288 |
85 |
42 |
| Yophery Rodriguez |
481 |
.210 |
.277 |
.312 |
65 |
.102 |
.270 |
7 |
-0.5 |
.262 |
69 |
41 |
| Tyler McDonough |
385 |
.227 |
.284 |
.320 |
69 |
.093 |
.319 |
-8 |
-0.5 |
.268 |
68 |
35 |
| Ronald Rosario |
403 |
.208 |
.262 |
.307 |
59 |
.099 |
.267 |
-4 |
-0.5 |
.253 |
63 |
31 |
| Phillip Sikes |
372 |
.200 |
.272 |
.316 |
64 |
.116 |
.297 |
3 |
-0.5 |
.261 |
65 |
32 |
| Miguel Bleis |
461 |
.202 |
.260 |
.319 |
61 |
.117 |
.258 |
7 |
-0.5 |
.257 |
67 |
41 |
| Freili Encarnacion |
452 |
.222 |
.268 |
.359 |
74 |
.137 |
.295 |
-7 |
-0.6 |
.274 |
79 |
43 |
| Drew Ehrhard |
232 |
.225 |
.272 |
.338 |
70 |
.113 |
.278 |
0 |
-0.6 |
.268 |
72 |
21 |
| Caden Rose |
280 |
.173 |
.262 |
.262 |
48 |
.089 |
.317 |
4 |
-0.8 |
.241 |
55 |
19 |
| Karson Simas |
308 |
.212 |
.270 |
.272 |
53 |
.060 |
.314 |
-3 |
-0.8 |
.245 |
54 |
23 |
| Juan Montero |
125 |
.171 |
.256 |
.216 |
35 |
.045 |
.271 |
0 |
-0.8 |
.221 |
41 |
7 |
| Marvin Alcantara |
504 |
.223 |
.268 |
.274 |
53 |
.051 |
.279 |
-1 |
-0.9 |
.243 |
57 |
37 |
| Nelly Taylor |
493 |
.195 |
.282 |
.296 |
62 |
.101 |
.290 |
-5 |
-0.9 |
.260 |
69 |
43 |
| Raudelis Martinez |
305 |
.201 |
.269 |
.272 |
53 |
.071 |
.236 |
3 |
-1.0 |
.245 |
55 |
20 |
| Hudson White |
265 |
.170 |
.235 |
.232 |
32 |
.062 |
.241 |
-2 |
-1.1 |
.213 |
35 |
13 |
| Nazzan Zanetello |
370 |
.170 |
.257 |
.276 |
50 |
.106 |
.310 |
-3 |
-1.1 |
.243 |
58 |
25 |
| Juan Chacon |
249 |
.201 |
.258 |
.262 |
47 |
.061 |
.311 |
0 |
-1.2 |
.235 |
49 |
18 |
| Antonio Anderson |
421 |
.196 |
.261 |
.274 |
51 |
.078 |
.300 |
-3 |
-1.4 |
.242 |
56 |
28 |
| Luis Ravelo |
294 |
.185 |
.245 |
.244 |
38 |
.059 |
.268 |
-3 |
-1.4 |
.222 |
44 |
16 |
| Nathan Hickey |
481 |
.210 |
.297 |
.347 |
80 |
.137 |
.287 |
-11 |
-1.5 |
.285 |
83 |
44 |
| Tyler Miller |
366 |
.204 |
.249 |
.307 |
55 |
.103 |
.267 |
0 |
-1.6 |
.245 |
60 |
28 |
| Fraymi De Leon |
314 |
.174 |
.233 |
.223 |
29 |
.049 |
.265 |
0 |
-1.6 |
.209 |
35 |
19 |
| Albert Feliz |
270 |
.171 |
.222 |
.283 |
40 |
.112 |
.313 |
-3 |
-1.9 |
.224 |
46 |
16 |
Batters – Top Near-Age Offensive Comps
Batters – 80th/20th Percentiles
| Player |
80th BA |
80th OBP |
80th SLG |
80th OPS+ |
80th WAR |
20th BA |
20th OBP |
20th SLG |
20th OPS+ |
20th WAR |
| Roman Anthony |
.297 |
.401 |
.500 |
149 |
5.5 |
.238 |
.344 |
.395 |
107 |
2.4 |
| Jarren Duran |
.284 |
.352 |
.490 |
132 |
5.3 |
.231 |
.302 |
.392 |
93 |
2.1 |
| Ceddanne Rafaela |
.290 |
.332 |
.479 |
123 |
5.1 |
.239 |
.283 |
.381 |
85 |
2.2 |
| Alex Bregman |
.276 |
.368 |
.466 |
131 |
4.5 |
.224 |
.313 |
.366 |
91 |
1.6 |
| Wilyer Abreu |
.270 |
.353 |
.497 |
133 |
3.7 |
.221 |
.302 |
.389 |
94 |
1.6 |
| Trevor Story |
.281 |
.325 |
.469 |
119 |
3.9 |
.224 |
.270 |
.370 |
77 |
0.9 |
| Willson Contreras |
.282 |
.379 |
.495 |
141 |
3.3 |
.228 |
.326 |
.392 |
101 |
1.1 |
| Kristian Campbell |
.274 |
.361 |
.417 |
118 |
3.1 |
.220 |
.308 |
.333 |
81 |
0.5 |
| Nate Eaton |
.271 |
.333 |
.435 |
111 |
2.9 |
.215 |
.278 |
.339 |
74 |
0.7 |
| David Hamilton |
.258 |
.332 |
.417 |
106 |
2.9 |
.200 |
.270 |
.316 |
65 |
0.8 |
| Carlos Narváez |
.256 |
.337 |
.410 |
107 |
2.7 |
.197 |
.279 |
.313 |
65 |
0.5 |
| Vinny Capra |
.269 |
.339 |
.392 |
103 |
2.3 |
.212 |
.286 |
.307 |
66 |
0.7 |
| Nathaniel Lowe |
.291 |
.366 |
.451 |
126 |
2.8 |
.237 |
.310 |
.365 |
89 |
0.1 |
| Braiden Ward |
.274 |
.359 |
.373 |
105 |
2.2 |
.216 |
.306 |
.292 |
70 |
0.5 |
| Nick Sogard |
.278 |
.358 |
.389 |
111 |
2.5 |
.220 |
.302 |
.298 |
70 |
0.2 |
| Franklin Arias |
.271 |
.319 |
.394 |
98 |
2.5 |
.219 |
.269 |
.310 |
61 |
0.1 |
| Masataka Yoshida |
.309 |
.367 |
.461 |
129 |
2.2 |
.246 |
.311 |
.364 |
89 |
0.1 |
| Marcelo Mayer |
.267 |
.321 |
.447 |
111 |
2.1 |
.213 |
.268 |
.344 |
71 |
0.3 |
| Triston Casas |
.265 |
.365 |
.485 |
133 |
1.9 |
.213 |
.316 |
.372 |
93 |
0.2 |
| Ali Sánchez |
.278 |
.327 |
.391 |
99 |
1.7 |
.210 |
.261 |
.302 |
59 |
0.4 |
| Yasmani Grandal |
.263 |
.346 |
.397 |
107 |
1.6 |
.197 |
.281 |
.294 |
63 |
0.2 |
| Romy Gonzalez |
.298 |
.337 |
.477 |
124 |
1.7 |
.232 |
.272 |
.368 |
79 |
-0.1 |
| Connor Wong |
.276 |
.340 |
.437 |
114 |
1.5 |
.220 |
.280 |
.336 |
74 |
-0.3 |
| Tristan Gray |
.246 |
.303 |
.429 |
101 |
1.5 |
.194 |
.256 |
.341 |
67 |
-0.3 |
| Allan Castro |
.260 |
.328 |
.388 |
98 |
1.7 |
.204 |
.273 |
.295 |
61 |
-0.5 |
| Mikey Romero |
.257 |
.301 |
.448 |
105 |
1.7 |
.205 |
.251 |
.342 |
66 |
-0.7 |
| Elih Marrero |
.245 |
.316 |
.343 |
85 |
0.8 |
.182 |
.247 |
.257 |
42 |
-0.1 |
| Trayce Thompson |
.241 |
.316 |
.427 |
105 |
1.2 |
.180 |
.257 |
.309 |
60 |
-0.7 |
| Seby Zavala |
.214 |
.298 |
.362 |
79 |
0.7 |
.155 |
.235 |
.254 |
38 |
-0.6 |
| Jason Delay |
.252 |
.311 |
.331 |
78 |
0.8 |
.187 |
.239 |
.240 |
35 |
-0.5 |
| A.J. Vukovich |
.221 |
.307 |
.388 |
92 |
0.4 |
.165 |
.247 |
.275 |
48 |
-0.2 |
| Johanfran Garcia |
.239 |
.291 |
.388 |
88 |
0.7 |
.176 |
.231 |
.271 |
42 |
-0.6 |
| Ahbram Liendo |
.248 |
.312 |
.309 |
74 |
1.2 |
.189 |
.251 |
.235 |
39 |
-1.1 |
| Matt Lloyd |
.261 |
.337 |
.412 |
107 |
0.9 |
.205 |
.278 |
.321 |
67 |
-1.0 |
| Brooks Brannon |
.257 |
.299 |
.394 |
92 |
0.9 |
.196 |
.242 |
.282 |
48 |
-1.2 |
| Ronaldo Hernández |
.248 |
.296 |
.395 |
90 |
0.6 |
.191 |
.239 |
.295 |
49 |
-0.9 |
| Corey Rosier |
.246 |
.325 |
.355 |
87 |
0.7 |
.195 |
.269 |
.275 |
52 |
-1.0 |
| Max Ferguson |
.225 |
.315 |
.321 |
79 |
0.7 |
.172 |
.264 |
.247 |
44 |
-1.2 |
| Andruw Musett |
.239 |
.301 |
.338 |
78 |
0.7 |
.176 |
.235 |
.249 |
37 |
-1.2 |
| Justin Gonzales |
.270 |
.329 |
.404 |
105 |
0.6 |
.210 |
.269 |
.310 |
64 |
-1.4 |
| Yophery Rodriguez |
.239 |
.305 |
.360 |
85 |
0.7 |
.181 |
.248 |
.268 |
46 |
-1.6 |
| Tyler McDonough |
.261 |
.313 |
.371 |
88 |
0.5 |
.202 |
.258 |
.281 |
52 |
-1.3 |
| Ronald Rosario |
.241 |
.294 |
.364 |
83 |
0.7 |
.177 |
.234 |
.268 |
40 |
-1.5 |
| Phillip Sikes |
.228 |
.300 |
.367 |
85 |
0.4 |
.173 |
.245 |
.277 |
46 |
-1.4 |
| Miguel Bleis |
.228 |
.286 |
.366 |
78 |
0.4 |
.178 |
.239 |
.284 |
46 |
-1.5 |
| Freili Encarnacion |
.252 |
.294 |
.416 |
94 |
0.5 |
.193 |
.239 |
.313 |
54 |
-1.8 |
| Drew Ehrhard |
.256 |
.304 |
.391 |
92 |
0.1 |
.199 |
.245 |
.290 |
51 |
-1.1 |
| Caden Rose |
.199 |
.290 |
.310 |
68 |
-0.1 |
.145 |
.236 |
.213 |
29 |
-1.5 |
| Karson Simas |
.238 |
.297 |
.309 |
70 |
-0.1 |
.182 |
.240 |
.236 |
34 |
-1.5 |
| Juan Montero |
.196 |
.282 |
.255 |
52 |
-0.5 |
.143 |
.227 |
.177 |
18 |
-1.1 |
| Marvin Alcantara |
.251 |
.299 |
.310 |
70 |
0.3 |
.198 |
.246 |
.241 |
39 |
-1.7 |
| Nelly Taylor |
.222 |
.311 |
.341 |
82 |
0.3 |
.170 |
.257 |
.256 |
46 |
-1.9 |
| Raudelis Martinez |
.231 |
.300 |
.307 |
69 |
-0.3 |
.174 |
.241 |
.234 |
35 |
-1.7 |
| Hudson White |
.206 |
.269 |
.278 |
53 |
-0.4 |
.141 |
.206 |
.194 |
14 |
-1.7 |
| Nazzan Zanetello |
.199 |
.290 |
.330 |
72 |
0.0 |
.138 |
.229 |
.228 |
29 |
-2.0 |
| Juan Chacon |
.230 |
.291 |
.306 |
66 |
-0.6 |
.169 |
.227 |
.223 |
28 |
-1.8 |
| Antonio Anderson |
.227 |
.288 |
.323 |
69 |
-0.4 |
.171 |
.231 |
.232 |
33 |
-2.3 |
| Luis Ravelo |
.218 |
.276 |
.294 |
58 |
-0.6 |
.156 |
.213 |
.201 |
17 |
-2.2 |
| Nathan Hickey |
.234 |
.322 |
.392 |
98 |
-0.4 |
.183 |
.267 |
.299 |
60 |
-2.7 |
| Tyler Miller |
.234 |
.280 |
.353 |
73 |
-0.7 |
.181 |
.225 |
.261 |
37 |
-2.4 |
| Fraymi De Leon |
.198 |
.263 |
.260 |
45 |
-0.9 |
.146 |
.211 |
.189 |
13 |
-2.2 |
| Albert Feliz |
.202 |
.250 |
.327 |
59 |
-1.2 |
.145 |
.192 |
.229 |
20 |
-2.6 |
Batters – Platoon Splits
| Player |
BA vs. L |
OBP vs. L |
SLG vs. L |
BA vs. R |
OBP vs. R |
SLG vs. R |
| Roman Anthony |
.266 |
.362 |
.430 |
.268 |
.371 |
.448 |
| Jarren Duran |
.247 |
.311 |
.388 |
.264 |
.332 |
.470 |
| Ceddanne Rafaela |
.262 |
.304 |
.448 |
.265 |
.308 |
.422 |
| Alex Bregman |
.253 |
.347 |
.413 |
.250 |
.339 |
.416 |
| Wilyer Abreu |
.232 |
.312 |
.376 |
.251 |
.334 |
.466 |
| Trevor Story |
.266 |
.312 |
.455 |
.251 |
.296 |
.403 |
| Willson Contreras |
.265 |
.359 |
.469 |
.250 |
.347 |
.433 |
| Kristian Campbell |
.255 |
.346 |
.387 |
.243 |
.333 |
.367 |
| Nate Eaton |
.250 |
.318 |
.404 |
.244 |
.302 |
.376 |
| David Hamilton |
.221 |
.283 |
.327 |
.232 |
.305 |
.373 |
| Carlos Narváez |
.230 |
.317 |
.385 |
.222 |
.302 |
.351 |
| Vinny Capra |
.252 |
.325 |
.364 |
.239 |
.306 |
.343 |
| Nathaniel Lowe |
.257 |
.329 |
.388 |
.268 |
.345 |
.416 |
| Braiden Ward |
.235 |
.337 |
.329 |
.250 |
.336 |
.332 |
| Nick Sogard |
.255 |
.335 |
.358 |
.244 |
.331 |
.336 |
| Franklin Arias |
.252 |
.301 |
.356 |
.245 |
.291 |
.346 |
| Masataka Yoshida |
.263 |
.327 |
.374 |
.284 |
.344 |
.429 |
| Marcelo Mayer |
.231 |
.283 |
.341 |
.241 |
.299 |
.405 |
| Triston Casas |
.227 |
.324 |
.402 |
.244 |
.347 |
.437 |
| Ali Sánchez |
.238 |
.293 |
.357 |
.241 |
.292 |
.342 |
| Yasmani Grandal |
.230 |
.319 |
.361 |
.232 |
.312 |
.339 |
| Romy Gonzalez |
.278 |
.326 |
.468 |
.257 |
.293 |
.397 |
| Connor Wong |
.250 |
.315 |
.393 |
.246 |
.305 |
.382 |
| Tristan Gray |
.214 |
.268 |
.344 |
.228 |
.288 |
.398 |
| Allan Castro |
.226 |
.291 |
.339 |
.231 |
.301 |
.340 |
| Mikey Romero |
.212 |
.260 |
.364 |
.234 |
.277 |
.404 |
| Elih Marrero |
.220 |
.278 |
.320 |
.206 |
.280 |
.289 |
| Trayce Thompson |
.213 |
.295 |
.380 |
.208 |
.283 |
.357 |
| Seby Zavala |
.189 |
.282 |
.338 |
.181 |
.255 |
.289 |
| Jason Delay |
.228 |
.282 |
.278 |
.213 |
.265 |
.287 |
| A.J. Vukovich |
.200 |
.282 |
.343 |
.185 |
.274 |
.323 |
| Johanfran Garcia |
.212 |
.264 |
.333 |
.203 |
.261 |
.324 |
| Ahbram Liendo |
.232 |
.297 |
.296 |
.213 |
.272 |
.261 |
| Matt Lloyd |
.223 |
.288 |
.340 |
.239 |
.314 |
.379 |
| Brooks Brannon |
.223 |
.266 |
.340 |
.227 |
.271 |
.339 |
| Ronaldo Hernández |
.226 |
.277 |
.366 |
.216 |
.263 |
.330 |
| Corey Rosier |
.206 |
.278 |
.268 |
.226 |
.302 |
.325 |
| Max Ferguson |
.193 |
.279 |
.266 |
.199 |
.289 |
.287 |
| Andruw Musett |
.204 |
.275 |
.306 |
.205 |
.263 |
.273 |
| Justin Gonzales |
.245 |
.304 |
.377 |
.240 |
.296 |
.345 |
| Yophery Rodriguez |
.198 |
.264 |
.288 |
.213 |
.281 |
.320 |
| Tyler McDonough |
.228 |
.282 |
.327 |
.226 |
.285 |
.317 |
| Ronald Rosario |
.225 |
.279 |
.324 |
.201 |
.255 |
.301 |
| Phillip Sikes |
.218 |
.292 |
.337 |
.192 |
.263 |
.308 |
| Miguel Bleis |
.202 |
.261 |
.315 |
.202 |
.260 |
.321 |
| Freili Encarnacion |
.222 |
.267 |
.373 |
.222 |
.268 |
.354 |
| Drew Ehrhard |
.239 |
.292 |
.373 |
.219 |
.263 |
.322 |
| Caden Rose |
.173 |
.271 |
.267 |
.173 |
.258 |
.260 |
| Karson Simas |
.218 |
.277 |
.287 |
.209 |
.268 |
.265 |
| Juan Montero |
.176 |
.282 |
.235 |
.169 |
.244 |
.208 |
| Marvin Alcantara |
.231 |
.279 |
.285 |
.220 |
.264 |
.270 |
| Nelly Taylor |
.191 |
.274 |
.282 |
.196 |
.285 |
.301 |
| Raudelis Martinez |
.194 |
.263 |
.264 |
.204 |
.272 |
.276 |
| Hudson White |
.173 |
.241 |
.267 |
.169 |
.232 |
.217 |
| Nazzan Zanetello |
.177 |
.269 |
.281 |
.167 |
.252 |
.274 |
| Juan Chacon |
.203 |
.267 |
.275 |
.200 |
.254 |
.256 |
| Antonio Anderson |
.206 |
.268 |
.284 |
.192 |
.259 |
.270 |
| Luis Ravelo |
.184 |
.241 |
.250 |
.186 |
.246 |
.242 |
| Nathan Hickey |
.196 |
.275 |
.299 |
.215 |
.305 |
.363 |
| Tyler Miller |
.193 |
.234 |
.261 |
.207 |
.255 |
.323 |
| Fraymi De Leon |
.174 |
.234 |
.209 |
.174 |
.233 |
.229 |
| Albert Feliz |
.176 |
.225 |
.284 |
.169 |
.221 |
.282 |
Pitcher – Standard
| Player |
T |
Age |
W |
L |
ERA |
G |
GS |
IP |
H |
ER |
HR |
BB |
SO |
| Garrett Crochet |
L |
27 |
15 |
6 |
2.78 |
30 |
30 |
184.3 |
152 |
57 |
18 |
49 |
230 |
| Sonny Gray |
R |
36 |
11 |
8 |
3.74 |
27 |
27 |
154.0 |
147 |
64 |
19 |
41 |
160 |
| Brayan Bello |
R |
27 |
11 |
10 |
4.02 |
31 |
30 |
163.3 |
157 |
73 |
17 |
58 |
136 |
| Garrett Whitlock |
R |
30 |
6 |
3 |
3.17 |
45 |
5 |
71.0 |
61 |
25 |
7 |
18 |
81 |
| Connelly Early |
L |
24 |
8 |
7 |
4.07 |
24 |
21 |
108.3 |
99 |
49 |
12 |
40 |
110 |
| Payton Tolle |
L |
23 |
5 |
4 |
4.15 |
28 |
21 |
102.0 |
95 |
47 |
15 |
30 |
106 |
| Aroldis Chapman |
L |
38 |
5 |
2 |
2.92 |
56 |
0 |
49.3 |
35 |
16 |
4 |
22 |
71 |
| Tanner Houck |
R |
30 |
6 |
5 |
4.00 |
19 |
17 |
100.7 |
99 |
48 |
10 |
33 |
79 |
| Kyle Harrison |
L |
24 |
5 |
4 |
4.34 |
27 |
23 |
110.0 |
104 |
53 |
14 |
44 |
107 |
| Johan Oviedo |
R |
28 |
6 |
5 |
4.28 |
22 |
20 |
96.7 |
87 |
46 |
12 |
41 |
93 |
| Patrick Sandoval |
L |
29 |
6 |
5 |
4.21 |
17 |
17 |
87.7 |
88 |
41 |
8 |
39 |
78 |
| Tyler Uberstine |
R |
27 |
5 |
5 |
4.38 |
22 |
18 |
100.7 |
101 |
49 |
13 |
35 |
88 |
| Lucas Giolito |
R |
31 |
7 |
8 |
4.65 |
27 |
27 |
137.3 |
137 |
71 |
21 |
53 |
123 |
| John Holobetz |
R |
23 |
5 |
6 |
4.49 |
21 |
17 |
110.3 |
116 |
55 |
14 |
31 |
80 |
| Kutter Crawford |
R |
30 |
6 |
7 |
4.47 |
21 |
18 |
104.7 |
100 |
52 |
16 |
32 |
90 |
| Yordanny Monegro |
R |
23 |
4 |
4 |
4.28 |
21 |
19 |
75.7 |
73 |
36 |
10 |
27 |
69 |
| Josh Winckowski |
R |
28 |
5 |
4 |
4.13 |
32 |
9 |
80.7 |
84 |
37 |
9 |
26 |
63 |
| Shane Drohan |
L |
27 |
5 |
5 |
4.62 |
19 |
17 |
74.0 |
72 |
38 |
9 |
33 |
63 |
| David Sandlin |
R |
25 |
6 |
6 |
4.62 |
27 |
13 |
87.7 |
93 |
45 |
13 |
30 |
69 |
| Ryan Watson |
R |
28 |
4 |
3 |
4.15 |
36 |
5 |
60.7 |
61 |
28 |
7 |
20 |
50 |
| Jovani Morán |
L |
29 |
3 |
1 |
3.74 |
33 |
3 |
43.3 |
38 |
18 |
4 |
19 |
48 |
| Eduardo Rivera |
L |
23 |
4 |
5 |
4.77 |
20 |
14 |
77.3 |
74 |
41 |
10 |
40 |
70 |
| Hayden Mullins |
L |
25 |
4 |
5 |
4.83 |
21 |
19 |
85.7 |
82 |
46 |
11 |
44 |
78 |
| Blake Wehunt |
R |
25 |
4 |
6 |
4.78 |
18 |
18 |
69.7 |
71 |
37 |
10 |
28 |
57 |
| Jordan Hicks |
R |
29 |
4 |
5 |
4.56 |
34 |
11 |
73.0 |
71 |
37 |
7 |
34 |
66 |
| Jake Bennett |
L |
25 |
3 |
4 |
4.68 |
18 |
18 |
67.3 |
72 |
35 |
9 |
22 |
46 |
| Jack Anderson |
R |
26 |
4 |
4 |
4.52 |
27 |
5 |
71.7 |
76 |
36 |
10 |
20 |
57 |
| Dalton Rogers |
L |
25 |
4 |
6 |
4.86 |
21 |
16 |
87.0 |
87 |
47 |
12 |
50 |
76 |
| Bryan Mata |
R |
27 |
3 |
3 |
4.50 |
32 |
5 |
62.0 |
58 |
31 |
7 |
31 |
60 |
| José De León |
R |
33 |
4 |
4 |
4.83 |
20 |
11 |
69.0 |
70 |
37 |
10 |
31 |
62 |
| Justin Wilson |
L |
38 |
2 |
2 |
3.79 |
49 |
0 |
38.0 |
38 |
16 |
4 |
15 |
41 |
| Greg Weissert |
R |
31 |
5 |
4 |
4.10 |
62 |
0 |
59.3 |
56 |
27 |
7 |
21 |
54 |
| Justin Slaten |
R |
28 |
4 |
3 |
4.01 |
37 |
1 |
42.7 |
39 |
19 |
5 |
16 |
40 |
| Isaac Coffey |
R |
26 |
4 |
5 |
5.09 |
19 |
16 |
74.3 |
73 |
42 |
11 |
32 |
61 |
| Tyler Samaniego |
L |
27 |
3 |
2 |
4.21 |
31 |
1 |
36.3 |
36 |
17 |
4 |
14 |
30 |
| Osvaldo Berrios |
R |
26 |
4 |
4 |
4.76 |
31 |
5 |
58.7 |
63 |
31 |
8 |
21 |
43 |
| Zack Kelly |
R |
31 |
3 |
3 |
4.47 |
47 |
2 |
56.3 |
51 |
28 |
7 |
28 |
54 |
| Alec Gamboa |
L |
29 |
3 |
5 |
5.03 |
20 |
5 |
53.7 |
58 |
30 |
6 |
28 |
33 |
| Liam Hendriks |
R |
37 |
2 |
1 |
4.43 |
25 |
1 |
22.3 |
21 |
11 |
3 |
9 |
24 |
| Caleb Bolden |
R |
27 |
3 |
4 |
5.11 |
21 |
8 |
56.3 |
59 |
32 |
8 |
27 |
42 |
| Wyatt Mills |
R |
31 |
2 |
3 |
4.95 |
30 |
5 |
43.7 |
44 |
24 |
6 |
20 |
35 |
| John Stankiewicz |
R |
27 |
4 |
5 |
4.82 |
37 |
2 |
52.3 |
56 |
28 |
7 |
22 |
38 |
| Jeremy Wu-Yelland |
L |
27 |
2 |
1 |
4.78 |
22 |
0 |
37.7 |
35 |
20 |
5 |
18 |
39 |
| Reidis Sena |
R |
25 |
3 |
4 |
5.01 |
26 |
2 |
41.3 |
40 |
23 |
5 |
25 |
37 |
| Hobie Harris |
R |
33 |
2 |
3 |
4.76 |
33 |
1 |
39.7 |
42 |
21 |
5 |
20 |
32 |
| Austin Adams |
R |
35 |
1 |
1 |
4.91 |
29 |
1 |
25.7 |
21 |
14 |
3 |
18 |
33 |
| Christopher Troye |
R |
27 |
2 |
2 |
4.89 |
25 |
0 |
35.0 |
33 |
19 |
4 |
23 |
33 |
| Gabriel Jackson |
R |
24 |
3 |
4 |
5.18 |
22 |
4 |
57.3 |
64 |
33 |
8 |
26 |
32 |
| Cooper Adams |
R |
26 |
3 |
3 |
5.05 |
28 |
2 |
62.3 |
66 |
35 |
9 |
25 |
46 |
| Noah Song |
R |
29 |
1 |
3 |
5.32 |
26 |
4 |
45.7 |
48 |
27 |
7 |
24 |
37 |
| Jacob Webb |
R |
27 |
3 |
5 |
5.13 |
32 |
2 |
52.7 |
54 |
30 |
7 |
26 |
41 |
| Brendan Cellucci |
L |
28 |
2 |
3 |
5.02 |
27 |
1 |
43.0 |
43 |
24 |
6 |
27 |
38 |
| Wyatt Olds |
R |
26 |
4 |
6 |
5.32 |
35 |
4 |
67.7 |
64 |
40 |
9 |
41 |
59 |
| Zach Bryant |
R |
28 |
2 |
2 |
5.35 |
27 |
0 |
38.7 |
41 |
23 |
6 |
19 |
29 |
| Jorge Juan |
R |
27 |
2 |
4 |
5.55 |
29 |
0 |
35.7 |
34 |
22 |
5 |
23 |
32 |
Pitcher – Advanced
| Player |
IP |
K/9 |
BB/9 |
HR/9 |
BB% |
K% |
BABIP |
ERA+ |
3ERA+ |
FIP |
ERA- |
WAR |
| Garrett Crochet |
184.3 |
11.2 |
2.4 |
0.9 |
6.5% |
30.6% |
.300 |
150 |
144 |
2.80 |
67 |
5.0 |
| Sonny Gray |
154.0 |
9.4 |
2.4 |
1.1 |
6.4% |
24.8% |
.305 |
112 |
103 |
3.57 |
90 |
2.7 |
| Brayan Bello |
163.3 |
7.5 |
3.2 |
0.9 |
8.3% |
19.5% |
.290 |
104 |
104 |
4.08 |
96 |
2.3 |
| Garrett Whitlock |
71.0 |
10.3 |
2.3 |
0.9 |
6.2% |
27.9% |
.297 |
132 |
127 |
3.05 |
76 |
1.6 |
| Connelly Early |
108.3 |
9.1 |
3.3 |
1.0 |
8.7% |
23.8% |
.295 |
103 |
105 |
3.96 |
97 |
1.5 |
| Payton Tolle |
102.0 |
9.4 |
2.6 |
1.3 |
7.0% |
24.8% |
.293 |
101 |
106 |
3.97 |
99 |
1.3 |
| Aroldis Chapman |
49.3 |
13.0 |
4.0 |
0.7 |
10.6% |
34.3% |
.295 |
143 |
126 |
2.74 |
70 |
1.2 |
| Tanner Houck |
100.7 |
7.1 |
2.9 |
0.9 |
7.7% |
18.4% |
.292 |
97 |
97 |
4.11 |
103 |
1.2 |
| Kyle Harrison |
110.0 |
8.8 |
3.6 |
1.1 |
9.3% |
22.7% |
.295 |
96 |
101 |
4.26 |
104 |
1.2 |
| Johan Oviedo |
96.7 |
8.7 |
3.8 |
1.1 |
9.9% |
22.4% |
.283 |
97 |
99 |
4.34 |
103 |
1.1 |
| Patrick Sandoval |
87.7 |
8.0 |
4.0 |
0.8 |
10.1% |
20.1% |
.309 |
99 |
100 |
4.01 |
101 |
1.1 |
| Tyler Uberstine |
100.7 |
7.9 |
3.1 |
1.2 |
8.1% |
20.3% |
.298 |
95 |
98 |
4.29 |
105 |
1.1 |
| Lucas Giolito |
137.3 |
8.1 |
3.5 |
1.4 |
8.9% |
20.6% |
.294 |
90 |
89 |
4.61 |
111 |
1.1 |
| John Holobetz |
110.3 |
6.5 |
2.5 |
1.1 |
6.6% |
16.9% |
.297 |
93 |
98 |
4.26 |
107 |
1.0 |
| Kutter Crawford |
104.7 |
7.7 |
2.8 |
1.4 |
7.3% |
20.4% |
.280 |
93 |
93 |
4.46 |
107 |
0.9 |
| Yordanny Monegro |
75.7 |
8.2 |
3.2 |
1.2 |
8.3% |
21.2% |
.292 |
97 |
104 |
4.25 |
103 |
0.9 |
| Josh Winckowski |
80.7 |
7.0 |
2.9 |
1.0 |
7.5% |
18.2% |
.302 |
101 |
103 |
4.13 |
99 |
0.9 |
| Shane Drohan |
74.0 |
7.7 |
4.0 |
1.1 |
10.1% |
19.3% |
.290 |
90 |
93 |
4.50 |
111 |
0.6 |
| David Sandlin |
87.7 |
7.1 |
3.1 |
1.3 |
7.9% |
18.1% |
.299 |
90 |
94 |
4.61 |
111 |
0.6 |
| Ryan Watson |
60.7 |
7.4 |
3.0 |
1.0 |
7.6% |
19.1% |
.297 |
101 |
101 |
4.15 |
100 |
0.5 |
| Jovani Morán |
43.3 |
10.0 |
3.9 |
0.8 |
10.2% |
25.7% |
.301 |
112 |
111 |
3.53 |
90 |
0.5 |
| Eduardo Rivera |
77.3 |
8.2 |
4.7 |
1.2 |
11.7% |
20.5% |
.291 |
87 |
94 |
4.74 |
115 |
0.5 |
| Hayden Mullins |
85.7 |
8.2 |
4.6 |
1.2 |
11.5% |
20.4% |
.291 |
86 |
91 |
4.80 |
116 |
0.5 |
| Blake Wehunt |
69.7 |
7.4 |
3.6 |
1.3 |
9.2% |
18.6% |
.293 |
87 |
94 |
4.77 |
115 |
0.5 |
| Jordan Hicks |
73.0 |
8.1 |
4.2 |
0.9 |
10.4% |
20.2% |
.302 |
92 |
91 |
4.29 |
109 |
0.5 |
| Jake Bennett |
67.3 |
6.1 |
2.9 |
1.2 |
7.5% |
15.8% |
.294 |
89 |
93 |
4.60 |
112 |
0.5 |
| Jack Anderson |
71.7 |
7.2 |
2.5 |
1.3 |
6.5% |
18.4% |
.301 |
92 |
97 |
4.27 |
108 |
0.4 |
| Dalton Rogers |
87.0 |
7.9 |
5.2 |
1.2 |
12.5% |
19.0% |
.295 |
86 |
90 |
5.00 |
116 |
0.4 |
| Bryan Mata |
62.0 |
8.7 |
4.5 |
1.0 |
11.2% |
21.7% |
.295 |
93 |
95 |
4.49 |
108 |
0.3 |
| José De León |
69.0 |
8.1 |
4.0 |
1.3 |
10.1% |
20.3% |
.300 |
87 |
82 |
4.90 |
116 |
0.3 |
| Justin Wilson |
38.0 |
9.7 |
3.6 |
0.9 |
9.0% |
24.6% |
.324 |
110 |
96 |
3.64 |
91 |
0.3 |
| Greg Weissert |
59.3 |
8.2 |
3.2 |
1.1 |
8.3% |
21.3% |
.290 |
102 |
100 |
4.09 |
98 |
0.3 |
| Justin Slaten |
42.7 |
8.4 |
3.4 |
1.1 |
8.7% |
21.7% |
.286 |
104 |
103 |
4.01 |
96 |
0.3 |
| Isaac Coffey |
74.3 |
7.4 |
3.9 |
1.3 |
9.9% |
18.8% |
.284 |
82 |
85 |
5.22 |
122 |
0.2 |
| Tyler Samaniego |
36.3 |
7.4 |
3.5 |
1.0 |
8.9% |
19.1% |
.296 |
99 |
100 |
4.26 |
101 |
0.2 |
| Osvaldo Berrios |
58.7 |
6.6 |
3.2 |
1.2 |
8.1% |
16.7% |
.301 |
88 |
92 |
4.70 |
114 |
0.1 |
| Zack Kelly |
56.3 |
8.6 |
4.5 |
1.1 |
11.3% |
21.9% |
.284 |
93 |
91 |
4.57 |
108 |
0.1 |
| Alec Gamboa |
53.7 |
5.5 |
4.7 |
1.0 |
11.3% |
13.3% |
.295 |
83 |
83 |
5.06 |
121 |
0.0 |
| Liam Hendriks |
22.3 |
9.7 |
3.6 |
1.2 |
9.2% |
24.5% |
.300 |
94 |
82 |
4.10 |
106 |
0.0 |
| Caleb Bolden |
56.3 |
6.7 |
4.3 |
1.3 |
10.6% |
16.5% |
.293 |
82 |
84 |
5.28 |
122 |
0.0 |
| Wyatt Mills |
43.7 |
7.2 |
4.1 |
1.2 |
10.3% |
17.9% |
.290 |
84 |
82 |
5.06 |
118 |
0.0 |
| John Stankiewicz |
52.3 |
6.5 |
3.8 |
1.2 |
9.4% |
16.2% |
.299 |
87 |
89 |
4.77 |
115 |
-0.1 |
| Jeremy Wu-Yelland |
37.7 |
9.3 |
4.3 |
1.2 |
10.7% |
23.2% |
.294 |
87 |
92 |
4.65 |
115 |
-0.1 |
| Reidis Sena |
41.3 |
8.1 |
5.4 |
1.1 |
13.2% |
19.5% |
.294 |
83 |
88 |
4.83 |
120 |
-0.1 |
| Hobie Harris |
39.7 |
7.3 |
4.5 |
1.1 |
11.0% |
17.7% |
.306 |
88 |
83 |
4.70 |
114 |
-0.1 |
| Austin Adams |
25.7 |
11.6 |
6.3 |
1.1 |
15.4% |
28.2% |
.295 |
85 |
77 |
4.92 |
118 |
-0.1 |
| Christopher Troye |
35.0 |
8.5 |
5.9 |
1.0 |
13.9% |
19.9% |
.293 |
85 |
89 |
4.91 |
117 |
-0.2 |
| Gabriel Jackson |
57.3 |
5.0 |
4.1 |
1.3 |
10.0% |
12.3% |
.293 |
81 |
85 |
5.43 |
124 |
-0.2 |
| Cooper Adams |
62.3 |
6.6 |
3.6 |
1.3 |
9.0% |
16.6% |
.295 |
83 |
87 |
5.01 |
120 |
-0.2 |
| Noah Song |
45.7 |
7.3 |
4.7 |
1.4 |
11.5% |
17.8% |
.297 |
78 |
79 |
5.31 |
128 |
-0.2 |
| Jacob Webb |
52.7 |
7.0 |
4.4 |
1.2 |
10.9% |
17.2% |
.294 |
81 |
84 |
4.99 |
123 |
-0.2 |
| Brendan Cellucci |
43.0 |
8.0 |
5.7 |
1.3 |
13.4% |
18.8% |
.296 |
83 |
85 |
5.37 |
120 |
-0.2 |
| Wyatt Olds |
67.7 |
7.8 |
5.5 |
1.2 |
13.2% |
19.0% |
.284 |
78 |
81 |
5.59 |
127 |
-0.4 |
| Zach Bryant |
38.7 |
6.7 |
4.4 |
1.4 |
10.9% |
16.6% |
.294 |
78 |
81 |
5.39 |
128 |
-0.4 |
| Jorge Juan |
35.7 |
8.1 |
5.8 |
1.3 |
13.7% |
19.0% |
.287 |
75 |
78 |
5.71 |
133 |
-0.4 |
Pitcher – Top Near-Age Comps
Pitcher – Splits and Percentiles
| Player |
BA vs. L |
OBP vs. L |
SLG vs. L |
BA vs. R |
OBP vs. R |
SLG vs. R |
80th WAR |
20th WAR |
80th ERA |
20th ERA |
| Garrett Crochet |
.204 |
.252 |
.289 |
.222 |
.277 |
.362 |
6.3 |
3.7 |
2.24 |
3.35 |
| Sonny Gray |
.237 |
.293 |
.380 |
.252 |
.299 |
.416 |
3.8 |
1.4 |
3.04 |
4.62 |
| Brayan Bello |
.253 |
.330 |
.424 |
.241 |
.304 |
.351 |
3.5 |
1.4 |
3.50 |
4.49 |
| Garrett Whitlock |
.228 |
.278 |
.350 |
.224 |
.281 |
.361 |
2.2 |
0.7 |
2.49 |
4.27 |
| Connelly Early |
.206 |
.294 |
.325 |
.248 |
.324 |
.401 |
2.2 |
0.7 |
3.57 |
4.71 |
| Payton Tolle |
.228 |
.293 |
.378 |
.244 |
.296 |
.424 |
2.1 |
0.4 |
3.48 |
5.07 |
| Aroldis Chapman |
.178 |
.275 |
.200 |
.201 |
.289 |
.351 |
2.0 |
0.3 |
1.80 |
4.81 |
| Tanner Houck |
.258 |
.338 |
.412 |
.247 |
.304 |
.369 |
1.7 |
0.4 |
3.86 |
5.05 |
| Kyle Harrison |
.261 |
.333 |
.374 |
.237 |
.318 |
.410 |
2.0 |
0.4 |
3.74 |
4.97 |
| Johan Oviedo |
.238 |
.332 |
.392 |
.237 |
.314 |
.398 |
1.8 |
0.3 |
3.72 |
5.04 |
| Patrick Sandoval |
.205 |
.290 |
.318 |
.268 |
.344 |
.406 |
1.7 |
0.4 |
3.66 |
4.89 |
| Tyler Uberstine |
.270 |
.336 |
.429 |
.238 |
.304 |
.401 |
1.9 |
0.4 |
3.74 |
4.99 |
| Lucas Giolito |
.241 |
.317 |
.406 |
.266 |
.329 |
.460 |
1.8 |
0.0 |
4.19 |
5.37 |
| John Holobetz |
.264 |
.318 |
.426 |
.260 |
.303 |
.414 |
1.7 |
0.3 |
3.98 |
5.10 |
| Kutter Crawford |
.243 |
.318 |
.450 |
.254 |
.300 |
.408 |
1.6 |
0.2 |
3.95 |
5.07 |
| Yordanny Monegro |
.243 |
.310 |
.414 |
.248 |
.316 |
.395 |
1.6 |
0.3 |
3.59 |
4.99 |
| Josh Winckowski |
.268 |
.329 |
.409 |
.253 |
.309 |
.408 |
1.4 |
0.2 |
3.62 |
4.89 |
| Shane Drohan |
.271 |
.344 |
.412 |
.241 |
.326 |
.409 |
1.1 |
0.1 |
4.06 |
5.27 |
| David Sandlin |
.277 |
.339 |
.458 |
.254 |
.310 |
.427 |
1.1 |
0.0 |
4.09 |
5.21 |
| Ryan Watson |
.250 |
.328 |
.398 |
.262 |
.312 |
.408 |
0.9 |
0.0 |
3.58 |
4.84 |
| Jovani Morán |
.224 |
.297 |
.310 |
.229 |
.315 |
.385 |
1.0 |
0.0 |
2.89 |
4.86 |
| Eduardo Rivera |
.242 |
.340 |
.341 |
.248 |
.340 |
.438 |
1.0 |
-0.2 |
4.22 |
5.48 |
| Hayden Mullins |
.271 |
.358 |
.393 |
.233 |
.336 |
.414 |
1.1 |
-0.2 |
4.24 |
5.52 |
| Blake Wehunt |
.278 |
.357 |
.452 |
.240 |
.311 |
.407 |
1.0 |
0.0 |
4.24 |
5.44 |
| Jordan Hicks |
.273 |
.377 |
.422 |
.226 |
.307 |
.358 |
1.0 |
-0.1 |
4.01 |
5.27 |
| Jake Bennett |
.274 |
.327 |
.442 |
.263 |
.323 |
.434 |
0.9 |
0.0 |
4.19 |
5.24 |
| Jack Anderson |
.248 |
.299 |
.406 |
.276 |
.321 |
.462 |
1.0 |
-0.2 |
3.88 |
5.30 |
| Dalton Rogers |
.238 |
.331 |
.381 |
.261 |
.357 |
.441 |
1.0 |
-0.3 |
4.32 |
5.60 |
| Bryan Mata |
.246 |
.360 |
.377 |
.236 |
.319 |
.394 |
0.9 |
-0.2 |
3.81 |
5.27 |
| José De León |
.250 |
.346 |
.424 |
.262 |
.344 |
.426 |
0.8 |
-0.2 |
4.26 |
5.57 |
| Justin Wilson |
.255 |
.317 |
.364 |
.240 |
.313 |
.400 |
0.7 |
-0.3 |
2.97 |
5.34 |
| Greg Weissert |
.255 |
.336 |
.422 |
.236 |
.295 |
.370 |
0.9 |
-0.3 |
3.36 |
5.03 |
| Justin Slaten |
.254 |
.342 |
.448 |
.229 |
.286 |
.354 |
0.7 |
-0.2 |
3.35 |
4.86 |
| Isaac Coffey |
.250 |
.344 |
.441 |
.255 |
.354 |
.425 |
0.6 |
-0.4 |
4.59 |
5.70 |
| Tyler Samaniego |
.234 |
.308 |
.319 |
.260 |
.333 |
.438 |
0.4 |
-0.1 |
3.69 |
4.93 |
| Osvaldo Berrios |
.270 |
.344 |
.423 |
.264 |
.321 |
.440 |
0.5 |
-0.2 |
4.19 |
5.29 |
| Zack Kelly |
.245 |
.357 |
.394 |
.233 |
.316 |
.392 |
0.7 |
-0.4 |
3.69 |
5.35 |
| Alec Gamboa |
.265 |
.354 |
.412 |
.274 |
.359 |
.425 |
0.3 |
-0.4 |
4.53 |
5.76 |
| Liam Hendriks |
.244 |
.326 |
.366 |
.234 |
.302 |
.404 |
0.3 |
-0.3 |
3.36 |
6.08 |
| Caleb Bolden |
.269 |
.369 |
.462 |
.258 |
.343 |
.408 |
0.3 |
-0.5 |
4.64 |
5.81 |
| Wyatt Mills |
.263 |
.356 |
.447 |
.255 |
.349 |
.415 |
0.3 |
-0.5 |
4.38 |
5.95 |
| John Stankiewicz |
.267 |
.348 |
.406 |
.264 |
.322 |
.455 |
0.2 |
-0.4 |
4.27 |
5.43 |
| Jeremy Wu-Yelland |
.234 |
.333 |
.340 |
.245 |
.348 |
.439 |
0.2 |
-0.4 |
4.03 |
5.54 |
| Reidis Sena |
.233 |
.341 |
.397 |
.258 |
.356 |
.404 |
0.2 |
-0.4 |
4.38 |
5.78 |
| Hobie Harris |
.240 |
.329 |
.400 |
.282 |
.354 |
.447 |
0.2 |
-0.4 |
4.13 |
5.66 |
| Austin Adams |
.209 |
.358 |
.395 |
.222 |
.377 |
.315 |
0.1 |
-0.4 |
3.96 |
6.14 |
| Christopher Troye |
.270 |
.395 |
.444 |
.222 |
.329 |
.361 |
0.1 |
-0.5 |
4.32 |
5.74 |
| Gabriel Jackson |
.266 |
.352 |
.404 |
.285 |
.360 |
.480 |
0.2 |
-0.6 |
4.68 |
5.79 |
| Cooper Adams |
.239 |
.333 |
.385 |
.286 |
.347 |
.481 |
0.2 |
-0.6 |
4.50 |
5.65 |
| Noah Song |
.268 |
.375 |
.427 |
.260 |
.342 |
.460 |
0.2 |
-0.7 |
4.63 |
6.30 |
| Jacob Webb |
.274 |
.369 |
.442 |
.243 |
.323 |
.400 |
0.1 |
-0.6 |
4.59 |
5.83 |
| Brendan Cellucci |
.236 |
.382 |
.382 |
.263 |
.361 |
.447 |
0.1 |
-0.6 |
4.42 |
5.76 |
| Wyatt Olds |
.250 |
.397 |
.440 |
.241 |
.355 |
.379 |
0.1 |
-1.0 |
4.76 |
6.06 |
| Zach Bryant |
.279 |
.380 |
.441 |
.253 |
.333 |
.460 |
-0.1 |
-0.7 |
4.71 |
6.19 |
| Jorge Juan |
.238 |
.377 |
.429 |
.253 |
.380 |
.413 |
-0.1 |
-0.8 |
4.85 |
6.50 |
Players are listed with their most recent teams wherever possible. This includes players who are unsigned or have retired, players who will miss 2026 due to injury, and players who were released in 2025. So yes, if you see Joe Schmoe, who quit baseball back in August to form a Ambient Math-Rock Trip-Hop Yacht Metal band that only performs in abandoned malls, he’s still listed here intentionally. ZiPS is assuming a league with an ERA of 4.16.
Hitters are ranked by zWAR, which is to say, WAR values as calculated by me, Dan Szymborski, whose surname is spelled with a z. WAR values might differ slightly from those that appear in the full release of ZiPS. Finally, I will advise anyone against — and might karate chop anyone guilty of — merely adding up WAR totals on a depth chart to produce projected team WAR. It is important to remember that ZiPS is agnostic about playing time, and has no information about, for example, how quickly a team will call up a prospect or what veteran has fallen into disfavor.
As always, incorrect projections are either caused by misinformation, a non-pragmatic reality, or by the skillful sabotage of our friend and former editor. You can, however, still get mad at me on Twitter or on Bluesky. This last is, however, not an actual requirement.