The St. Louis Cardinals played Friday night’s game in Boston with one catcher. Iván Herrera had been called up from Triple-A to replace the newly-sidelined Yadier Molina, but cancelled flights delayed his arrival. The highly-regarded prospect didn’t get to Fenway Park until the final inning of a 6-5 Red Sox win.
Asked who would have been used in an emergency had Andrew Knizner been injured, St. Louis manager Oliver Marmol named three possibilities: Edmundo Sosa, Brendan Donovan, and Nick Wittgren. That Marmol added, “Not necessarily in that order,” is intriguing, if not suggestive. Sosa and Donovan are infielders. Wittgren toes the rubber.
Might we have seen Wittgren, a 31-year-old pitcher with no professional experience at any another position, donning the tools of ignorance? It’s a definite possibility. Prior to the game, Marmol approached Wittgren and asked, “How do you think you’d do catching?” Wittgren replied that he’d be perfectly fine. Marmol responded with “I think so too.”
According to The St. Louis Post-Dispatch’s Derrick Goold, Wittgren isn’t the first Cardinals pitcher to be designated (or at least hinted) as an emergency catcher. Jason Motte, who worked out of the St. Louis bullpen from 2008-2014 previously claimed that distinction. Even so, Motte had caught in the minor leagues. Wittgren would have been a novice.
When Major League Baseball and the Major League Baseball Players Association signed a new Collective Bargaining Agreement this offseason, it included some interesting provisions designed to combat service time manipulation. Top prospects who finish first or second in Rookie of the Year voting will automatically gain a full year of service time regardless of when they’re called up, and teams that promote top prospects early enough for them to gain a full year of service will be eligible to earn extra draft picks if those players go on to finish in the top three in Rookie of the Year voting or the top five in MVP or Cy Young voting. The goal was to incentivize teams to call up their best young players when they’re ready, rather than keeping them in the minor leagues to gain an extra year of team control.
So far, the rule changes seem to have had their intended effect: three of our top five preseason prospects, and 11 of our top 50, earned an Opening Day roster spot out of spring training. The three prospects in the top five all play for American League teams, and with many others putting together impressive performances in the majors, the competition in the junior circuit for the Rookie of the Year award is quite compelling. Below is a table of the best rookie performers in the AL through June 15:
AL Rookie of the Year Leaders
Player
Team
PA
wRC+
OAA
WAR
Jeremy Peña
HOU
211
133
6
2.5
Julio Rodríguez
SEA
255
122
5
1.8
Bobby Witt Jr.
KCR
246
106
2
1.6
Steven Kwan
CLE
185
113
0
0.8
Jake Burger
CWS
144
135
-3
0.7
MJ Melendez
KCR
146
123
1
0.5
Adley Rutschman
BAL
86
69
—
0.2
Spencer Torkelson
DET
199
67
-1
-0.8
Player
Team
IP
ERA
FIP
WAR
Joe Ryan
MIN
48
2.81
3.75
0.9
Jhoan Duran
MIN
28.2
2.51
3.00
0.4
George Kirby
SEA
43
3.56
4.07
0.4
Reid Detmers
LAA
53
4.25
5.16
0.1
Jeremy Peña (ranked 30th on our preseason Top 100) has raced out ahead of the three top prospects referenced above to accumulate 2.5 WAR in just 54 games. That mark is the second highest among AL shortstops, and is the result of his phenomenal up-the-middle defense and his prowess at the plate. He’s slashed .277/.333/.471 (133 wRC+) so far this year with a solid if aggressive approach and some good power. The thump is a recent development after Peña filled out last year. He’s already blasted nine home runs and his peripherals support a profile that could reach 20 homers by the end of the season; his max exit velocity and barrel rate both sit above league average, with only his hard hit rate falling below. Read the rest of this entry »
Jay Jaffe: I have yet to see a Cape Cod League game — the plan is to do so Tuesday, but I’m just back from the Edward Gorey House in Yarmouth Port, which I highly recommend
2:06
Jay Jaffe: Connecting it back to baseball, official MLB historian John Thorn sent this along
In a season that has already produced two no-hitters (as well as two that would have counted as such before Major League Baseball tightened its definition of the feat), this week produced two near-misses on consecutive nights. On Tuesday night in St. Louis, the Cardinals’ Miles Mikolas came within one strike of no-hitting the Pirates, and on Wednesday night in Los Angeles, the Dodgers’ Tyler Anderson fell two outs short of no-hitting the Angels. It’s fair to say that we’ve never seen anything quite like this.
Had either Mikolas or Anderson pulled off the feat, they would have joined Tylor Megill and four Mets relievers, who combined to no-hit the Phillies on April 29, and the Angels’ Reid Detmers, who no-hit the Rays on May 10. In the first of several coincidences that run through this tale, Detmers was actually Anderson’s opposite number on Wednesday, though he exited in the fourth inning after being roughed up for four runs. The Pirates, as it turns out, were already held hitless in a game on May 15 by the Reds’ Hunter Greene and Art Warren, but because they scored the game’s only run and didn’t need to bat in the ninth given that they were at home, the effort did not count as a no-hitter based on a 1991 ruling by MLB’s Committee for Statistical Accuracy.
(In the other non-no-hitter this year, six Rays pitchers held the Red Sox hitless for nine innings on April 23, but a seventh pitcher allowed a hit in the 10th inning.)
The 33-year-old Mikolas started the nightcap of a day-night doubleheader against a team that owns the NL’s weakest offense (3.42 runs per game) and its second-lowest batting average (.220). He only got as far as the second inning before allowing his first baserunner; with one out, he hit Canaan Smith-Njigba in the left foot with a slider, then erased him when Diego Castillo grounded into a 5-4-3 double play. Mikolas need another double play in the third after leadoff hitter Hoy Park reached on an error, as third baseman Brendan Donovan, who fielded his grounder, pulled Paul Goldschmidt off first base with a high throw. Yu Chang followed by working a seven-pitch walk before Michael Perez grounded into the needed 4-6-3 double play and Tucupita Marcano struck out, one of six punchouts on the night for Mikolas.
That 20-pitch third inning was the St. Louis righty’s most labor-intensive of the night. By comparison, Mikolas needed only 10 pitches in the fourth, which began with another error by the Cardinals’ defense; this time, Bryan Reynolds‘ fly ball glanced off the glove of left fielder Juan Yepez. He took second on the error, then came around to score after groundouts by Jack Suwinski and Daniel Vogelbach.
By that point, the Cardinals had already plated seven runs, and Suwinski’s grounder began a string of 17 consecutive batters retired that carried Mikolas to within one out of completing the no-hitter. He passed the 100-pitch mark while facing Castillo, who led off the eighth inning by battling for eight pitches before striking out. By the end of the frame, Mikolas had matched his MLB career high of 115 pitches, set on May 29 in a 5.2-inning grind against the Brewers (Lord knows how high he went during his three years in Japan).
Mikolas needed just two pitches to dispatch Perez on a grounder to start the ninth, and six more to get Marcano to fly to right. Facing Cal Mitchell for the final out, he fell behind 2–0, then got a called strike on a fastball and a swinging strike on a down-and-in curve. Mitchell fouled off another fastball, then hit a deep fly ball to center field. Gold Glove winner Harrison Bader leaped in pursuit of the ball but just missed as it went over his head and bounced off of the warning track and over the wall for a ground rule double. Mikolas exited to a hearty ovation from Busch Stadium’s 33,977 fans, leaving Packy Naughton to record the final out. Read the rest of this entry »
Jordan Montgomery hasn’t had the easiest of careers. While he established a name for himself with a solid rookie campaign in 2017, extended battles with injuries kept him off the mound in subsequent years. An underwhelming return in 2020 (5.11 ERA) raised questions about his future with the Yankees. But the much better peripherals (3.87 FIP, 3.65 xFIP) signaled a return to form, and the following year, Montgomery put together somewhat of a second breakout season, anchoring a rotation that was considerably more volatile than it is now.
Last year, Montgomery made an adjustment I thought was interesting but never got to write about, drastically raising his four-seam fastball usage in September, which had its pros and cons. On one hand, this newfound reliance on the hard stuff granted Montgomery the highest monthly strikeout rate of his career, as hitters found themselves whiffing at elevated fastballs. On the other hand, it led to a barrage of hard contact; the shape of Montgomery’s fastball isn’t great to begin with, and the corresponding decrease in sinker usage didn’t help, either.
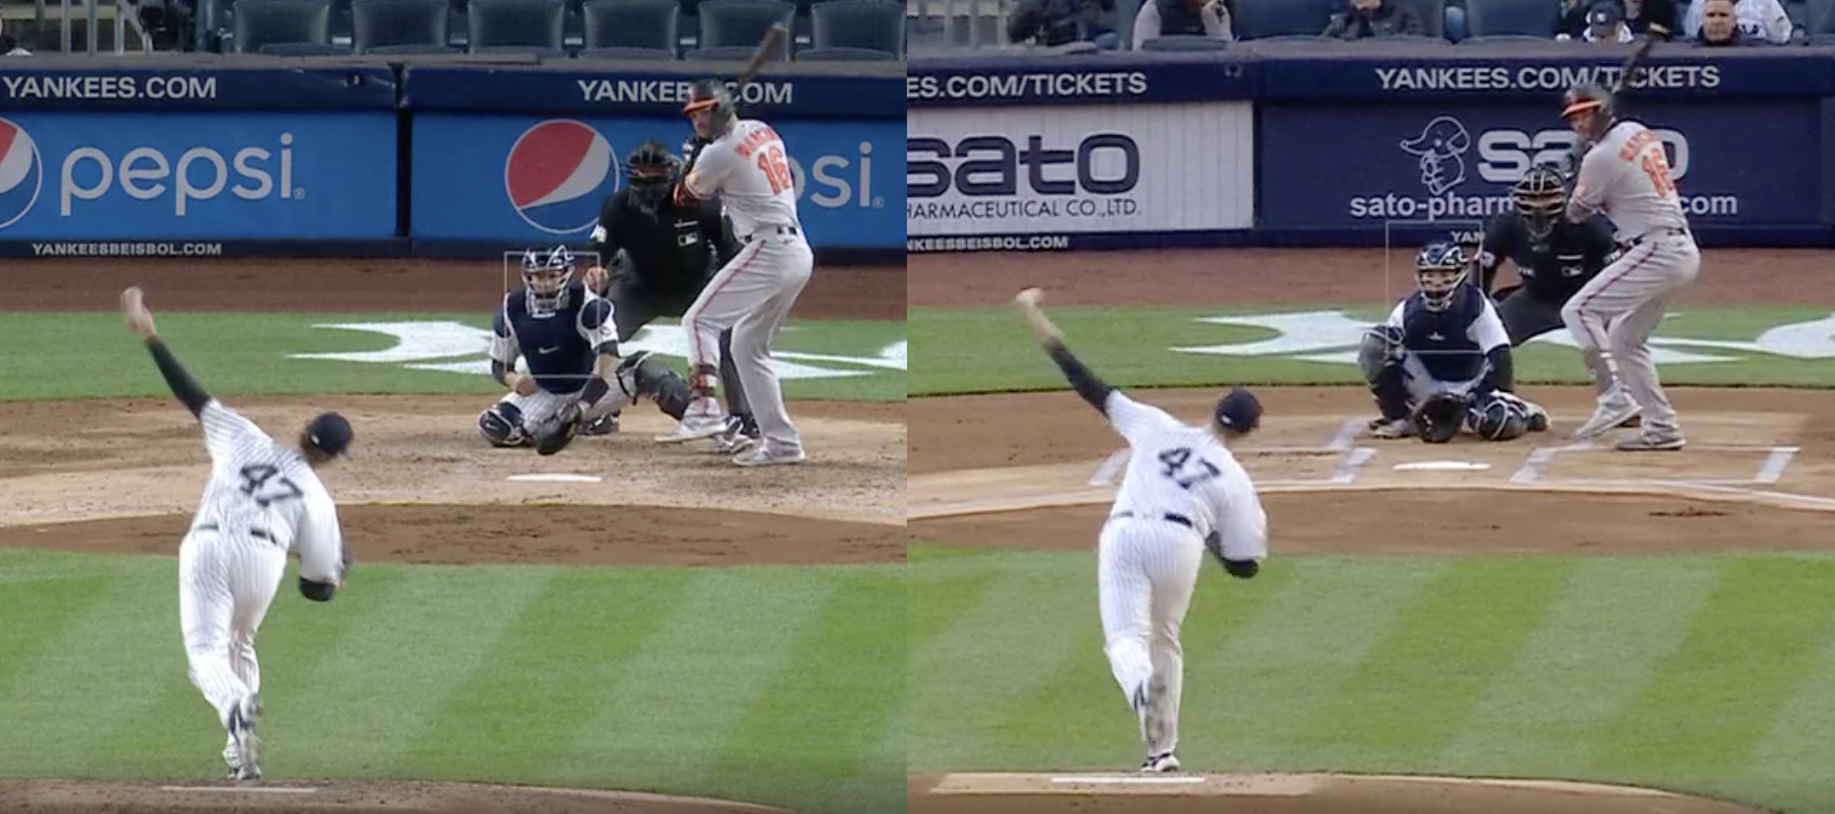
Considering Montgomery’s excellent command, though, I believed he could make this new approach work in the long-term. So naturally, the development we’ve seen this season is… a near-abandonment of the four-seamer! His last five starts all featured a four-seam fastball usage under 10%; against the Tigers on June 5, Pitch Info thought he didn’t throw a single one. But Montgomery isn’t just tinkering with his pitch mix. Check out this side-by-side view of his typical arm slot in 2021 (left) versus 2022 (right):
It’s subtle, but you can see that Montgomery is throwing slightly less over-the-top than before. The Hawk-Eye readings bear this out: he’s lowered his average vertical release point from 6.70 feet to 6.47. What good is a different angle for? My theory is that it’s helped Montgomery exchange vertical movement for horizontal. His sinker is getting more drop and arm-side run than ever before, which is the sort of trade-off stuff models absolutely love (and opposing batters hate). It’s come at the cost of a worse four-seamer, but realistically, improving two diametrically opposed fastballs is a tall order. Montgomery made a choice to stick with one, and so far, it’s worked wonders.
Originally, this article had a much bigger focus on Montgomery. But looking around the league, I couldn’t help but notice several other pitchers who’ve placed a recent emphasis on their sinkers. There are the obvious names, like Clay Holmes and his triple-digit, bowling-ball sinkers, or basically the entire Giants rotation sans Carlos Rodón. Lesser-known examples (to the average fan, at least) include Mitch Keller, who, as noted by Michael Ajeto, switched to a sinker-slider combo after a disappointing start to his season. Oh, and did you know Robbie Ray reintroduced his long-dormant sinker? Wild. Maybe he reckons it’ll help curb the home runs. Read the rest of this entry »
Eric A Longenhagen: Howdy, might be a shorter one today so I can get things together to go to the Combine.
12:01
Guest: How are your cats doing?
12:03
Eric A Longenhagen: (thumbs up) Fran has settled into middle age and is now very chill, barely leaves the yard. Archie spends most of the day across the street in my neighbor’s yard but she’s cool with it. He hasn’t been in a fight that has warranted a vet visit for many months now.
12:03
Joe: Any feed back on the Braves Elian Corrorreal?
12:04
Eric A Longenhagen: Sadly no, he wasn’t part of their Extended group and so I don’t have anything on him. Flagged him just for hitting near the top of the DSL lineup but couldn’t find anyone who saw him.
12:05
James: Esteury Ruiz is popping off this year. Eye, power, base running, OF defense – he is just killing it so far. How much of the helium is legit?
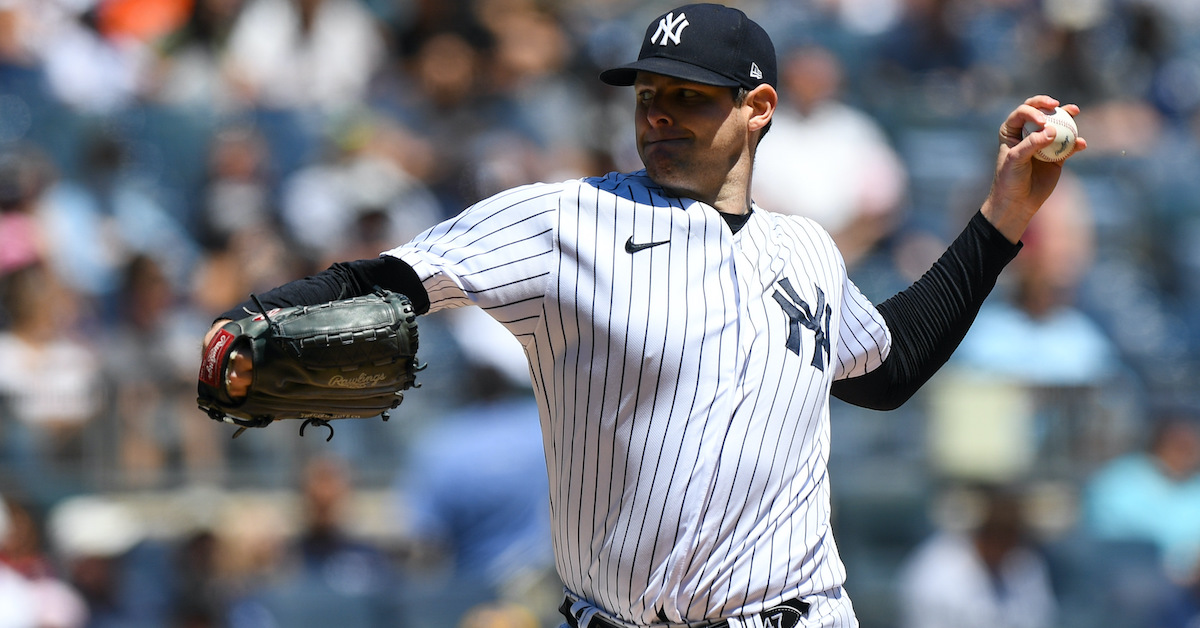
The Learning and Developing a Pitch series is back for another season, and we’re once again hearing from pitchers on a notable weapon in their arsenal. Today’s installment features Oakland Athletics right-hander Paul Blackburn on his curveball, a revamped pitch playing a key role in what has been a career-best season.
On track to represent Oakland in next month’s All-Star game, Blackburn has won six of eight decisions — this for the team with baseball’s worst record — while logging a 2.26 ERA and a 3.09 FIP over 13 starts comprising 71-and-two-thirds innings. He’s thrown his curveball, a pitch he no longer grips in atypical fashion, 18.5% of the time.
———
Paul Blackburn: “I started throwing a curveball right around my sophomore year of high school. I learned it from watching Barry Zito. I grew up in Northern California — I’m a Northern California guy — so I saw a lot of Barry Zito and his big curveball. Read the rest of this entry »
Eli Morgan is one of the best-kept secrets in baseball. He’s not a high-leverage reliever for a marquee team. He’s not even the best or most famous reliever on his own team. Heck, he was a middling five-and-dive starter in the majors just last year. But none of that matters anymore, because now he has a cheat code:
That changeup is absolutely ludicrous. It looks like no other pitch in baseball. It’s slow, much slower than the rest of Morgan’s arsenal. Every other one of his pitches is in the vicinity of league average, while his changeup is the slowest in baseball. That makes for huge separation from his fastball; if the two started on the same trajectory, the changeup would fall 30 more inches than the fastball on its way to home plate. That’s nearly half an Altuve. Read the rest of this entry »
Below is an analysis of the prospects in the farm system of the defending World Series Champion Atlanta Braves. Scouting reports were compiled with information provided by industry sources as well as my own observations. This is the second year we’re delineating between two anticipated relief roles, the abbreviations for which you’ll see in the “position” column below: MIRP for multi-inning relief pitchers, and SIRP for single-inning relief pitchers.
A quick overview of what FV (Future Value) means can be found here. A much deeper overview can be found here.
All of the numbered prospects below also appear on The Board, a resource the site offers featuring sortable scouting information for every organization. It has more details than this article and integrates every team’s list so readers can compare prospects across farm systems. It can be found here. Read the rest of this entry »