This Ain’t Team Entropy, but We’ve Got Some Races To Untie

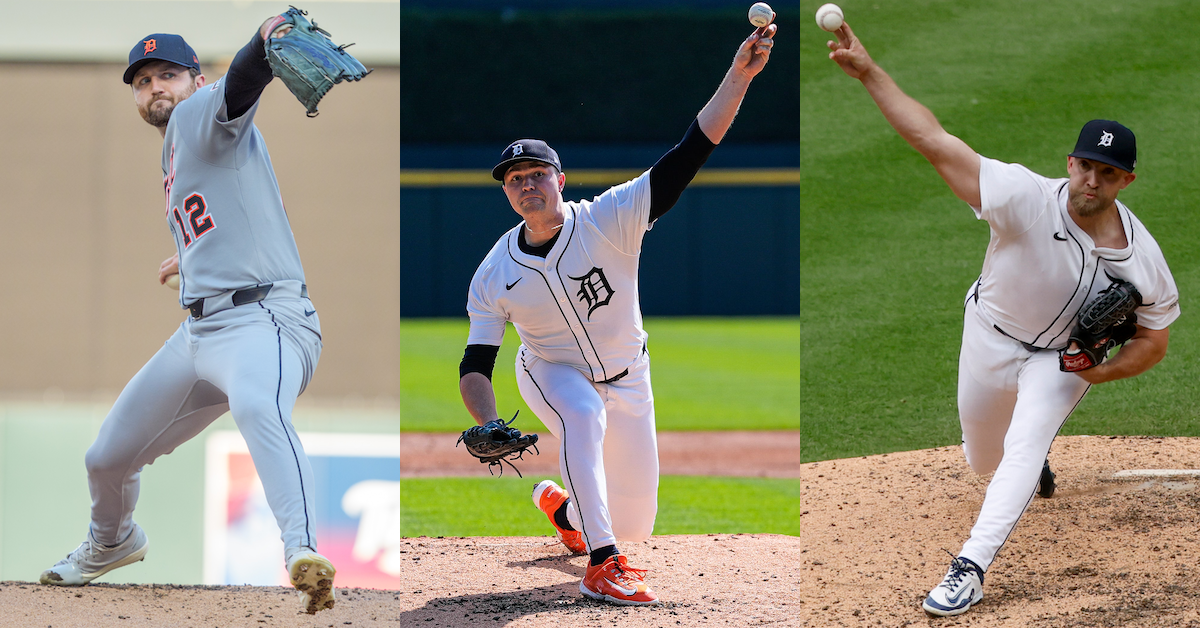
Last year, after a trade deadline sell-off, the Tigers snagged a Wild Card spot thanks to the combination of a late surge and a gruesome collapse by the Twins. This year, it’s the Tigers who are in danger of fumbling away a playoff berth, as they’ve lost 11 out of 15 since September 3, while the Guardians have won 15 out of 18. Meanwhile, the Mets have lost 12 out of 19 this month, slipping from the third NL Wild Card spot to being on the outside looking in due to the tiebreaker with the Reds.
Particularly with that tiebreaker looming so large, with six days to go in the regular season, it’s time for another look at what’s at stake. This used to be Team Entropy territory, but alas in the 2022 Collective Bargaining Agreement, Major League Baseball and the players’ union traded the potential excitement and scheduling mayhem created by on-field tiebreakers and sudden-death Wild Card games in exchange for a larger inventory of playoff games. The 12-team, two-bye format was designed to reward the top two teams in each league by allowing them to bypass the possibility of being eliminated in a best-of-three series. Those bye teams are just 6-6 under the new format, but across a larger sample going back to 1981, research by Dan Szymborski, freshly updated for this article, shows that in matchups where with one playoff team had a layoff of four or more days while its opponent had two or fewer days off, the team with more rest went 27-13 in its next game. It’s an advantage.
Anyway, as we head into the season’s final days, here’s a look at the various scenarios still in play when it comes to playoff seeding, and how the tiebreaker rules could determine who plays on into October and who goes home. Read the rest of this entry »