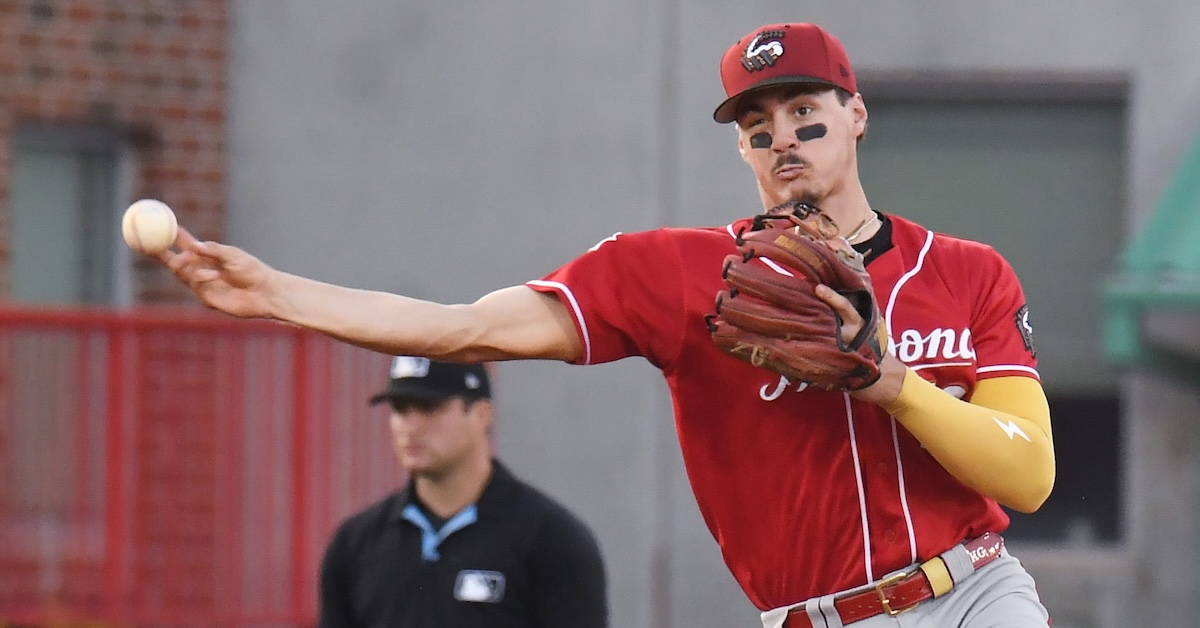
When Geraldo Perdomo Attacks

Lon Horwedel-Imagn Images

It sure seems like the Diamondbacks knew something the rest of us didn’t. Back in February, when Arizona signed shortstop Geraldo Perdomo to a four-year contract extension to keep him around through the 2029 season, I wrote, “I think the Diamondbacks are paying for floor rather than ceiling. However he gets there, if Perdomo keeps performing like a two-win player, the contract will work out well for both sides.” Perdomo was coming off a knee injury and two straight seasons of absolutely average offensive performance. It may have looked like the Diamondbacks were comfortable with that level of production, but the 2025 season has put things in an entirely new light.

Perdomo has been unequivocally one of the best players in baseball. He leads all National League position players in bWAR, and if not for Shohei Ohtani, he would have a very good argument for the MVP. Geraldo Perdomo, whom I first wrote about because he was a great test case for players with extremely low exit velocities. Geraldo Perdomo, whose offensive approach I summed up earlier this year as, “Try with all your might to avoid swinging.” Geraldo Perdomo, whose 12th-percentile hard-hit rate represents a career-high! That guy has 6.7 WAR. That guy has 19 home runs after coming into this season with a combined 14 for his major league career, which began in 2021. That guy is running a 138 wRC+ and none of the advanced numbers is saying it’s because of batted ball luck. Perdomo really has been a great hitter. We’ve been all over the story. Michael Baumann has written about him twice, I’ve broken down his breakout and documented one of his trademark swingless plate appearances. Now that October is near, we need to acknowledge how big a deal it is that Perdomo has kept this going all season long.

Perdomo has gotten bigger and stronger. He’s changed his mechanics from both sides of the plate. He’s somehow chasing and whiffing even less than he did last season, and he’s somehow doing so while lifting the ball more, swinging a bit harder, and hitting the ball a bit harder. We’ve broken down all those points in the articles I linked to above, so I’m not going cover that ground again. I’m here to show you one graph that cracks me up.

This is from the last paragraph of my article back in February: “I am so, so curious to see what it would look like if Perdomo were to start attacking the ball. He’s still young, and I really do think it’s possible that he has the capacity to be more than an average hitter.” I’m not trying to say I called this. I definitely did not. One sentence later, I wrote “Still, I don’t think we should expect that going forward.” But Perdomo really did start attacking the ball in his own way, so I can now show you what it looks like.

In terms of average exit velocity, it doesn’t look like all that much. He’s running a career-high 87.6 mph, up half a tick from last season. That’s still only enough to put him in the 19th percentile. However, you know better than to just look at average EV and call it a day. His 90th-percentile exit velocity jumped from 100.4 mph to 101.5. That’s a bigger jump, but in terms of percentiles, it only moves him from the 14th to the 18th. So, uh, that doesn’t look like that much either.

It’s impressive that Perdomo can swing harder, lift the ball more with a steeper swing, and maintain his absurdly high contact and squared-up rates. Regardless of where you’re starting out, that’s not normally how things work. But it’s also not enough to earn him respect. For all the reasons in the previous paragraph, pitchers still aren’t afraid of Perdomo, like at all. He ranks fifth among qualified players in zone rate. He’s seen 873 pitches over the heart of the plate. That’s the most in the game, and nobody else is even close. But Perdomo has the best hard-hit rate of his career by a wide margin, and that does matter. He’s never going to break the power scale, but let me show you Tom Tango’s graph for the thousandth time.

Going from a 25.8% hard-hit rate to a 31.5% hard-hit rate means crossing that threshold way more often. Even if you’re just barely crossing it, it’s still a big deal. There are way more hits on the right side of the line. The odds have changed on all those pitchers who are content to let Perdomo put the ball in play. Perdomo is still not a big, powerful guy, but he’s got a new A-swing. Here’s Baseball Savant’s distribution graph of his bat speed. This is for all swings.

Perdomo’s right-handed numbers from the 2025 season are in orange in the front. It’s still not as fast as the dotted line that represents the league average, and even though its peak is more than 1 mph higher than the peaks of the previous seasons, its shape doesn’t look all that different. It’s just that the tails on either side are fatter. That’s really noticeable on the left of the graph. Perdomo isn’t taking fewer super-weak, 57-63 mph swings than he did in previous seasons. What he’s cut down on are the medium-speed swings, and he’s getting off more fast swings than ever before. In other words, when he knows he has a chance to hit the ball hard, he’s making sure he does it. I know that looks pretty subtle here, and the difference between the green and blue areas that represent his 2024 and 2025 stats batting left-handed is even smaller. But now we’re getting to the graph I really want to show you, the one that has me cackling. Here’s the same exact thing, except it only shows the swings that result in hard-hit balls.

Well that’s different! Look how far the 2025 distributions are from the 2024 ones. The blue left-handed peak is roughly 2 mph faster than it was in 2024, and the orange right-handed peak is 5 mph faster! All of a sudden, Perdomo is getting his getting his money’s worth. He’s still happy to take a slow swing and put the ball in play – that’s why the tail on the left side of even this graph extends farther than in any of the previous seasons. But not only is he kicking into high gear more often, it’s a higher gear than he ever had before. Perdomo still doesn’t have the top-end bat speed to keep up with the league average on the right side of the chart, but he’s way above that dotted distribution line until we get to 77 mph or so. He’s more than doubled his fast-swing rate from 2024. That’s what it looks like when Perdomo starts attacking the ball, and it’s even more fun than we could’ve hoped.


Fun With Playoff Odds Modeling

Gary A. Vasquez-Imagn Images

Author’s note: “Five Things I Liked (Or Didn’t Like) This Week” is taking a short break, but will return next Friday for the end of the regular season.

Earlier this week, I did the sabermetric equivalent of eating my vegetables by testing the accuracy of our playoff odds projections. I found that our odds do a pretty good job of beating season-to-date odds (particularly late) and pure randomness (particularly early, everything does pretty well late). It’s good to intermittently check in on the accuracy of our predictions. It’s also helpful to build a baseline as a benchmark to measure future changes or updates against.

Those are a bunch of solid, workmanlike reasons to write a measured, lengthy article. But boring! Who likes veggies? I want to beat the odds, and I want to flex a little mathematical muscle while doing it. So I goofed around with a computer program and tried to find ways to recombine our existing numbers to come up with improved odds built by slicing up existing ones. It didn’t break the game wide open or anything, but I’m going to talk about my attempts anyway, because it’s September 19, there aren’t many playoff races going on, and you can only write so many articles about whether the Mets will collapse or if Cal Raleigh will hit 60 dingers.

What if you just penalized extreme values?
I first tried to correct for the fact that early-season projection-based odds (which I’m calling FanGraphs mode for the rest of the article) seem to be too confident and thus prone to large misses. I did so by applying a mean reversion factor that pulled every team’s values toward the league-wide average playoff chances (i.e. how many teams made the playoffs that year). This method varies based on the current playoff format; we have 16-team, 12-team, and 10-team samples in the data, and I adjusted each appropriately. I set the mean reversion factor so that it was strong early in the year and decayed to zero by the end of the season. Read the rest of this entry »

Effectively Wild Episode 2377: 25-25 in 2025

EWFI
Ben Lindbergh and Meg Rowley banter about 2025’s record number of 25-25 players and whether the current power/speed version of the sport is rendered any less impressive by its recent rule-change origins, the historic pre/post-All-Star break splits of Julio Rodríguez and whether the Mariners can help him become less of an extreme slow starter/fast finisher (phrasing?), the lockstep seasons (and recent slumps) of Pete Crow-Armstrong and Ceddanne Rafaela, the impending retirement (and on/off-field legacies) of Clayton Kershaw, and MLB’s new Amateur Recovery Period Policy, plus follow-ups (1:21:31) on a few of those topics.

Audio intro: Benny and a Million Shetland Ponies, “Effectively Wild Theme (Pedantic)
Audio outro: Kite Person, “Effectively Wild Theme

Link to power-speed fun fact
Link to Opta Sports wiki
Link to Opta EW interview
Link to power-speed number
Link to power-speed by season
Link to ’87 HR spike info
Link to more on ’87 spike
Link to 2025 SB leaders
Link to The Bandwagon on basestealers
Link to Julio’s career splits
Link to biggest pre/post-ASB splits
Link to Paine on Julio
Link to February Julio article
Link to PCA/Ceddanne laggardboard
Link to Kershaw retirement story
Link to Ben on Kershaw vs. Pedro
Link to recovery period announcement
Link to ESPN on the recovery period
Link to BA on the recovery period
Link to 2024 MLB pitching report

 Sponsor Us on Patreon
 Give a Gift Subscription
 Email Us: podcast@fangraphs.com
 Effectively Wild Subreddit
 Effectively Wild Wiki
 Apple Podcasts Feed 
 Spotify Feed
 YouTube Playlist
 Facebook Group
 Bluesky Account
 Twitter Account
 Get Our Merch!


Injuries Will Sideline the Astros’ Alvarez and Blue Jays’ Bichette Until the Playoffs — or Longer

Nick Turchiaro and Erik Williams-Imagn Images

The Astros have spent nearly the entire season missing the superstar version of Yordan Alvarez, first because the 28-year-old slugger struggled during March and April and then because he missed nearly four months due to a fractured metacarpal in his right hand. He heated up upon returning to the lineup in late August, but on Monday night he sprained his left ankle, an injury likely to sideline him for the rest of the regular season and perhaps longer. He’s not the only American League star whose best hope for returning to the lineup is during the playoffs, as Blue Jays shortstop Bo Bichette has been ruled out for the rest of the regular season with a sprained ligament in his left knee.

Alvarez suffered his injury in the first inning of Monday night’s game against the Rangers in Houston. He followed Jeremy Peña’s leadoff single by drawing a walk against Jack Leiter. Carlos Correa then hit a weak comebacker toward the mound; Leiter tried to throw while on the ground but airmailed the ball far beyond the reach of first baseman Jake Burger. Peña scored easily as Adolis García retrieved the ball, but the right fielder’s throw home was nearly in time to nab Alvarez, who instead of sliding went in standing up, only to slip on home plate. He immediately began limping, had to be helped into the dugout, and did not return to the field — he started in left field — when the half-inning ended. Instead, right fielder Jesús Sánchez shifted to left and Zach Cole entered the game in right. Cole, who homered off the Braves Hurston Waldrep in his first major league plate appearance on September 12, hit his second homer off Leiter in the fifth inning of what turned out to be a 6-3 win.

“When he stepped on home plate, I had a front-row seat,” Peña said after the game. “His ankle kind of twisted, and when he had to plant again, I saw it twist again. And it’s not pretty. You don’t want to see that, especially Yordan Alvarez. We need him.”

You can see video of the play in question here, but you’re on your own if you want to seek out the still shot of Alvarez’s leg bending in ways that it shouldn’t. Colleague Dan Szymborski invoked Stretch Armstrong in his piece on the teams most impacted by injuries this year, which should give you an idea. Read the rest of this entry »


Brandon Mann Addresses a Bevy of Miami Marlins Changeups

Sam Navarro-Imagn Images

Brandon Mann’s playing career was coming to a close when he was featured here at FanGraphs in June 2020. A southpaw whose professional experience spanned 17 seasons — including part of 2018 with the Texas Rangers — he was soon to turn from hurler to tutor. Mann served as a pitching coordinator for the KBO’s Lotte Giants in 2021, then spent the next two years as a trainer and pitching coordinator at Driveline. His last two season have been in Miami. Mann joined the Marlins as a pitching strategist in 2024, and this year he is their bullpen coach.

Given his background and expertise, as well as my being intrigued by some of the talented arms on the Miami pitching staff, I made it a point to catch up with Mann when the Marlins visited Fenway Park in mid-August. I wasn’t sure exactly what we’d talk about, but I knew that it would be a good pitching conversation. We ended up focusing on changeups and splitters.

———

David Laurila: You just told me that Edward Cabrera has a unique changeup. What makes it stand out?

Brandon Mann: “The most unique part is how hard it is [94.2 mph, per Baseball Savant]. The movement profile is similar to a sinker, although it has a little bit more depth than sinkers in general. It’s really more of the spin. Say he throws a changeup and a sinker and both are 96 [mph]. The movement profiles would be almost identical, but the changeup is going to fall off more because it’s got as much as 600 fewer rpm. That’s super unique.

“I don’t know if the movement gives it justice when you actually see… say it’s three [inches] of induced vertical break and 16 [inches] horizontal — and then he throws a sinker at six and 18. They’re the same velo, and the sinker stays up, but the changeup falls off, and somebody swings and misses at it. A lot of that is the spin component. Again, it’s similar velo, but anywhere from 500 to 600 rpm less spin. Read the rest of this entry »


Forget MeatWaste, Who’s Crushing Shadowballs?

Mark J. Rebilas-Imagn Images

As you surely know, Michael Baumann has been writing about MeatWaste for two weeks now. Specifically, he’s been writing about who is great at hitting pitches in the Meatball and Waste portions of the strike zone, according to Statcast’s Attack Zones diagram. Those are hitter’s pitches. The meatball zone right down the middle (zone five in the diagram below) is where batters crush the baseball, and the waste zone far away from the strike zone is where they have no trouble laying off pitches that are certain to be called balls. Baumann wrote about how the Brewers are great as a team at capitalizing on those pitches last week, and then today he ran down the individual MeatWaste leaderboard, a phrase I didn’t know I needed in my life until Tuesday.

This is useful information with a delightfully repulsive name, and it made me wonder about the opposite leaderboard. MeatWaste tells you who’s crushing hitter’s pitches, but let’s find out who’s excelling against pitcher’s pitches. Technically, that isn’t the opposite of MeatWaste. MeatWaste makes up just nine of Statcast’s 33 attack zones. The true opposite would include the other 24 that make up the Chase, Shadow, and Heart zones (except for zone five, the spot right over the very middle). It would also look very, very similar to the list of the best hitters in the game.

The Opposite of MeatWaste Leaderboard
Player Run Value/100
Aaron Judge 1.83
Vladimir Guerrero Jr. 1.72
Shohei Ohtani 1.72
Nick Kurtz 1.56
Juan Soto 1.47
Source: Baseball Savant
Minimum 1,000 total pitches.

This list isn’t telling us anything we don’t already know because we’re looking at too much of the zone. If we want the opposite of MeatWaste, we need to look at the edges of the strike zone, where swing decisions are difficult and loud contact is hard to come by. Statcast calls this the shadow zone, and it includes any pitch within one baseball’s width (or 2.9 inches) of the edge of the strike zone.

What do we call the opposite of MeatWaste? Is it meat that’s the opposite of waste, like filet mignon? If we acknowledge vegetables as the opposite of meat (though you could make a strong argument for pudding), does that mean it’s veggie waste, like edamame shells? Or does that mean it’s the opposite of both meat and waste, like an artichoke heart? In the end, I decided to keep it simple and just follow Statcast’s taxonomic principles. These aren’t Meatballs, they’re Shadowballs, and if you know anyone who goes by that nickname, I urge you to explain in the comments how they came by it. Read the rest of this entry »


MeatWaste Part 2: The Re-Meatening

Benny Sieu-Imagn Images

Last week, I dug into the data a little to see if there was any empirical basis to the suspicion that the Brewers lineup might not be cut out for October. The result was a new metric, if you want to call it that, called MeatWaste%. This number — the percentage of pitches that end up either in the dead center of the strike zone or out in Baseball Savant’s Waste region — I used as a proxy for pitcher quality. MeatWaste pitches are gifts to the batter, the kind of offering that produces an instant swing decision and either an easy take or a full-force swing.

I found two things: First, that the Brewers are better, relative to the league, on these two pitch locations than they are on the whole. And second, that these easy opportunities come around often in the regular season, but disappear in close playoff games. Simple enough, though there are limits to what this finding allows us to infer about the Brewers’ future. It’s why they play the games, after all. Read the rest of this entry »


Effectively Wild Episode 2376: No Spoilers

EWFI
Ben Lindbergh and Meg Rowley banter about the state of the wild cards and whether the pennant races have been more exciting than forecasted despite the lack of actual changes in the playoff field, Cal Raleigh’s latest exploits, Geraldo Perdomo’s quiet excellence, the Orioles’ 2026 outlook, the Dodgers’ rotation and bullpen, Shohei Ohtani’s playoff role(s), the bouncebacks of Mookie Betts and George Springer, Yordan Alvarez’s ankle, James Wood and Spencer Jones slumps, season-ending schedules, and whether teams playing spoiler is satisfying for fans.

Audio intro: Jimmy Kramer, “Effectively Wild Theme
Audio outro: Luke Lillard, “Effectively Wild Theme

Link to FG playoff odds
Link to Clemens on the playoff odds
Link to Paine on the Mets
Link to Clemens on Raleigh
Link to FG WAR leaderboard
Link to Orioles report
Link to Dodgers rotation ranking
Link to Dodgers reliever ranking
Link to team SP projections
Link to Dodgers rotation story
Link to Ohtani starting story
Link to Ohtani outfield story
Link to Perdomo/Betts leaderboard
Link to Craig on the Dodgers
Link to Rob on the zombie runner
Link to Petriello on Jones
Link to Apple TV+ baseball doc
Link to Astudillo news

 Sponsor Us on Patreon
 Give a Gift Subscription
 Email Us: podcast@fangraphs.com
 Effectively Wild Subreddit
 Effectively Wild Wiki
 Apple Podcasts Feed 
 Spotify Feed
 YouTube Playlist
 Facebook Group
 Bluesky Account
 Twitter Account
 Get Our Merch!


If Cal Raleigh Does It, When Will It Be?

Joe Nicholson-Imagn Images

Cal Raleigh is hot. Thumping three homers in a span of two days has put Big Dumper at 56 on the season with 11 games left to play. That binge gives him a realistic shot at hitting a nice round 60 on the season, a threshold that only an elite few sluggers have ever reached. He’s doing it as a catcher, which is absurd. He left the old single-season home run record for catchers in the dust a long time ago.

As I learned all the way back in first grade, 62 is only two more than 60. Given Raleigh’s predilection for blasting bombs in bunches – he hit six in six games earlier this year, and nine in a separate 11-game stretch – Aaron Judge’s single-season AL home run record (and for some people, though not me, the “true” home run record) is definitely in play.

As is tradition at FanGraphs, when someone goes for a home run milestone, we forecast when it might happen. Whether it’s Judge’s quest for 62, Albert Pujolspush for 700, or Shohei Ohtani’s bid for 50/50, it’s fun and useful to predict when the actual milestone game will occur. I’ll start with the methodology, but if you’re not into that, there are some tables down below that will give you an idea of when and where Raleigh might hit either his 60th, 62nd, or 63rd homer.

I started with our Depth Charts projection for Raleigh’s home run rate the rest of the way. That’s based on neutral opposition, so I also accounted for park factors and opposition. Since Raleigh is a switch-hitter, I used the specific pitchers the Mariners are expected to face to determine whether he starts each game batting lefty or righty, and also used those pitchers’ home run rate projections to determine opponent strength. I used a blend of projected starter, home run rate, and observed bullpen home run rate to come up with a strength of opposition estimate. That let me create a unique home run environment for each game. I also told the computer to randomly select how many plate appearances Raleigh receives each game, with an average of five most likely but some chance of four or six. Read the rest of this entry »


Parker Messick and His Well-Executed Changeup Are Impressing in Cleveland

Eric Canha-Imagn Images

BOSTON — The Cleveland Guardians drafted Parker Messick 54th overall in 2022, and the decision to do so is looking increasingly shrewd. Since making his major league debut on August 20, the 24-year-old southpaw out of Florida State University has taken the mound five times and fashioned a 1.84 ERA and a 2.50 FIP over 29 1/3 innings. And while his 18.3% strikeout rate in the majors isn’t impressive, Messick fanned 29.1% of batters prior to his call-up, suggesting the strikeout stuff is still to come. When Eric Longenhagen wrote about Messick in late May, he pointed out that the lefty “leads the minors in strikeouts since 2023.”

What makes Messick effective is a combination of factors that belie his pedestrian velocity and lack of an elite breaking ball. As our lead prospect analyst explained when ranking the 50-FV prospect fourth in the Guardians system, “Messick’s 92-mph fastball doesn’t have a ton of carry to it, but it does run uphill and can garner whiffs via its angle.” Eric went on to write that his “changeup is at least plus.”

Messick considers his changeup to be his best pitch.

“I would say that it is,” Messick told me when Cleveland played in Boston earlier this month. “As far as swing-and-miss goes, yeah. When it’s paired right with my other stuff — when I’m tunneling it off of my other pitches — is when it is at its best. It does have some sharp movement down at the end, I guess. It also has just enough speed differential to get that swing-and-miss at the bottom when they’re out in front of it.” Read the rest of this entry »