Craig Edwards FanGraphs Chat–7/11/2019

July 11, 2019
There are generally three ways of bringing new players into a baseball organization: trades, free agency, and amateur signings, either through the draft or international free agent market. There isn’t necessarily a “best” way, as successful teams are built using a wide variety of methods. The table below shows WAR totals for the first half of the season split into the three categories above, along with waivers and Rule 5 picks, which constitute a very small portion of the total:

As the chart shows, homegrown talent and players acquired through trade come out pretty far ahead of free agency. In terms of the sheer number of players, there are over 400 in each of the homegrown and trade sections, with around 300 in free agency. As for the impact, it’s hard to argue with the importance of homegrown players when looking at the graph above. Breaking the homegrown section down, we can see how each team has done this season with players they’ve drafted or signed internationally and then developed in their organization:

One of the effects of the top-heavy American League and the middle-heavy National League was the NL posting a 158-142 record in interleague play last season. While the AL took the All-Star Game in extra innings and the Boston Red Sox won the World Series, the NL won more regular season games. We don’t yet know how this year’s All-Star Game or World Series will play out, but the NL has again taken a healthy lead when it comes to interleague play with an 83-65 record through games on July 1. Last year, the AL appeared to have the edge on paper when it came to the All-Star Game rosters, but the teams seem evenly matched this season.
The graph below shows all position players named to the initial All-Star Game rosters through play on July 6.
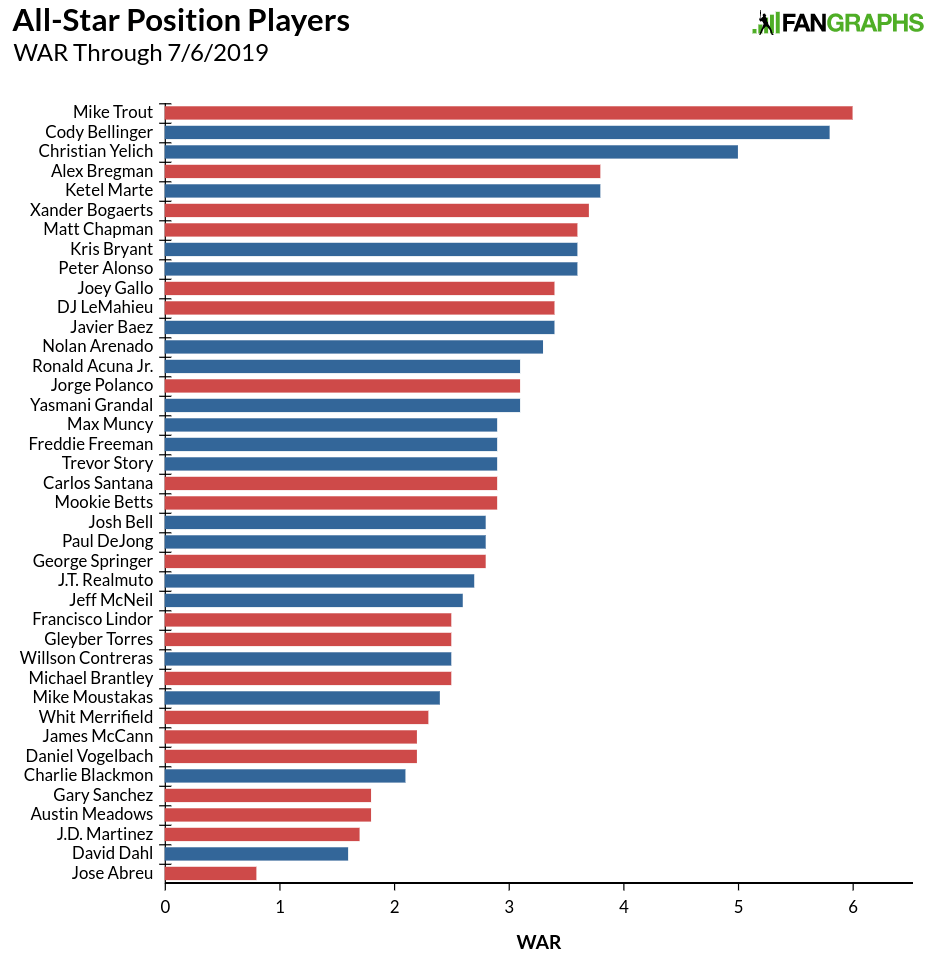
The National League has three of the top five spots with Mike Trout and Alex Bregman representing the AL. After Trout, the NL is represented by 12 of the next 17 players. The American League does have some pretty big names with better track records near the bottom of the graph like Mookie Betts, Whit Merrifield, Francisco Lindor, and J.D. Martinez, those players have yet to put everything together this season. The NL has a roughly seven-win advantage at 62.9 to 55.9, which amounts to roughly a third of a win per player. As Devan Fink noted last week, the All-Star starters by WAR weren’t too far off from the actual results, and Xander Bogaerts‘ late inclusion means the top nine players by first-half WAR made the team. Of the top-30 position players by WAR, only Marcus Semien, Max Kepler, Rafael Devers, Yoan Moncada, and Eduardo Escobar failed to make the rosters.
Looking solely at half a season’s worth of games isn’t necessarily the best indicator of talent. One could argue that the best measure of how good a player is right now might be that player’s projections over the course of the rest of the season. Here are those projections in graph form.
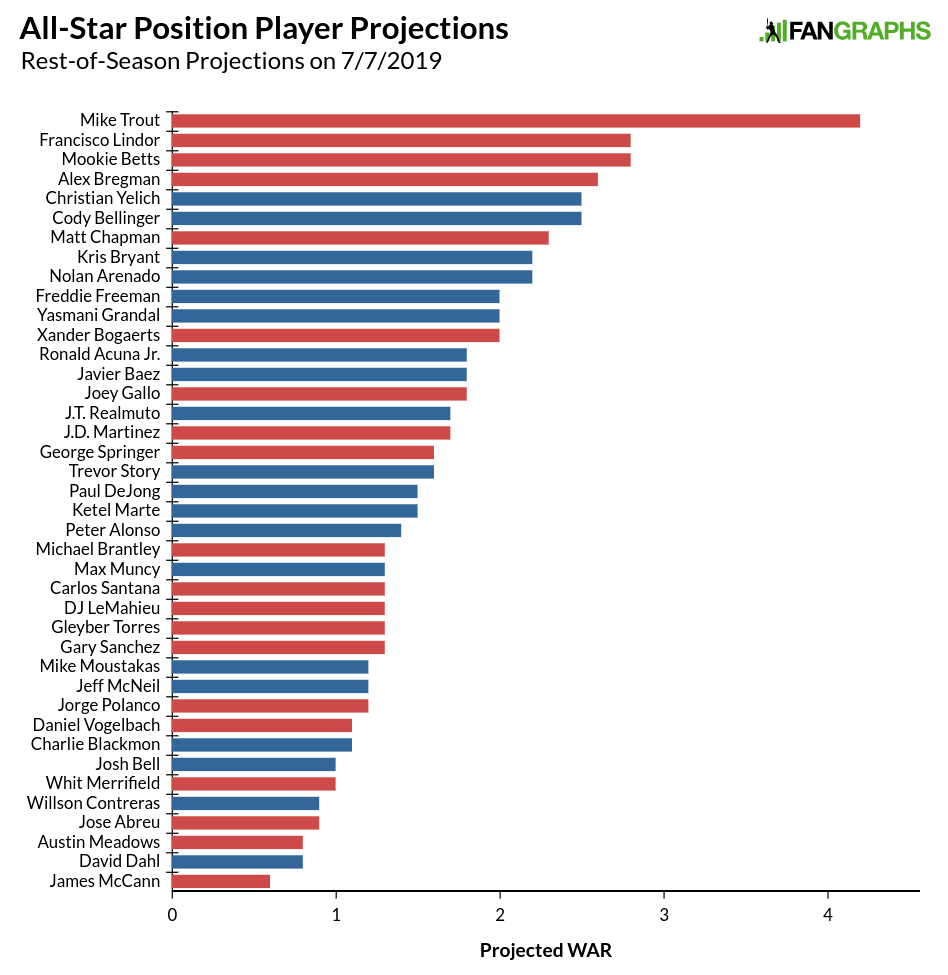
That Mike Trout is something else. His 4.2 projection for the second half of the season is far and away ahead of everyone else. His half-season projection would have placed him among the top 30 preseason projections. Put another way, if Mike Trout only played in every other game, he would still be All-Star worthy. We see Betts and Lindor’s talent level rise near the top of the graph above, and the NL can’t quite recover. Before roster changes, the NL had the advantage, but taking away Anthony Rendon from the NL and replacing Hunter Pence in the AL shifted the projections toward the AL with a 33.9 to 32.2 WAR advantage. Even with Trout, the AL still trails the NL in projected WAR, 34.9 to 33.7.
This how the position player side of the rosters break down.
| WAR | ROS Projections | Total | |
|---|---|---|---|
| NL | 62.9 | 32.2 | 95.1 |
| AL | 55.9 | 33.9 | 89.8 |
| Difference | 7.0 | -1.7 | 5.3 |
On the pitching side, the AL is bringing two more relievers than the NL, so in total WAR, the NL has a built-in advantage given the innings starters can pile up, though removing Max Scherzer leaves a pretty big dent in the NL squad’s top of the rotation.
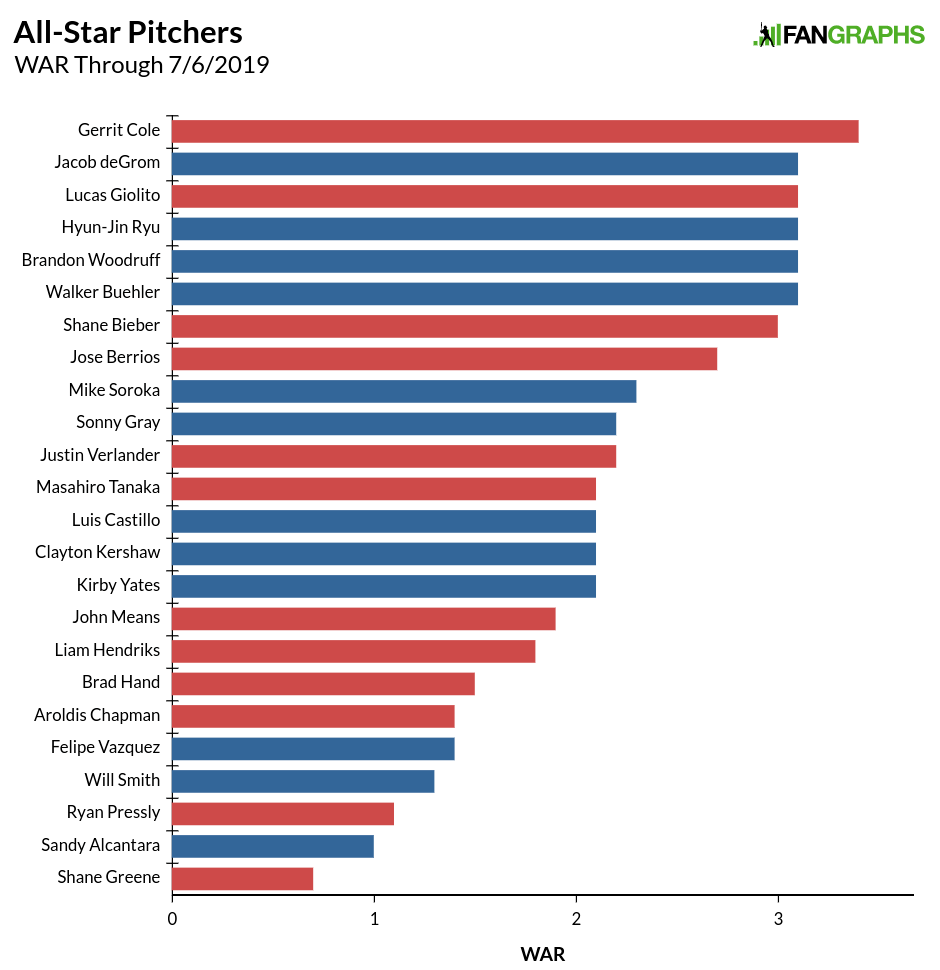
The NL tops the AL 26.9 to 24.9, with the additional starters tipping things to the senior circuit. Given ERA’s relative prominence, we might expect a few more missing players from our WAR leaderboards in the midsummer classic, though we still have a pretty good representation based on WAR. Lance Lynn, the AL’s WAR leader, did not make the squad. The only other pitcher in the top 12 not to make the roster at some point in this process was Stephen Strasburg. In the top 20, Frankie Montas, who is suspended, didn’t make the team for obvious reasons, while Matthew Boyd, Chris Sale, Zack Wheeler, and German Marquez also failed to make the team. Several players in the bottom half of the graph above were their respective team’s lone representative, indicating that some of the choices are more roster filler than picking the most deserving players.
As for the projections, even without Scherzer, the NL still has the top projected pitcher in Jacob deGrom.
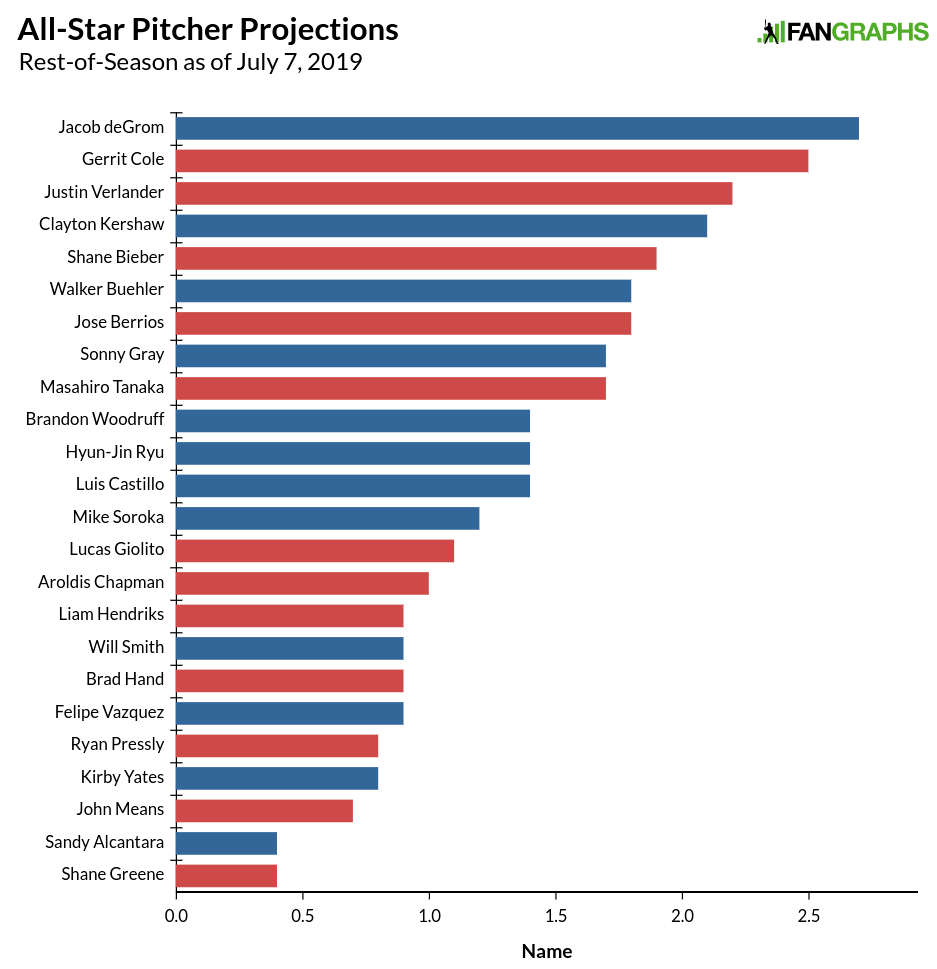
Without Scherzer, a sizable NL advantage shrinks down to less than a win. All of the relievers near the bottom along with Baltimore’s John Means and Miami’s Sandy Alcantara help create the NL’s small advantage due to fewer relievers. In terms of projections, Chris Sale is the big name missing. In comparing the pitching staffs, the leagues look like this:
| WAR | ROS Projections | Total | |
|---|---|---|---|
| NL | 26.9 | 16.7 | 43.6 |
| AL | 24.9 | 15.9 | 40.8 |
| Difference | 2.0 | 0.8 | 2.8 |
When we put it all together, the NL has the advantage in performance so far this season, but the projections are nearly identical.
| AL | NL | Difference | |
|---|---|---|---|
| Position Player WAR | 55.9 | 62.9 | 7.0 |
| Pitching WAR | 24.9 | 26.9 | 2.0 |
| TOTAL | 80.8 | 89.8 | 9.0 |
| Position Player Proj. WAR | 33.9 | 32.2 | -1.7 |
| Pitching Proj. WAR | 15.9 | 16.7 | 0.8 |
| TOTAL | 49.8 | 48.9 | -0.9 |
Before the injury replacements, the NL’s advantage was sizable. Losing the two Nationals’ stars in Rendon and Scherzer was a pretty big blow and essentially leveled the playing field in terms of talent. At the end of the year, the NL squad is likely to outproduce their AL foes. As for how much this advantage will actually matter in the All-Star Game, it probably won’t. It is a one-game exhibition and the game isn’t played repeatedly over the course of a season. With similar projections, the leagues looked pretty balanced. The American League has won the last six All-Star Games, but that history isn’t likely to matter for this year’s contest.
In April, Matthew Boyd gave up two homers. In May, five balls left the yard against the Tigers lefty. Last month, Boyd’s breakout season slowed as he gave up 10 homers. As we enter July, Boyd has a solid 3.57 FIP and a 3.72 ERA, and has been worth 2.6 WAR, which ranks 17th among pitchers this season. Those are good numbers to be sure, but as June began, Boyd’s ERA and FIP were both 2.85 and his 2.5 WAR ranked third for pitchers behind only Max Scherzer and Stephen Strasburg. Boyd’s strikeouts and walks have been slightly better than they were earlier in the season; his BABIP is slightly higher and his LOB% is a little bit lower. But that doesn’t explain his 5.90 ERA and 5.37 FIP. It’s the home runs that are hurting Boyd, and with the trade deadline a month away, trying to determine whether they are randomly bunching across a few starts or the beginning of a trend is an important exercise for teams looking to reinforce their rotations.
As for how Boyd broke out in the first place, the answer is a bit easier to find — the work has already been done for us. Sung-Min Kim detailed Boyd’s transformation earlier this season, showing how Boyd lowered his arm slot to gain spin on his fastball, and raised the location of the pitch. He also buried his slider more often, gained a consistency in his delivery, and basically eliminated the two-seamer. David Laurila also wrote on Boyd earlier this season, discussing his work with Driveline to create a better slider.
Boyd’s season can be carved up any number of ways depending on how you might want to use (and abuse) arbitrary endpoints. If we took away the first three spectacular Boyd starts of the season, where he struck out 29 and walked six, his FIP is 4.09, his ERA is 3.95, and he’s averaging nearly two homers every nine innings. If we look at just his first 10 starts, he’s one of the best pitchers in baseball. He has five starts with 0 or 1 runs. He’s only got two starts where his strikeouts don’t at least equal his innings pitched. The only time he walked as many as three batters, he struck out 13 Yankees. If Boyd had evenly spaced out his 17 homers across his starts, we’d be discussing a moderate breakout. Instead, we have a massive breakout followed by concern. Read the rest of this entry »
A few weeks ago, the Cubs ended months of waiting by signing Craig Kimbrel to be their closer. Due to the lack of a spring training, Kimbrel was sent down to the minors for a bit to make sure he could still pitch. In Triple-A Iowa, Kimbrel made four appearances and pitched 3.2 innings. He struck out four of the 14 batters he faced, walked just one and gave up a lone run on a solo homer. The Cubs, satisfied that he was well enough to face major league hitting, called Kimbrel up yesterday.
After the Braves jumped out to a 6-1 lead, it didn’t look like Kimbrel’s services would be needed. But the Cubs stormed back with eight runs across innings four through six and the new Cubs’ closer was asked to come on for the save in the ninth inning, protecting a 9-7 lead. The first batter to the plate was catcher Brian McCann. After taking a 98 mph fastball at the bottom of the zone for strike one, McCann fouled off three more fastballs. Then Kimbrel tried to drop in his curve:
McCann was obviously displeased, but the pitch might have been even closer to the strike zone than the box on the television suggested, as it did look to catch the corner. Kimbrel threw seven curves among his 20 pitches. As for the movement on the pitch, it was in line his numbers from last season, though its drop yesterday and last season wasn’t quite as big as it had been in the years prior. Read the rest of this entry »
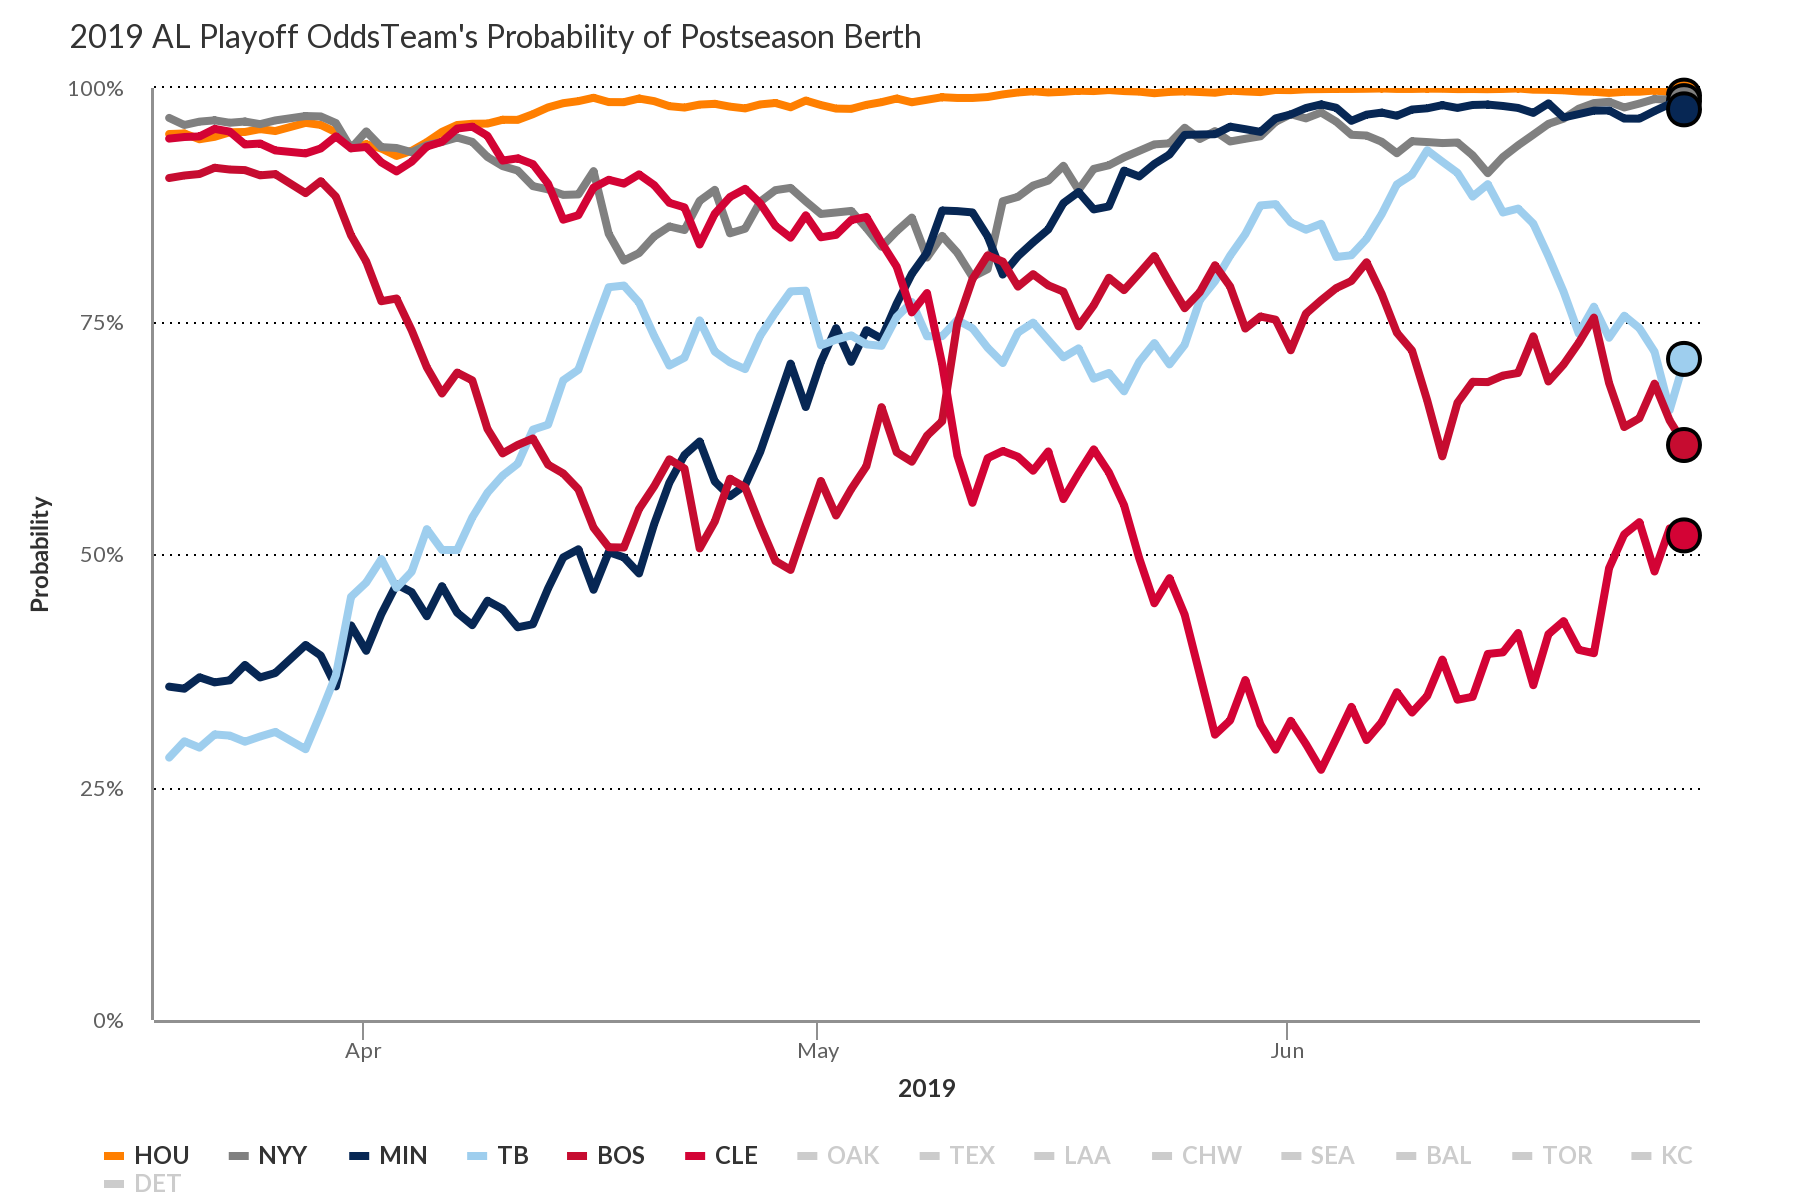
News broke last night that Rays’ prospect Brendan McKay will make his debut on Saturday; Marc Topkin of the Tampa Bay Times had the initial report. The reasons for Tampa calling up McKay, who was ranked 14th overall this spring by Eric Longenhagen and Kiley McDaniel before moving up to 11th on THE BOARD in the post-draft update this month, are threefold. First, the Rays need a pitcher Saturday. As Topkin noted in his piece, Ryan Yarbrough pitched three innings in last night’s 18-inning win over the Twins, and he won’t be able to take the bulk of the innings tomorrow as originally planned. Second, the Rays are in what should be an incredibly close race for the playoffs and need every competitive advantage they can get. And third, tying into the second, McKay is a very talented pitcher who gives the Rays the best shot at winning.
Before getting to McKay’s talents, let’s first examine the competitive landscape in the American League. Much has been made of the parity in the National League, with nearly every teams having some shot at the playoffs halfway through the season. The top-heavy nature of the American League has made for a bunch of haves and have-nots, with only a handful of teams having a realistic shot at the playoffs. Looking at the playoff odds, the Rays are one of those teams:
In his rookie season, Pete Alonso has already hit 27 home runs, second in baseball behind Christian Yelich. He’s sporting a .281/.371/.634 slash line that’s created a 161 wRC+, which trails only Cody Bellinger, Mike Trout, and Yelich. Even after adjusting for defense, Alonso’s 3.3 WAR is seventh among all position players. With numbers like that, it might be difficult to believe that Alonso has already gone through a prolonged slump with just half the season finished. He has, though. Behold:
| PA | HR | BB% | K% | BABIP | ISO | wRC+ | |
|---|---|---|---|---|---|---|---|
| 4/28-5/28 | 109 | 8 | 4.6% | 31.2% | .203 | .303 | 95 |
Hitting like a slightly below-average player for a month might not be classified as a slump for most, but Alonso has been one of the most productive hitters in the game, and the middle-third of his season thus far is a departure from the rest of his numbers. I could have massaged the numbers to make them slightly worse by going from April 30 to May 25, but the above sample fits neatly as the middle third of Alonso’s season so far. Earlier this season when Alonso was doing very well, Ben Clemens discussed the good and bad aspects of the first baseman’s game, though Ben’s focus was on the good as Alonso was annihilating baseballs at the time:
The two parts of this article are the Pete Alonso experience in a nutshell. The quality of contact isn’t the question — when Alonso hits something, it goes a long way. The question is always going to be whether he can make enough contact to tap into his tremendous raw power. The early returns are promising, but they’re also confusing. Alonso can hit — not that there were many questions about that before — but he’s been a pure manifestation of 80-grade power this year. He’s also struck out 30% of the time, which is, you know, not great.
What we saw from Alonso for much of May was the troublesome aspect of his profile. He was swinging and missing a lot, and not drawing walks. He was hitting home runs, but he produced such a low batting average that his hitting line was below average. We could chalk the BABIP up to bad luck, but his expected numbers from Statcast weren’t much better than what he actually produced. For a first baseman with potential fielding issues, that profile is nearly unplayable on a contending team. Alonso was experiencing his first adjustment from pitchers, and for about a month, he adjusted poorly.
Here are Alonso’s plate discipline numbers from the first few months of the season:
| O-Swing% | Z-Swing% | Swing% | O-Contact% | Z-Contact% | Contact% | Zone% | F-Strike% | SwStr% | |
|---|---|---|---|---|---|---|---|---|---|
| 3/28-4/27 | 33.0 % | 63.4 % | 44.8 % | 58.8 % | 83.1 % | 72.1 % | 38.8 % | 59.6 % | 12.5 % |
| 4/28-5/28 | 38.6 % | 69.8 % | 49.5 % | 68.9 % | 83.7 % | 76.2 % | 35.1 % | 56.9 % | 11.8 % |
Pitchers threw to Alonso more carefully and he responded in the worst way possible: swinging more. His O-Swing% numbers were already below average at the start of the season, and for a month, he got worse. In visual form, here’s Alonso’s swing percentage heatmaps from those periods:

Maybe those maps don’t look completely different, but look at the sections up and in, and low and away. On the left map from April, Alonso isn’t swinging frequently at those pitches, while in May, he offered at the same pitches more often. That he made contact more often on pitches out of the zone might have prevented even more strikeouts, but it also caused weaker contact when Alonso put the ball in play. At the height of his slump, he told Mike Puma of the New York Post about his need to focus on pitch location.
“If I am swinging at junk then they are going to keep throwing it,” he said. “If I am doing my job and swinging at strikes and taking borderline pitches or sitting on good pitchers’ pitches and being locked in on my zone then it is kind of rewarding if I get a quality pitch to hit, whether it be a breaking ball that’s over the middle of the plate or changeup over the middle or fastball.
“For me it doesn’t matter what type of pitch it is, I need something middle, because even if I expand the zone on a fastball then I am still going to get myself out or not get myself in a good count to do damage or help the team.”
Alonso identified and understood his weakness. Making a demonstrable change against the best pitchers in the world can be difficult. Here’s his swing map over roughly the last month:

That area down and in is still the place to throw it if you want to try to get it by Alonso, but he’s pretty clearly swung less in an effort to avoid chasing bad pitches. That up and in area, and the low and away area look even better than they did the first month of the season. The lack of swings on the outside of the zone isn’t an indication it is a safe place to throw there, though, as Cole Hamels recently found out:
This is what Alonso’s plate discipline numbers have looked like over the past month compared to the first two we saw above:
| O-Swing% | Z-Swing% | Swing% | O-Contact% | Z-Contact% | Contact% | Zone% | F-Strike% | SwStr% | |
|---|---|---|---|---|---|---|---|---|---|
| 3/28-4/27 | 33.0 % | 63.4 % | 44.8 % | 58.8 % | 83.1 % | 72.1 % | 38.8 % | 59.6 % | 12.5 % |
| 4/28-5/28 | 38.6 % | 69.8 % | 49.5 % | 68.9 % | 83.7 % | 76.2 % | 35.1 % | 56.9 % | 11.8 % |
| 5/29-6/25 | 29.8 % | 59.9 % | 39.9 % | 66.3 % | 84.1 % | 75.3 % | 33.7 % | 59.7 % | 9.9 % |
I highlighted the O-Swing% and Zone% because those stats show the changes pitchers have made against Alonso and how Alonso has responded. Pitchers continue to hope Alonso chases, and are hopeful to avoid the strike zone. The Mets’ slugger initially responded with poor plate discipline but has since responded with fewer swings. As a result, Alonso has been better lately than he was in April when he took the league by storm:
| PA | HR | BB% | K% | BABIP | ISO | wRC+ | |
|---|---|---|---|---|---|---|---|
| 3/28-4/27 | 109 | 9 | 11.9% | 27.5% | .364 | .372 | 182 |
| 4/28-5/28 | 109 | 8 | 4.6% | 31.2% | .203 | .303 | 95 |
| 5/29-6/25 | 114 | 10 | 13.2% | 17.5% | .328 | .394 | 204 |
Alonso has seen a massive decrease in his strikeout rate as pitchers have opted to avoid the strike zone. It’s possible his passivity could be exploited, but that’s a dangerous game given his ability to punish strikes. For good measure, here’s how his Statcast statistics during the same time periods measure up:
| xwOBA | MLB Rank (75 PA) | xwOBACON | MLB Rank (50 BB) | |
|---|---|---|---|---|
| 3/28-4/27 | .407 | 18 | .530 | 10 |
| 4/28-5/28 | .336 | 107 | .464 | 34 |
| 5/29-6/25 | .472 | 2 | .539 | 3 |
Since the end of May, only Mike Trout and Jorge Soler have been hitting the ball with more authority when contact is made. Factoring in walks and strikeouts, only Trout has exceeded Alonso by Statcast’s metrics over that span. Statcast’s numbers align with our own, as Mike Trout has a 227 wRC+ since May 29, with Alonso second to Trout with a 204 mark just besting Christian Yelich. He’s made some of my skepticism at his pace seem foolish, but at least I’m in good company along with a lot of the game’s best pitchers.
After putting up an MVP-type performance in 2018, José Ramírez has not been a good baseball player this season. It’s not like last season came out of nowhere either. In 2016, Ramírez broke out with a five-win campaign and followed that up with a 6.5-WAR season in 2017. That the Cleveland third baseman would take another step forward last year as a 25 years old was not unexpected. What has been unexpected is the fall Ramírez has taken in 2019. With nearly half the season gone, Ramírez has been a replacement-level player with a 68 wRC+ and a near-complete evaporation of the power that led to 68 homers leaving the yard over the previous two years. Ramírez has been terrible, but he might not actually be that far off from being good again.
Early in the year, Devan Fink noted that Ramírez actually started slumping in the last few months of the 2018 season, and theorized that perhaps Ramírez was trying too hard to beat the shift.
Why would Ramírez start trying to hit the ball the other way, especially if that’s not what works for him? One answer could be that he began trying too hard to beat the shift. Ramírez is a switch-hitter, and he was shifted at a drastically different rate when he batted right-handed (6.3% of the time) versus left-handed (53.0% of the time). If Ramírez was truly getting in his head and trying too hard to beat the shift, then we’d expect to see his pull percentage drop even further for when he hit lefty versus when he hit righty. And that’s exactly what happened. While Ramírez did see his pull-rate drop by not-insignificant 9.2 points as a right-handed hitter from prior to the slump to during it, his pull-rate dropped by 19.2 points (!) as a lefty.
Nearly halfway through this season, Ramírez’s pull rate as a lefty is now pretty close to where it has been the past few seasons. That doesn’t mean that Fink was wrong about what was going on, as Ramírez could have made an adjustment to start pulling the ball again. If Ramírez has made an adjustment, it clearly isn’t working. On twitter, Mike Petriello advanced the following argument.
I'm not saying this is "the" thing, but it's definitely "a" thing pic.twitter.com/BGGaCtKzrF
— Mike Petriello (@mike_petriello) May 28, 2019
There’s got to be something to the increased launch angle causing more poorly hit balls. Petriello started a new thread here discussing weaker contact, and Mike Podhorzer discussed the weaker fly ball contact over at RotoGraphs. A year ago, Ramírez hit 67 balls with a launch angle of at least 40 degrees as a lefty, essentially automatic outs. This season, he’s already hit 41 such batted balls. That can’t really be all of the issue though. Much of Ramírez’s increase in launch angle has happened on the right side of the plate, and he’s actually performed reasonably close to last season as a right-hander. The switch-hitter’s average launch angle from the left side has only moved from 19.4 degrees to 21.0 degrees. That’s not nothing, but it’s also not causing a 100-point drop in wRC+ over the last year when hitting against right-handed pitching, either. Read the rest of this entry »
The last two seasons, Jose Berrios has been on the periphery when it comes to considering the best pitchers in baseball. In 2017 and 2018, he put up three-win campaigns and his 6.1 WAR ranked 22nd among pitchers, just behind Blake Snell, Kyle Freeland, and Mike Clevenger, and just ahead of Jon Gray, Charlie Morton, and Kyle Hendricks. It’s a good group to be associated with, and a few of those players have had great seasons, but with Berrios putting up two similar seasons, he’s not viewed in the same way as Snell and he hasn’t been quite good enough to move himself into the top 10 or 15 pitchers in the game. That’s changed this season, as Berrios has been more aggressive, reduced his walk rate, and become more effective against lefties, all of which has resulted in a season that’s put him firmly among the top 10 pitchers in the game.
After an uneven debut season in 2016 at just 22 years of age, Berrios registered solid efforts in 2017 and 2018. Here’s how those seasons compare to what Berrios has been able to do this year:
| IP | K% | BB% | ERA | FIP | WAR | WAR/200 | |
|---|---|---|---|---|---|---|---|
| 2017-18 | 338 | 24.1% | 7.7% | 3.86 | 3.88 | 6.1 | 3.6 |
| 2019 | 104.2 | 22.9% | 4.7% | 2.84 | 3.54 | 2.8 | 4.8 |
The big positive change is the reduction in his walk rate. Berrios has achieved that number mostly by pitching more in the zone. He’s sacrificed his strikeout rate slightly, though he’s made up for that loss by doubling his infield fly rate. Berrios’ FIP this season might not seem drastically altered from the previous two seasons, but with the change in run environment, the three-tenths difference means more than a win over the course of a full season. Berrios did suffer a blister issue in his last start against Kansas City, but currently remains on schedule to start later this week with hopes that the issue is a minor one. Read the rest of this entry »