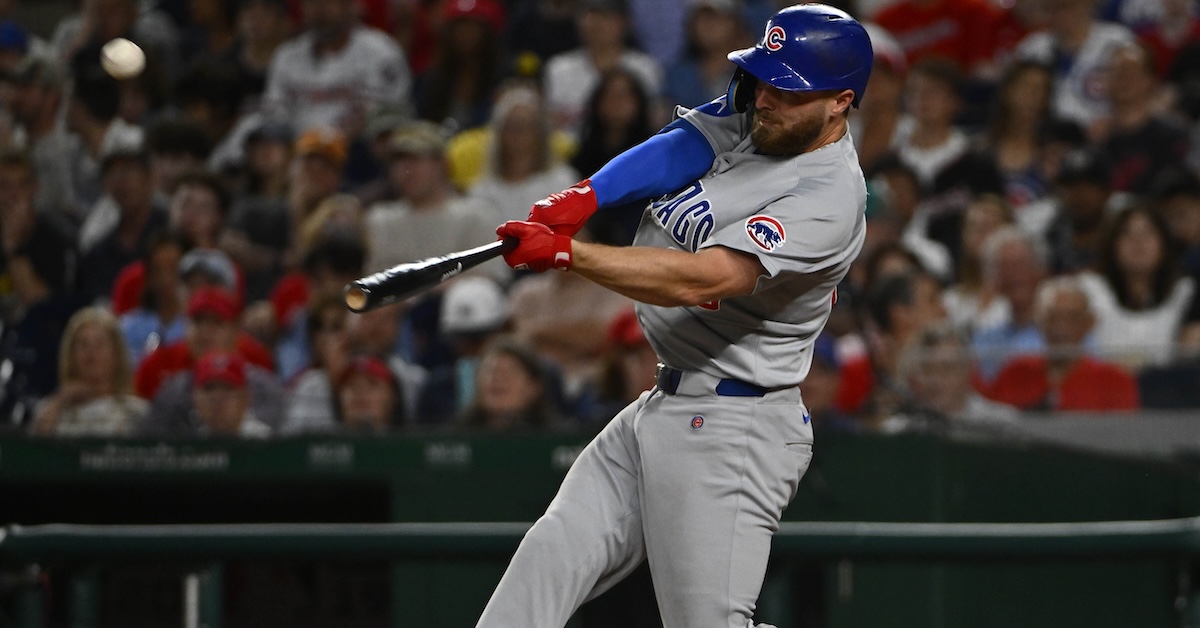
Michael Busch had a pretty nice 2024. In his first taste of everyday playing time in the majors, he hit .248/.335/.440 and socked 21 homers on the way to a 118 wRC+. After years spent in the minors in the Dodgers system, he looked to finally be delivering on his high-strikeout, high-BABIP, high-doubles promise. The Cubs penciled him in as their everyday first baseman. That’s not an imposing batting line, but it’s better than average, so the team spent its winter trading for Kyle Tucker, not trying to upgrade from an already-acceptable situation at first base.
You’ll notice that I said high doubles instead of high power. That’s because Busch had desultory bat speed numbers; he was in the 24th percentile with a 70.3-mph average swing speed. It wasn’t an issue of him having a hard swing and a soft swing that he deployed at different times, either. His fast-swing rate, or the percentage of his swings measured at 75 mph or higher, was a mere 11.3%; league average is around 23%. Busch was adept at getting his barrel to the ball and posting good exit velocity numbers, but that’s generally a recipe for doubles instead of homers. He hit 28 doubles, two triples, and 21 home runs last season, about what was expected from his profile. He got the ball in the air a lot and still hit for a high BABIP – sounds pretty good to me.
What do you think Busch could do to improve his performance in 2025? My immediate answer: Swing faster and hit more homers. Hey, check it out! Busch has already hit 18 homers this year in just over half a season. He’s on pace to shatter his performance last season in pretty much every statistic. He’s hitting .297/.382/.562 with a 165 wRC+. There’s just one problem with my swing-hard-and-prosper theory: He’s not swinging harder. Read the rest of this entry »
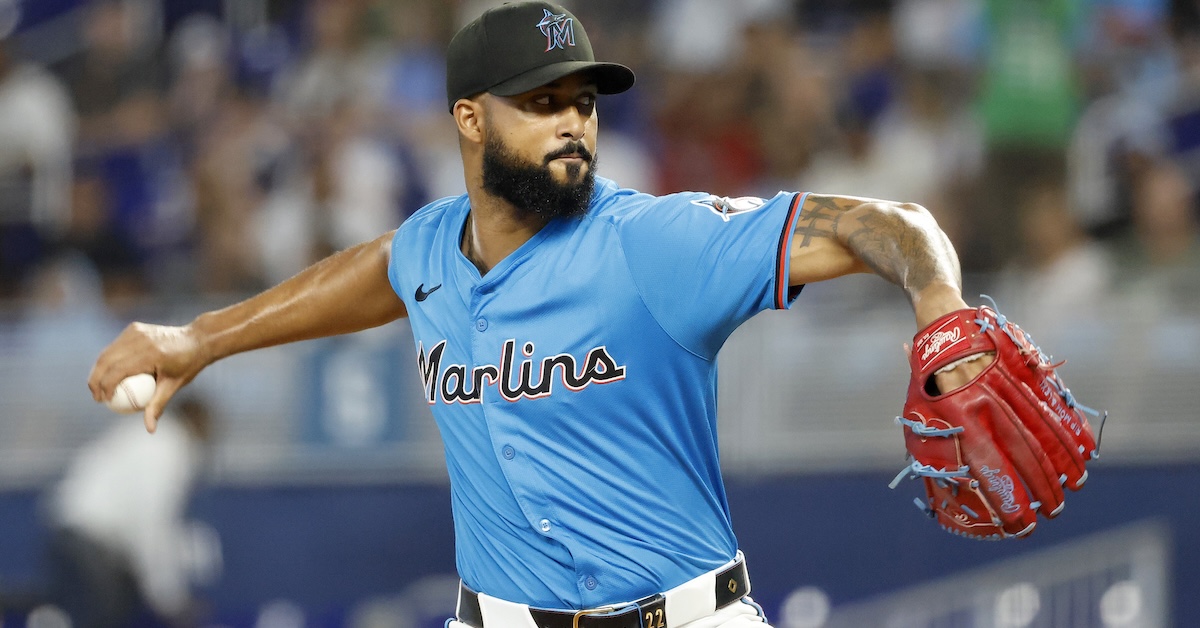
To say the last two-plus years haven’t gone the way Sandy Alcantara had hoped would be a massive understatement. Coming off winning the NL Cy Young award in 2022, his numbers dipped the following season, and he was shut down that September with a flexor strain that required Tommy John surgery in October. He returned this spring with his velocity and movement intact, but his performance to start to the season was rough; he ended April with an 8.31 ERA. The buzz about the Marlins trading Alcantara, a seemingly inevitable outcome for a franchise that is run like a glorified farm affiliate to the rest of baseball, died down temporarily. Sure, things have gone better for the ace recently, but his ERA is still inflated at 7.01, albeit with a relatively sunny 4.55 FIP. Has he done enough to fetch a high price if the Marlins trade him in the coming weeks?
My colleague Michael Baumann wrote about Alcantara back at the start of May, focusing on the righty’s poor April. One of the most concerning aspects of that dreadful start was his 14% walk rate, or 5.9 free passes per nine innings. It wasn’t so much an issue of control — Alcantara’s zone percentage was similar to past seasons — but one of command. You can see the contrast between Alcantara’s best seasons and April in botCmd (PitchingBot) and Location+ (Stuff+).
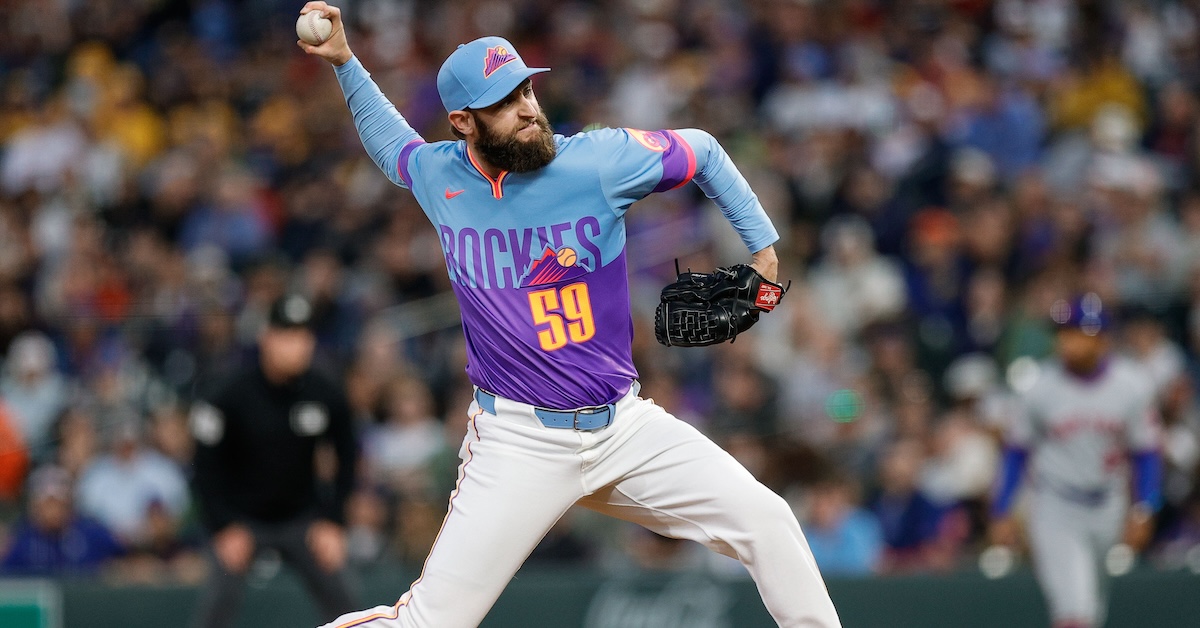
Jake Bird is having a career-best season, and conquering Coors Field has been a big part of the reason why. Over 21 relief appearances comprising 26 1/3 innings, the 29-year-old right-hander has held opposing hitters to a .196/.276/.217 slash line at home. His ERA at the notoriously hitter-friendly venue is 1.71, and his strikeout rate is a healthy 34.3%. Folding in his 18 road outings — including last night’s ERA-inflating, five-run debacle in Boston — Bird has a 3.70 ERA, a 2.92 FIP, and a 27.8% strikeout rate over 48 2/3 frames.
Prior to this year, he’d been a run-of-the-mill reliever on moribund Rockies teams. From 2022-24, Colorado’s fifth-round pick in the 2018 draft had a record of 7-9 with one save and a 4.53 ERA over 177 innings. An unranked prospect coming up through the system, Bird was in possession of an economics degree from UCLA, but boasted little in terms of big league upside. He came into the current campaign projected to essentially replicate the nondescript performances of his previous three seasons.
What is behind Bird’s unexpected emergence as a high-quality bullpen arm? Moreover, what is allowing him to have so much success in his home ballpark? I asked him those questions before Monday’s Rockies-Red Sox game at Fenway Park.
———
David Laurila: How are you having so much success at Coors this year? Can you explain it?
Jake Bird: “I think a lot of it is just the comfortability factor. After being here a few years, I’m realizing that Coors isn’t the big monster that everybody makes it out to be. It’s not that big of a deal. Sometimes [the ball] gets in the air, and the [pitches] move less, but as long as you have a plan of where you want to go with the ball, and sequence pitches, it doesn’t make too much of a difference. Read the rest of this entry »
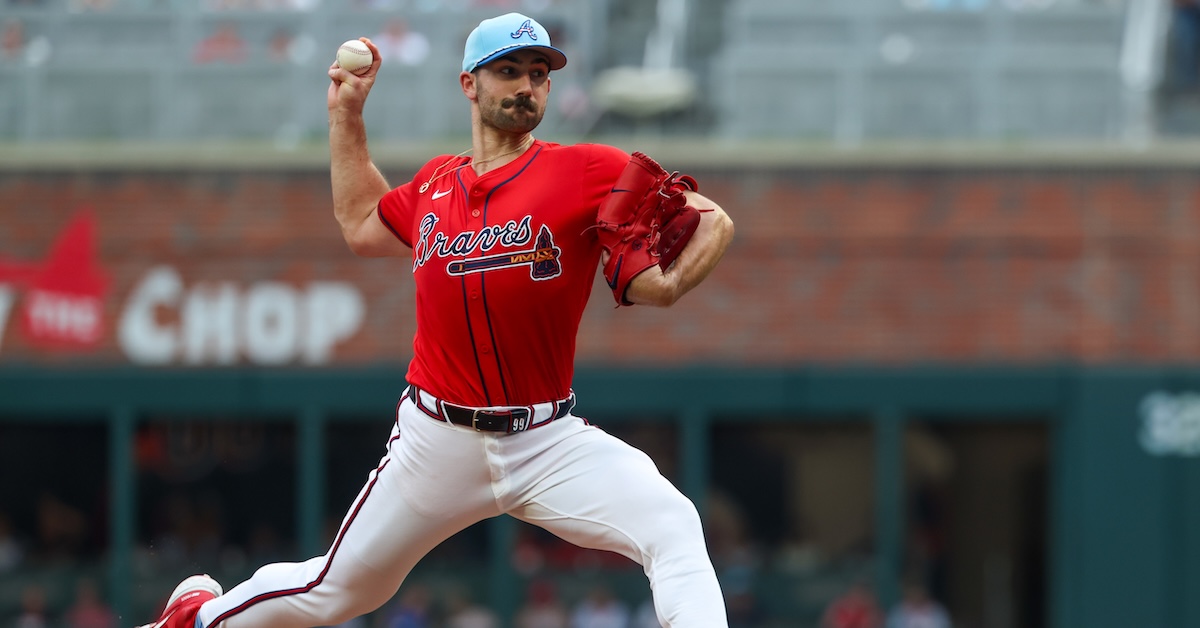
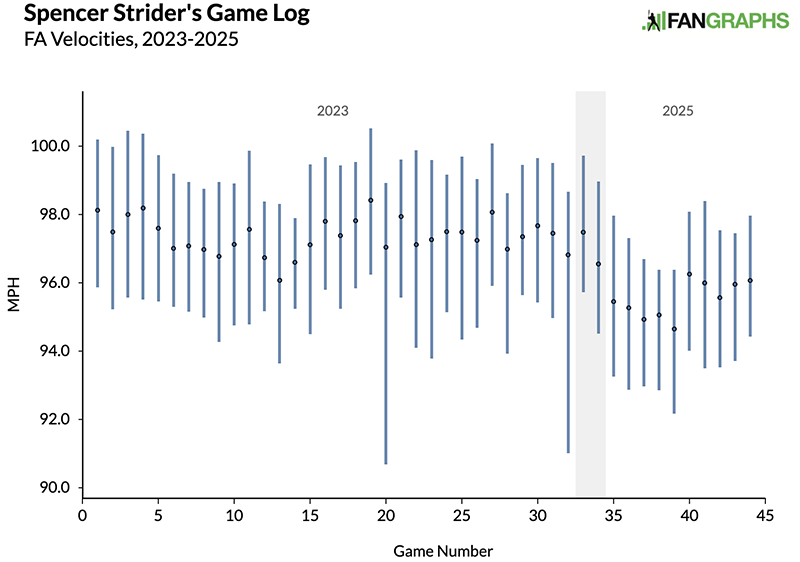
A month ago, I checked in on Spencer Strider’s worrisome return from internal brace surgery. After four starts, Strider was 0-4 with a 5.68 ERA and a 6.40 FIP. His fastball had lost two ticks. His arm angle had fallen by seven degrees. He wasn’t getting chases. He wasn’t missing bats. In short, he didn’t look like Spencer Strider. “There’s no way for us to know how long it might take Strider to get back up to speed,” I wrote, “but the longer he looks like this, the more reason there is to worry.” One month later, I return to you with good news. Strider has made six more starts, and over the last five, he is starting to look different. He’s run a 2.70 ERA and a 2.35 FIP. His strikeout rate is up and his walk rate is down. You might even say that Strider is halfway back.
Once again, the velocity is the big ticket item, so let’s not waste any time:
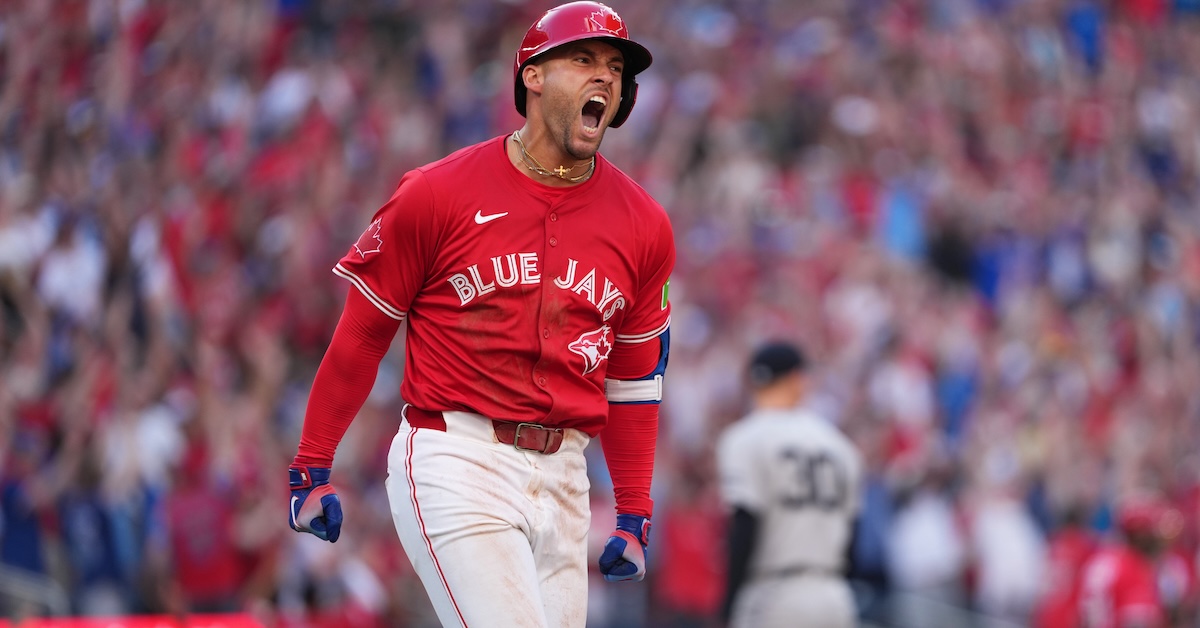
I owe George Springer an apology. Back in March, I wrote an article with a very simple premise: If Springer got off to a terrible start, the Blue Jays needed to be ready to sit him down. He was godawful at the beginning of spring training, he’d been a below-average player for two seasons in a row, and ZiPS saw him as the seventh-best outfielder on the team. Not the seventh-best defensive outfielder; ZiPS projected that Springer would put up 2.2 WAR per 600 plate appearances, a bounce-back campaign, but still worse than the projections of six other Blue Jays outfielders. I wasn’t saying he was washed or anything, but I was concerned that Springer might deliver more of the same, and that the Blue Jays would keep running him out there even though they had better options available. I needn’t have worried.
“I feel great, actually,” Springer told MLB.com’s Keegan Matheson while he was putting up those abysmal spring training numbers. “For me, it’s about the process. It’s not about the results. I want to make sure that I’m swinging at the right pitches and getting my swing off. Yeah, obviously everyone would like to see the ball hit the grass, but for me specifically, I’m working on the mechanical side of it.” Then the season started, and Springer went out and backed those words up. He’s having a renaissance. A couple months shy of his 36th birthday, he already has 1.8 WAR, and his 143 wRC+ is the best mark he’s put up since he was a fresh-faced 30-year-old Astro in 2020. He’s on pace for his highest home run total since 2019, and he’s running a career-best 12.4% walk rate. So Springer is walking more and hitting for more power, and because of a .303 BABIP, his best since 2016, he’s also running his best batting average in years. How is he doing all this? Read the rest of this entry »
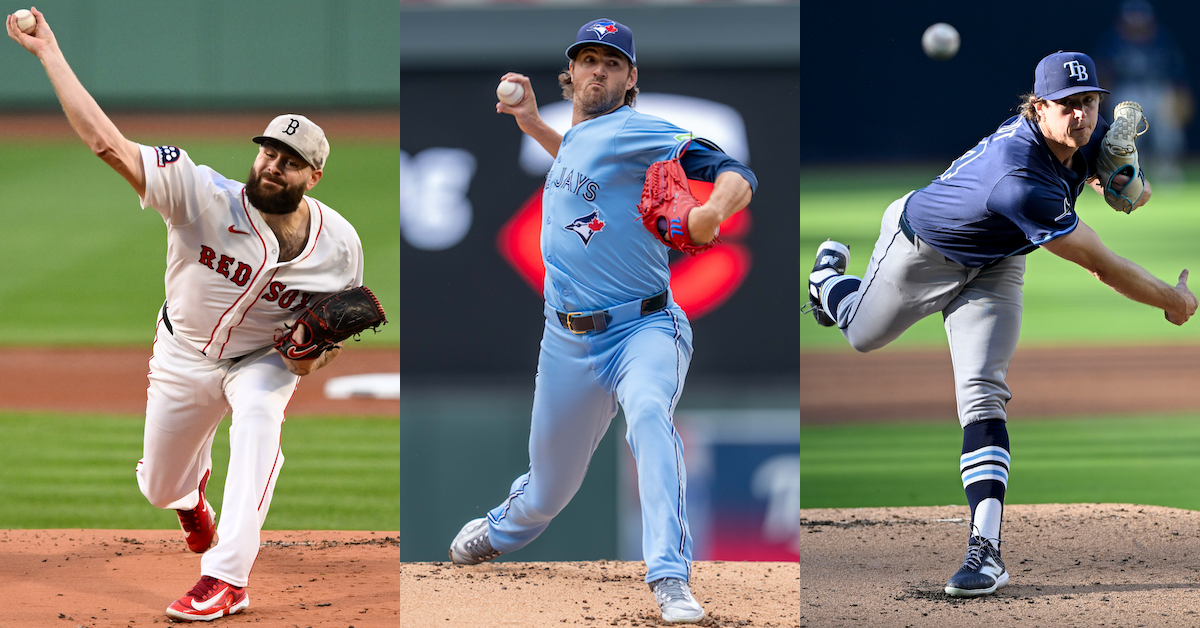
Brian Fluharty, Matt Blewett, Denis Poroy-Imagn Images
Starting pitchers prepare for games in three-stage fashion. A few days after taking the mound, they throw a bullpen session under the watchful eye of the pitching coach, typically with a Trackman recording each throw. At the start of every series, there is a pitchers’ meeting with all arms present, as well as the catchers and pitching coaches. On the day of a start, the pitcher will go over that day’s game plan with the catchers and coaches.
And then there are the talks pitchers have among themselves. While informal, they can likewise play a meaningful role in preparedness. Every time a hurler takes the hill, he brings with him knowledge gleaned from his peers. That was a big part of what I was interested in when I approached three starters — Lucas Giolito, Kevin Gausman, and Ryan Pepiot — to learn how they get ready for an outing from an information perspective.
Here are excerpts from my conversations with the pitchers:
———
PRE-SERIES AND PRE-START MEETINGS
Giolito: “You go over a lot of things in the pre-series meeting. You go over guys who like to run — stealing bases and things like that — and you obviously go over the hitters. Considering that you have a bunch of dudes in the room that have wildly different stuff and attack plans, that’s more surface level. You’re not going down the line and saying, ‘This is how we’re going to attack this guy,’ because we’re all different. That’s for when you have your pre-start meeting.
“In the pre-start meeting — that’s with the coaching staff and the catchers — we go over each hitter, talking about strengths, weaknesses, and attack plans. The attack plans are based on the individual pitcher’s stuff.” Read the rest of this entry »
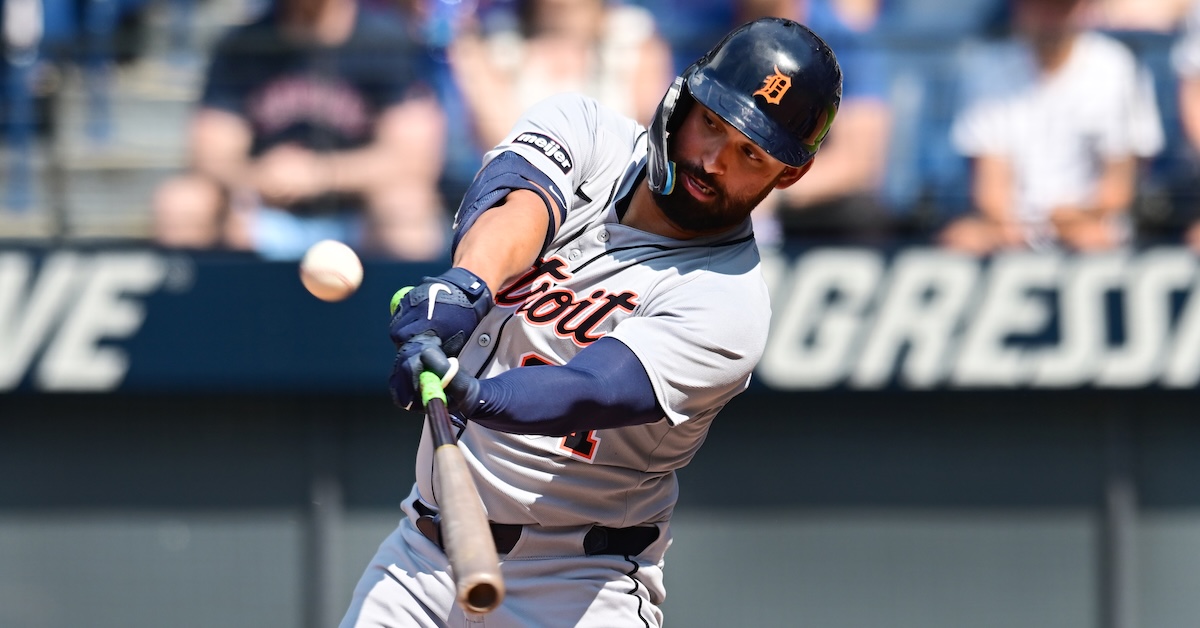
On last Monday’s episode of the Rates and Barrelspodcast, Derek VanRiper raised a curious contradiction. “[Riley Greene is] first percentile in squared-up percentage, but 97th percentile in barrel rate, which — I’m sure there’s an explanation, I don’t know what it is just yet.” In response, Eno Sarris asked, “How can he barrel it without squaring it up?” It was a great question. In colloquial use, a squared-up ball is synonymous with a barreled ball. So what’s going on here, exactly?
The first thing to know: A squared-up ball is not necessarily a well-hit ball, as Davy Andrews highlighted when these stats were first made public last June. To understand why, one must first become acquainted with the Statcast definition of squared up. The MLB glossary entry for squared-up rate defines it thusly: “A swing’s squared-up rate tells us how much of the highest possible exit velocity available (based on the physics related to the swing speed and pitch speed) a batter was able to obtain – it is, at its simplest, how much exit velocity did you get as a share of how much exit velocity was possible based on your swing speed and the speed of the pitch.” If a hitter generates 80% of their possible exit velocity on a given swing and the ball is put in play, the batted ball is considered squared up.
We might quibble over the simplicity of that definition. In any case, as Davy showed, squared-up balls can be hit at super low speeds — if all it means is that a hitter channelled 80% of the potential exit velocity, then 80% of a half-swing is not very much exit velocity.
It’s also possible to do damage without making frequent flush contact; Greene shows us how. As Ben Clemens wrote just a couple of weeks ago, Greene is posting yet another excellent offensive campaign despite one of the higher strikeout rates among qualified hitters. He’s doing it unconventionally, swinging a ton in early counts to maximize damage. He’s also unconventional in another sense: He barrels the ball a ton while hardly ever squaring it up.
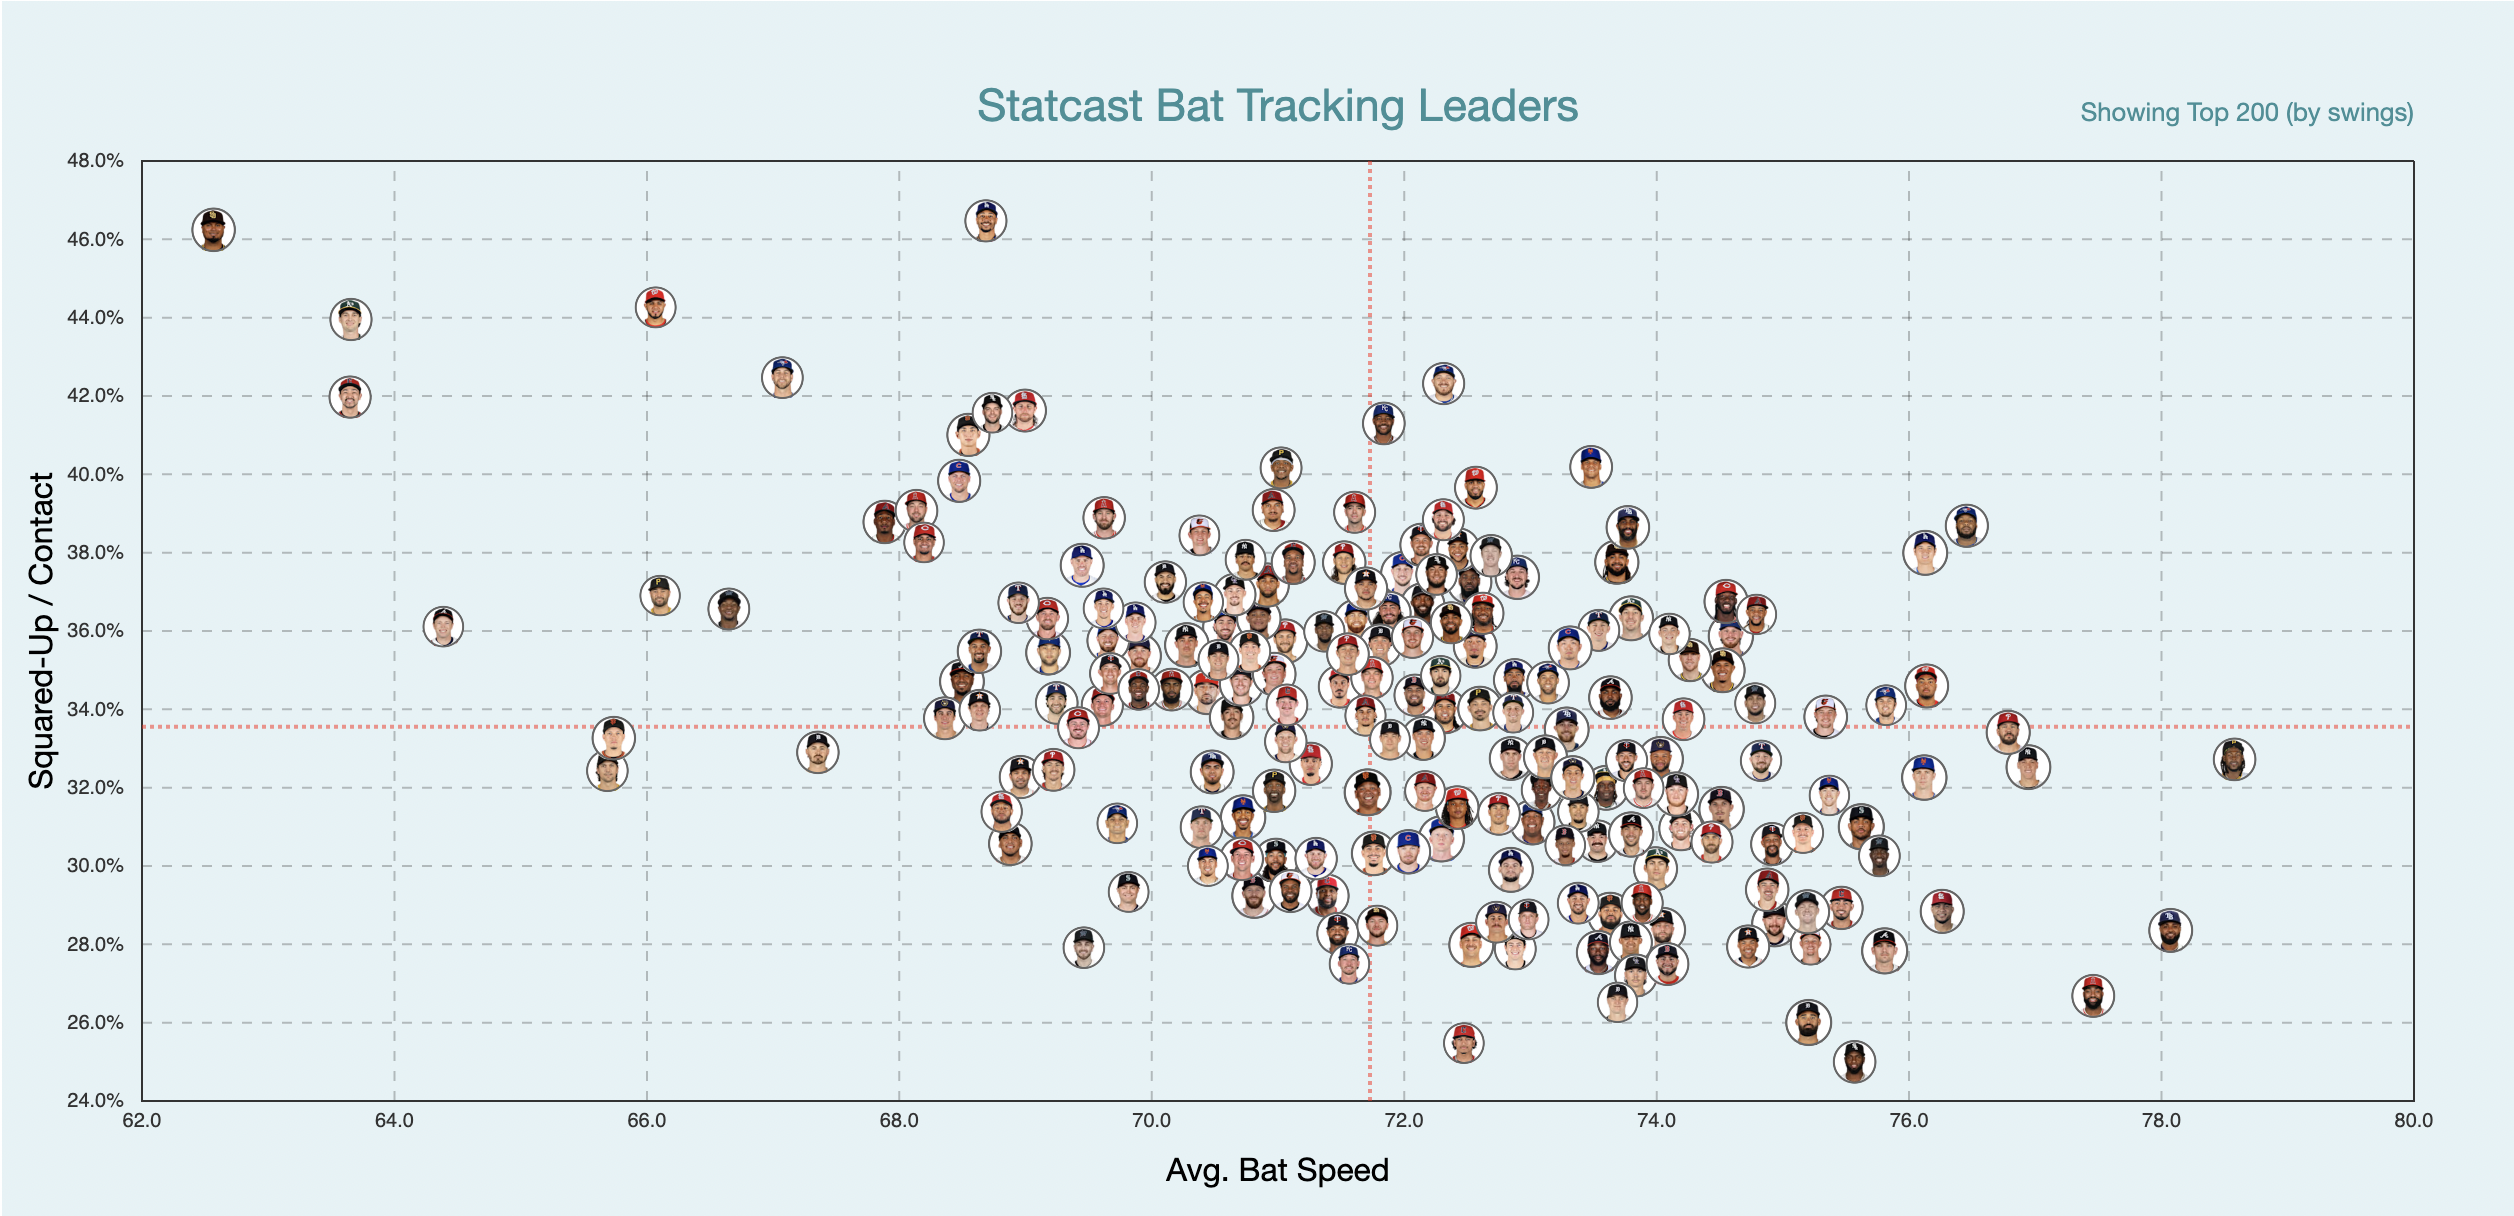
Part of the explanation for how this works is tied to the nature of swinging hard. When the bat speed statistics first dropped, it immediately became clear that there is a strong negative relationship between bat speed and the ability to square the ball up, at least by the Statcast definition. Click over to the bat tracking leaderboard, and the first thing you’ll see is this image, which shows the negative correlation between these two variables:
That’s no surprise. By the Statcast definition of a squared-up ball, slow swingers will always come out on top, because swinging slower allows for greater barrel accuracy. But it’s not all bad news for hard swingers. They also tend to produce the most valuable type of batted ball: a barrel.
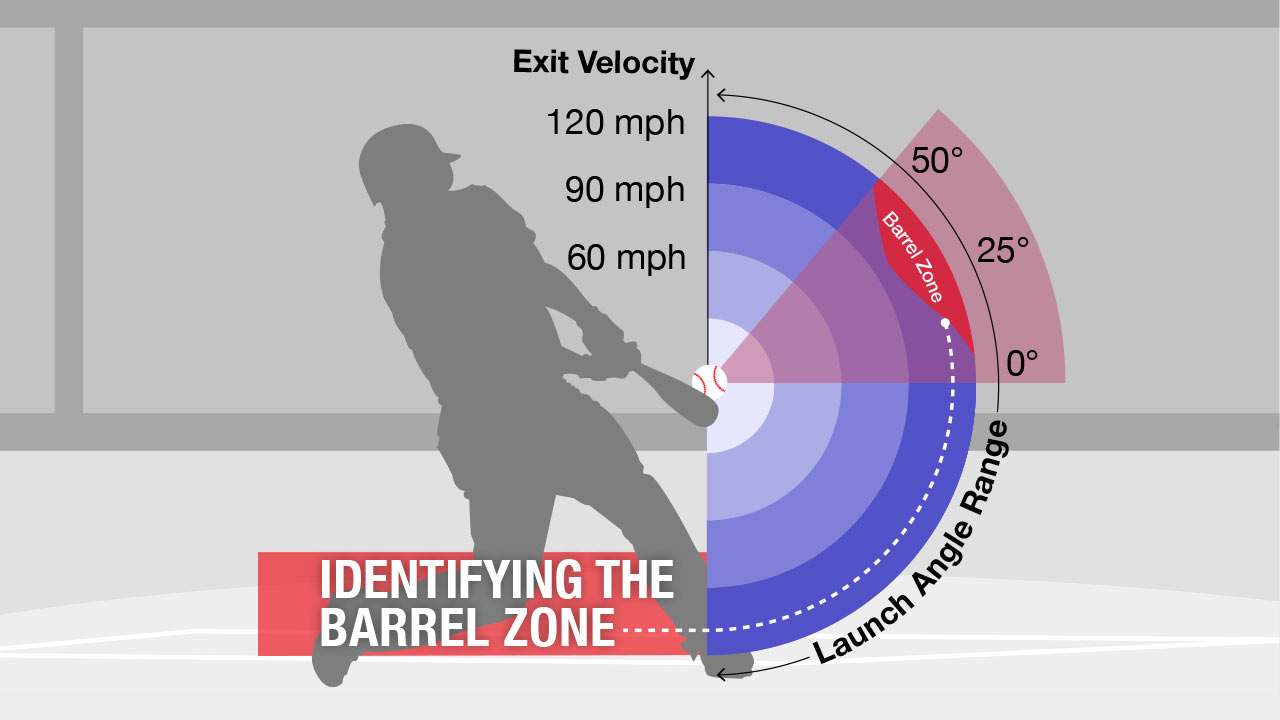
Naturally, bat speed is correlated — positively — with barrel rate. A barrel, by the Statcast definition, is any type of batted ball where the expected batting average is at least .500 and the expected slugging percentage is at least 1.500. Barrels tend to be clustered in a pretty narrow exit velocity/launch angle range, somewhere north of 100 mph in terms of exit velocity and between 15 and 40 degrees or so of launch angle:
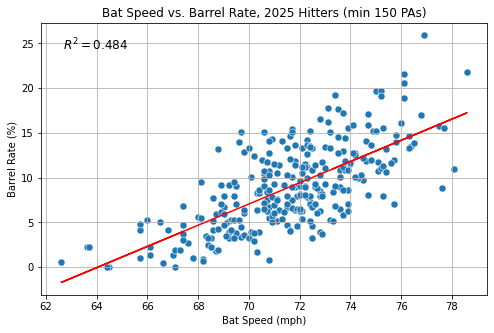
As the scatterplot below shows, the relationship between bat speed and barrel rate is extremely tight:
Greene’s average bat speed — 75.2 mph — is in the 91st percentile, so on some level, a high barrel rate and a low squared-up rate is to be expected. Even so, the spread between these two metrics is striking. His barrel rate is higher than his squared-up rate! Only one other hitter has a lower squared-up-minus-barrel rate — Aaron Judge. And that gives a hint into how, exactly, Greene is pulling this off.
Judge racks up an obscene number of barrels. Already, he’s mashed 60 this year, good for a 25.9% barrel rate. Like Greene, his squared-up rate is low — not as low, but comfortably a standard deviation below the mean. But also like Greene, Judge is amazing at converting his squared-up balls into barrels.
Nobody comes particularly close to Judge in this metric. Nearly 40% of his squared-up balls are converted into barrels, by far the highest rate in the league. (The league average is 13.6%.) As you might have guessed, Greene also excels here, ranking fifth among all hitters with at least 150 plate appearances:
So that’s the first part of this equation. Greene might not square the ball up that often, but when he does, it’s frequently crushed. The other part of the equation? Greene hits a ton of foul balls.
Greene’s 315 foul balls rank fifth among all hitters. When Greene makes contact with the ball, it goes foul 56% of the time. That mark ranks 11th out of all hitters with at least 150 plate appearances; besides Cal Raleigh, nobody else in Greene’s squared-up-to-barrel cohort fouls off nearly as many balls:
Minimum 150 plate appearances. Foul balls divided by pitches that end with contact.
All of those foul balls — in addition to his seventh percentile whiff rate — contribute to the squared-up percentage denominator, sinking Greene’s squared-up rate to the very bottom of qualified hitters. Importantly, foul balls are not part of the barrel rate denominator. The barrel rate that shows up on the Savant player page popsicles is a measure of barrels per batted ball event. A bunch of foul balls do nothing to affect a hitter’s barrel rate, but they’ll go a long way toward tanking a squared-up rate.
It isn’t necessarily intuitive to think that a hitter could be so good at barreling the ball and so bad at squaring it up. But breaking it down in this fashion, I think it starts to clarify this ostensible conundrum. Barrels are hard to come by. Even Judge, the barrel GOAT, hits one just over a quarter of the time he puts a ball in play. To be a barrel king like Judge or Greene, you don’t need to crush that many baseballs, at least on an absolute basis. But you better make sure that when the ball is in play, it gets smushed.
More than anything, I think these two data points paint a compelling picture of the modern hitter. Greene, perhaps more than any other hitter, goes for broke, almost like the anti-Luis Arraez. His swing tilt is the steepest in the sport. He mishits a bunch of pitches. He whiffs a ton. But when he connects, he does damage. And even though those damage events are relatively infrequent, they’re valuable enough to make him one of the better hitters in baseball.
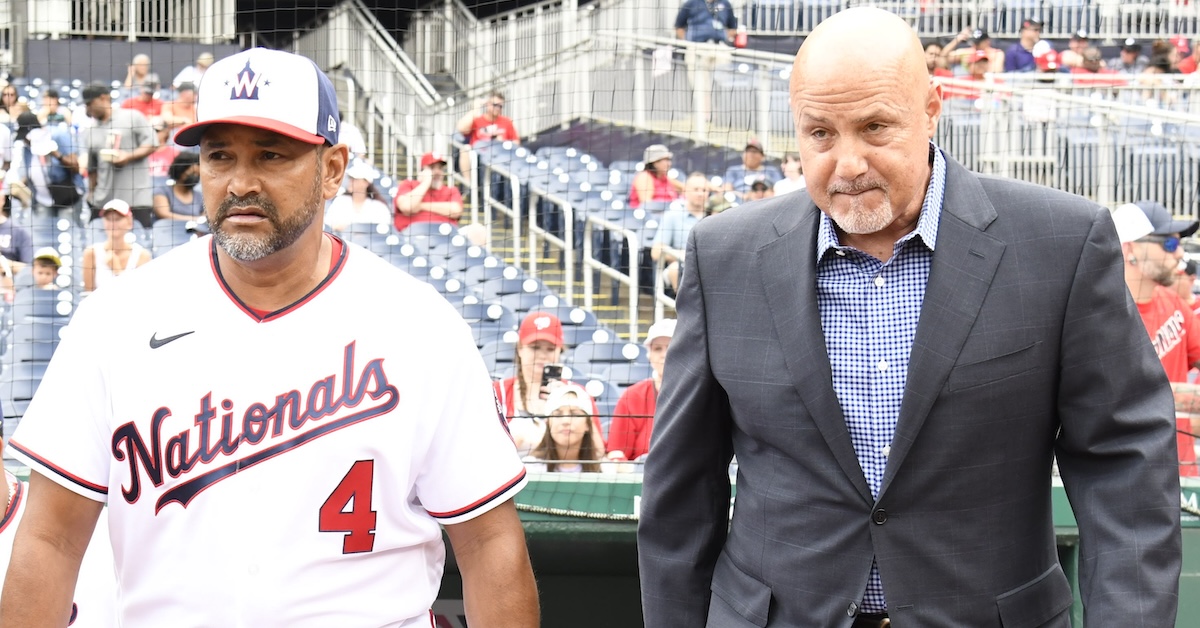
Last night, exactly one week before they’re slated to make the first overall pick in the 2025 draft, the Nationals fired president of baseball operations Mike Rizzo and manager Dave Martinez. After ESPN’s Jeff Passan broke the news, the team announced assistant general manager Mike DeBartolo will serve as interim GM. Bench coach Miguel Cairo was named interim manager this afternoon.
Rumors that Rizzo and Martinez might finally be on the hot seat had made the rounds over the past several weeks, but the timing is less than ideal. According to Ken Rosenthal of The Athletic, the last time a team fired its GM before the trade deadline was when the Twins got rid of Terry Ryan on July 18, 2016. USA Today’s Bob Nightengale provided an explanation, reporting that both Rizzo and Martinez had contract options for 2026, with mid-July deadlines for those decisions. Even for a franchise that just fired its POBO and manager, it’s a bad look to let money dictate the timing of the decision when so much is at stake. Read the rest of this entry »
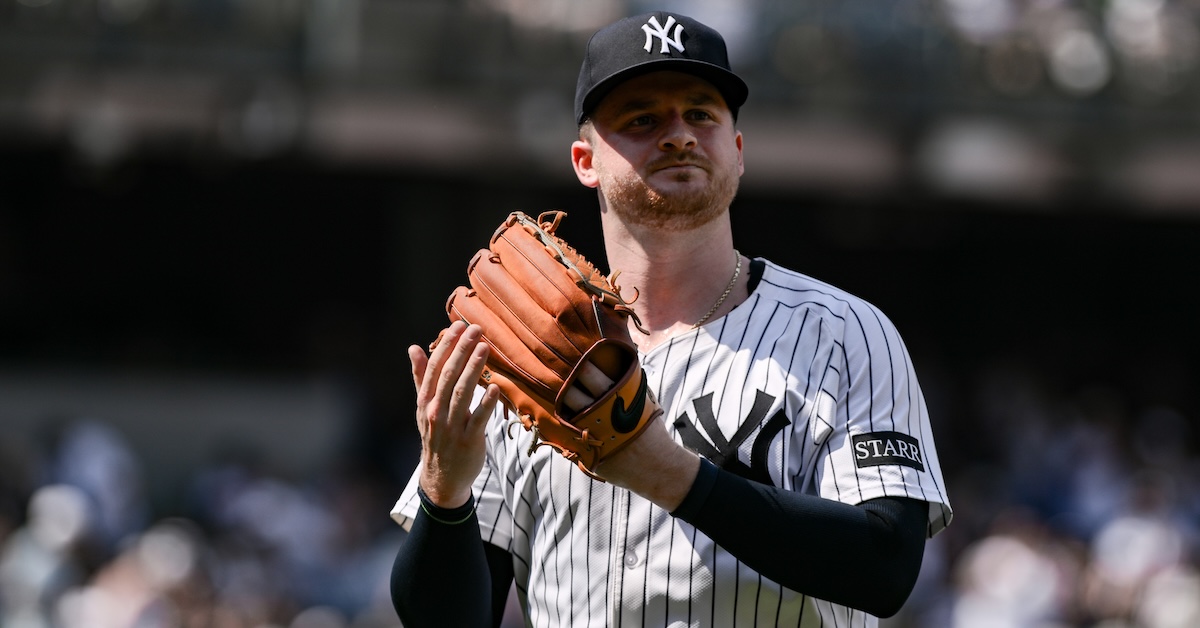
There’s never a good time to lose a starting pitcher, but doing so when you’ve lost six of your last seven games and have relinquished first place in your division is an especially unwelcome happenstance. This is what the New York Yankees are currently experiencing, as Clarke Schmidt, who was placed on the injured list due to forearm tightness after an early exit from his Thursday start, will likely undergo Tommy John surgery. With a 3.32 ERA, 3.90 FIP, and 1.2 WAR in 14 starts, Schmidt appeared to be headed towards his best season in the majors, but short of a miracle, he’ll now be out until well into the 2026 season at least. Coming just as the offense appeared to be recovering from its June swoon, the Yankees’ trade deadline to-do list may have just gotten a bit longer.
Six weeks ago, the Yankees were in a strong, though not insurmountable, position at the top of the AL East. No fan should start making travel plans based on a seven-game divisional lead in late May, but it’s about as strong a position as a team can hope to have in a good division. In his May 28 start, Schmidt threw six shutout innings en route to a 1-0 victory over the Angels, giving the Yankees that a seven-game lead (their seasonal high-water mark) and a 35-20 overall record. Since then, the Yankees have gone 14-21, losing 11 games in the standings relative to the current first-place team, the Blue Jays.
The disappearance of the offense was a big part of the Yankees’ slump, at least until the last week or so. On the whole, the offense dropped to a .718 OPS in June after posting an .812 OPS through the end of May, a mark that was second only to the Dodgers. Half of the team’s plate appearances in June were made by players with a wRC+ under 90 for the month, including key early-season performers Paul Goldschmidt and Ben Rice, as well as a returning Giancarlo Stanton. The pitching remained solid despite the team’s 13-14 month, with the rotation combining for a 3.19 ERA and a slightly less exciting 3.79 FIP. Read the rest of this entry »
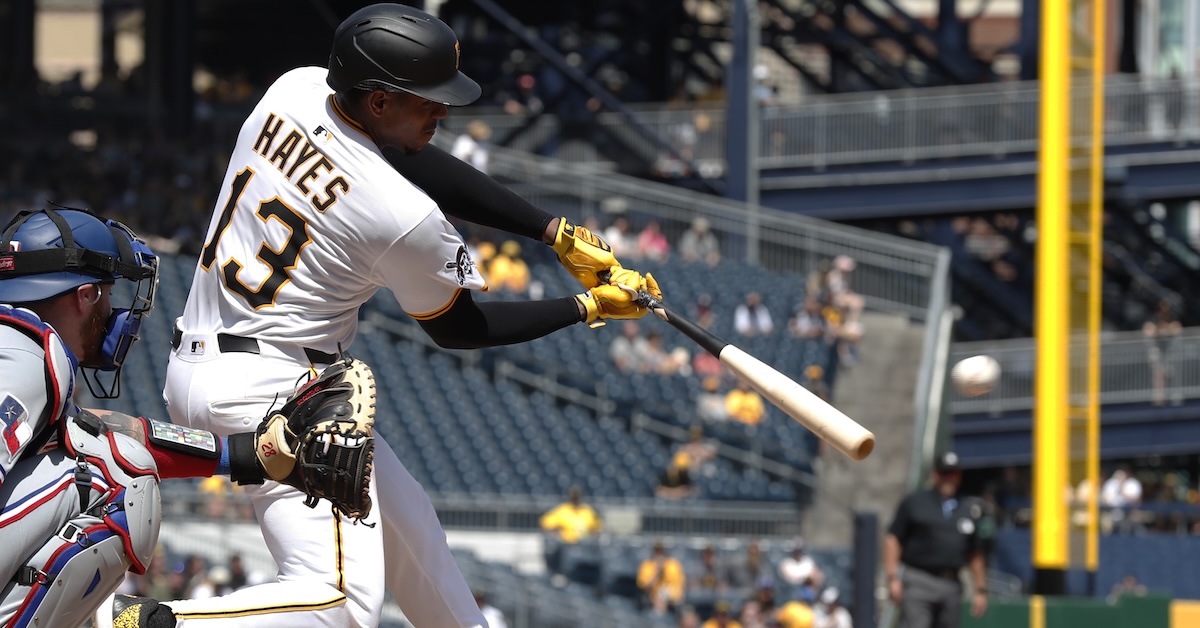
Since 2021, Ke’Bryan Hayes is the leader in OAA among all infielders. As one of the best defenders in the sport, his floor is very high. Even with his career 87 wRC+, he has still been worth about 3 WAR per 162 games. If he could be a consistently average offensive player, he’d be one of the most valuable players at his position. This is a story we all know. With his name swirling in trade rumors, you have to imagine other teams are thinking about the possibility more so now than in the past. His issues stem from his suboptimal swing path, and if he’s traded, that will be what his new hitting coach tries to fix.
In the last calendar year (459 plate appearances), Hayes has a 60 wRC+. That is bad! But despite those struggles, it’s not like he is completely lacking offensive ability. His bat speed is only a little below average. His strikeout and whiff rates are better than league average over the past three seasons. He hits the ball hard more often than not, and he chases at about an average rate. Those are all things you could work with if you’re trying to manufacture a league average hitter. But if you’re doing all this and your path is rarely working in an ideal direction, you’ll always have limitations on what you do when you actually make contact. Read the rest of this entry »