The wave of early season injuries has hit, and plenty of contenders are attempting to navigate through the first month of the season without some big name stars and key contributors.
Last year, we revamped our power rankings using a modified Elo rating system. If you’re familiar with chess rankings or FiveThirtyEight’s defunct sports section, you’ll know that Elo is an elegant solution that measures teams’ relative strength and is very reactive to recent performance. To avoid overweighting recent results during the season, we weigh each team’s raw Elo rank using our coin flip playoff odds (specifically, we regress the playoff odds by 50% and weigh those against the raw Elo ranking, increasing in weight as the season progresses to a maximum of 25%). The weighted Elo ranks are then displayed as “Power Score” in the tables below. As the best and worst teams sort themselves out throughout the season, they’ll filter to the top and bottom of the rankings, while the exercise will remain reactive to hot streaks or cold snaps.
First up are the full rankings, presented in a sortable table. Below that, I’ve grouped the teams into tiers with comments on a handful of clubs. You’ll notice that the official ordinal rankings don’t always match the tiers — there are times where I take editorial liberties when grouping teams together — but generally, the ordering is consistent. One thing to note: The playoff odds listed in the tables below are our standard Depth Charts odds, not the coin flip odds that are used in the ranking formula.
Complete Power Rankings
| Rank |
Team |
Record |
Elo |
Opponent Elo |
Playoff Odds |
Power Score |
Δ |
| 1 |
Dodgers |
11-6 |
1600 |
1519 |
96.1% |
1598 |
0 |
| 2 |
Padres |
13-3 |
1563 |
1488 |
57.5% |
1563 |
2 |
| 3 |
Cubs |
11-7 |
1557 |
1547 |
59.9% |
1555 |
6 |
| 4 |
Mets |
10-5 |
1550 |
1478 |
72.3% |
1549 |
2 |
| 5 |
Giants |
11-4 |
1543 |
1501 |
52.4% |
1543 |
0 |
| 6 |
Phillies |
9-6 |
1544 |
1493 |
72.2% |
1543 |
-4 |
| 7 |
Diamondbacks |
9-7 |
1534 |
1498 |
55.8% |
1532 |
3 |
| 8 |
Tigers |
9-6 |
1529 |
1501 |
67.8% |
1529 |
4 |
| 9 |
Rangers |
9-7 |
1527 |
1511 |
54.0% |
1527 |
-6 |
| 10 |
Yankees |
8-7 |
1527 |
1510 |
67.8% |
1526 |
-3 |
| 11 |
Mariners |
8-8 |
1523 |
1510 |
58.1% |
1521 |
8 |
| 12 |
Blue Jays |
9-7 |
1520 |
1504 |
45.7% |
1520 |
2 |
| 13 |
Braves |
4-11 |
1522 |
1533 |
66.2% |
1517 |
-2 |
| 14 |
Astros |
7-8 |
1509 |
1504 |
50.7% |
1507 |
-1 |
| 15 |
Red Sox |
8-9 |
1504 |
1487 |
51.3% |
1503 |
-7 |
| 16 |
Royals |
8-8 |
1502 |
1488 |
40.0% |
1501 |
0 |
| 17 |
Brewers |
8-8 |
1495 |
1479 |
28.7% |
1493 |
-2 |
| 18 |
Reds |
8-8 |
1493 |
1505 |
12.1% |
1492 |
6 |
| 19 |
Rays |
7-8 |
1491 |
1483 |
35.9% |
1490 |
1 |
| 20 |
Guardians |
8-7 |
1490 |
1477 |
29.1% |
1490 |
3 |
| 21 |
Orioles |
6-9 |
1491 |
1507 |
35.6% |
1490 |
-4 |
| 22 |
Angels |
9-6 |
1487 |
1471 |
15.5% |
1487 |
-1 |
| 23 |
Cardinals |
7-8 |
1485 |
1505 |
17.7% |
1483 |
-1 |
| 24 |
Twins |
5-11 |
1473 |
1486 |
34.9% |
1470 |
-6 |
| 25 |
Marlins |
8-7 |
1459 |
1505 |
1.2% |
1458 |
2 |
| 26 |
Athletics |
6-10 |
1454 |
1502 |
13.6% |
1453 |
0 |
| 27 |
Nationals |
6-9 |
1450 |
1533 |
1.2% |
1449 |
1 |
| 28 |
Pirates |
5-11 |
1446 |
1487 |
6.6% |
1444 |
-3 |
| 29 |
White Sox |
4-11 |
1367 |
1489 |
0.0% |
1367 |
1 |
| 30 |
Rockies |
3-12 |
1366 |
1514 |
0.0% |
1365 |
-1 |
…
Tier 1 – The Dodgers
| Team |
Record |
Elo |
Opponent Elo |
Playoff Odds |
Power Score |
| Dodgers |
11-6 |
1600 |
1519 |
96.1% |
1598 |
After starting off the season with seven straight wins, the Dodgers have dropped three straight series; they went 2-4 against the Nationals and Cubs last week. If you’re looking for positives, Freddie Freeman was activated off the IL on Friday, and Roki Sasaki made his best start of his young major league career against red hot Chicago on Saturday — even if the game ended in a 16-0 blowout. Miguel Rojas entertained us with impressions of the Dodgers pitching staff during that lopsided affair, though I’m sure Dodger fans would rather he never pitch again this season.
Tier 2 – On the Cusp of Greatness
| Team |
Record |
Elo |
Opponent Elo |
Playoff Odds |
Power Score |
| Padres |
13-3 |
1563 |
1488 |
57.5% |
1563 |
| Cubs |
11-7 |
1557 |
1547 |
59.9% |
1555 |
| Mets |
10-5 |
1550 |
1478 |
72.3% |
1549 |
| Giants |
11-4 |
1543 |
1501 |
52.4% |
1543 |
| Phillies |
9-6 |
1544 |
1493 |
72.2% |
1543 |
Following their series win over the Athletics and sweep of the Rockies, the Padres currently own the best record in baseball. It’s been their pitching staff that’s led the way; they didn’t allow a single run over the weekend and already have six shutouts this season. With Jackson Merrill and Jake Cronenworth on the IL for a bit, the Friars will need to continue to lean on their arms to carry the load.
The Cubs have had one of the tougher schedules to start the season, and not just because they began early in Japan. By the end of the month, they’ll have completed their season series against the Dodgers, Diamondbacks, and Padres while also squeezing in series against the Rangers and Phillies. That makes their 11-7 record partway through this gauntlet all the more impressive. Kyle Tucker has been absolutely crushing the ball as he leads baseball’s best offense so far. The 16-0 blowout on Saturday definitely helped, but Chicago is the only ballclub that has scored more than 100 runs this season.
Speaking of hot starts, Pete Alonso has been about as potent as Tucker, with a 202 wRC+ that’s one point below that of the Cubs right fielder. The Polar Bear’s hot start has helped the Mets take an early lead in the NL East division race. Both Jeff McNeil and Francisco Alvarez are nearing a return from their spring injuries, which should further bolster the lineup. More impressive has been the stability of the starting rotation. That group looked rather thin when the season opened, after a slew of spring injuries forced New York to dig deep into its depth, but guys like Tylor Megill and Griffin Canning have been solid so far.
Tier 3 – Solid Contenders
| Team |
Record |
Elo |
Opponent Elo |
Playoff Odds |
Power Score |
| Diamondbacks |
9-7 |
1534 |
1498 |
55.8% |
1532 |
| Tigers |
9-6 |
1529 |
1501 |
67.8% |
1529 |
| Rangers |
9-7 |
1527 |
1511 |
54.0% |
1527 |
| Yankees |
8-7 |
1527 |
1510 |
67.8% |
1526 |
The Diamondbacks followed up their dramatic ninth-inning victory on Saturday with another come-from-behind win on Sunday. They’re still only in fourth in their division, but their 9-7 record isn’t all that bad. Corbin Carroll is leading the second-best offense in the NL, a lineup that is making do without the injured Ketel Marte.
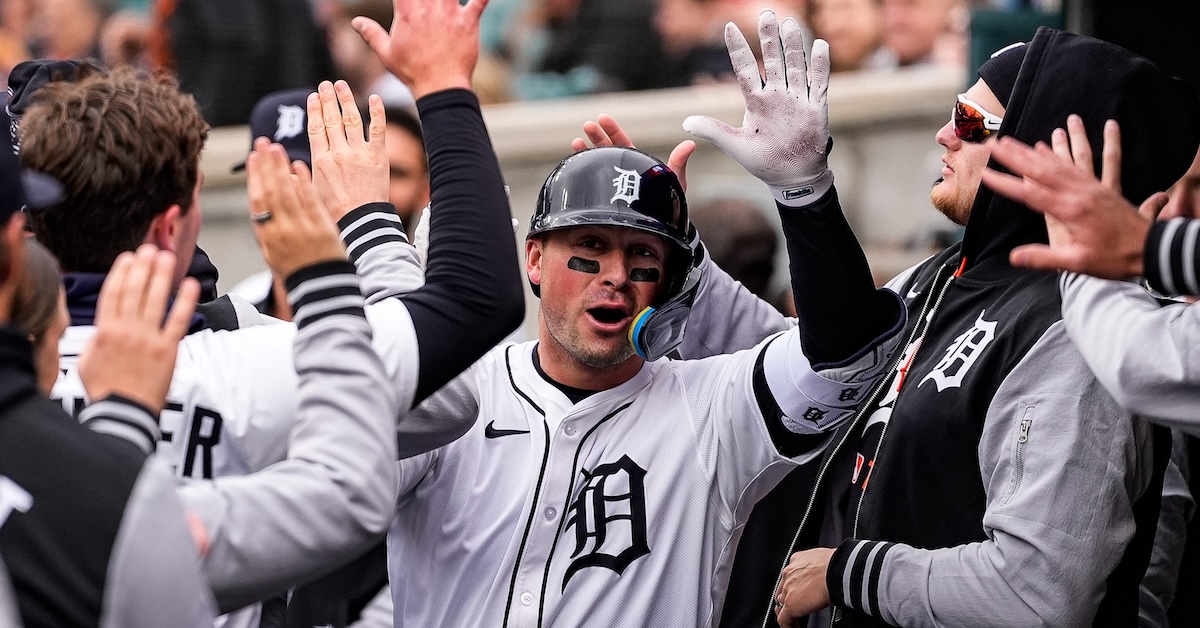
The 2025 Tigers are a good reminder that prospect development isn’t always linear. Their best hitter over these first few weeks of the season has been Spencer Torkelson; he blasted his fifth home run of the year on Sunday, pushing his wRC+ up to 206. On the mound, Casey Mize has looked excellent, though he was roughed up a bit in Sunday’s start. After spending a few years struggling to establish themselves in the big leagues, these guys finally look like key contributors on Detroit’s roster.
Tier 4 – Hot and Cold
| Team |
Record |
Elo |
Opponent Elo |
Playoff Odds |
Power Score |
| Mariners |
8-8 |
1523 |
1510 |
58.1% |
1521 |
| Blue Jays |
9-7 |
1520 |
1504 |
45.7% |
1520 |
| Braves |
4-11 |
1522 |
1533 |
66.2% |
1517 |
The Mariners may have just turned around their season with a 5-1 week against the Astros and Rangers. On the one hand, the one loss was a 2-1 extra-innings affair against Houston in which they went 1-for-19 with runners in scoring position. On the other, three of those wins came after scoring the winning run in the eighth inning or later. Seattle hasn’t sorted out all of its offensive woes, but the lineup has done just enough to support its excellent pitching staff.
After winning three of four against the Red Sox and splitting a rain-shortened series against the Orioles last week, the Blue Jays find themselves the surprise leaders in the AL East. Bo Bichette and George Springer have bounced back nicely after their down seasons last year, and Vladimir Guerrero Jr. has been solid since signing his massive extension a week ago, though he still hasn’t homered yet this season. If anything, the ups and downs in their division should remind us that the American League is wide open for the taking.
Tier 5 – The Melee
| Team |
Record |
Elo |
Opponent Elo |
Playoff Odds |
Power Score |
| Astros |
7-8 |
1509 |
1504 |
50.7% |
1507 |
| Red Sox |
8-9 |
1504 |
1487 |
51.3% |
1503 |
| Royals |
8-8 |
1502 |
1488 |
40.0% |
1501 |
| Brewers |
8-8 |
1495 |
1479 |
28.7% |
1493 |
| Reds |
8-8 |
1493 |
1505 |
12.1% |
1492 |
| Rays |
7-8 |
1491 |
1483 |
35.9% |
1490 |
| Guardians |
8-7 |
1490 |
1477 |
29.1% |
1490 |
| Orioles |
6-9 |
1491 |
1507 |
35.6% |
1490 |
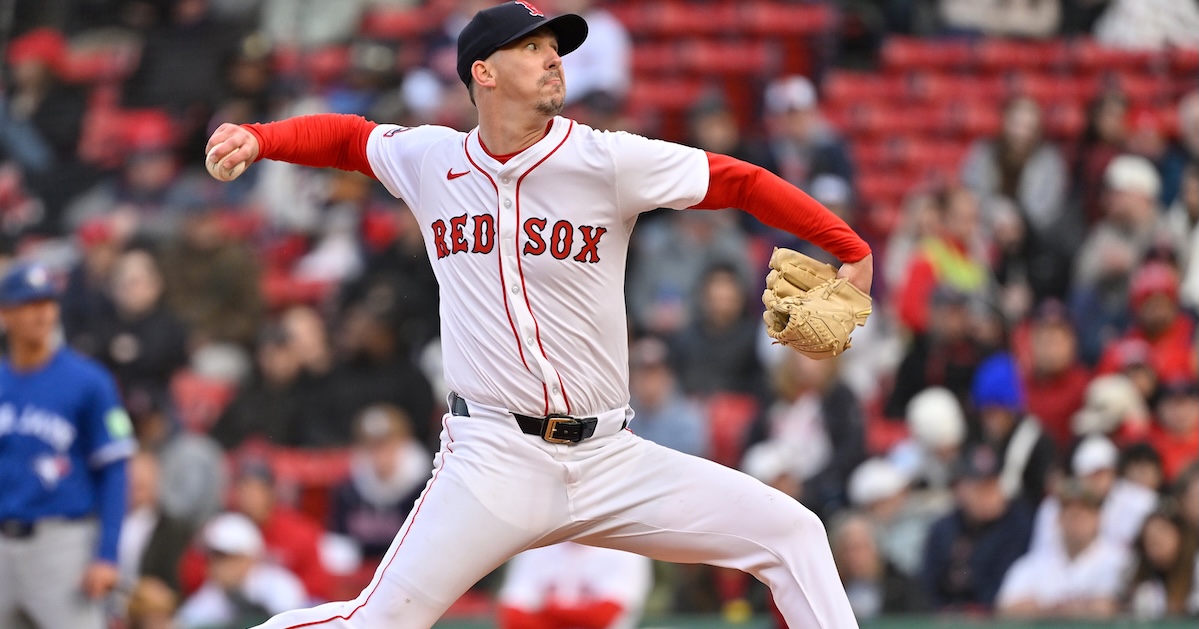
Speaking of the AL East, the Red Sox dropped an ugly series to the White Sox over the weekend; they made five errors in Friday’s 11-1 blowout and then lost in the ninth inning on Saturday. Garrett Crochet’s no-hit bid on Sunday was the only bright spot for Boston. Meanwhile, the Orioles have scuffled to start the season, and their already thin starting rotation grew thinner with Zach Eflin hitting the IL last week.
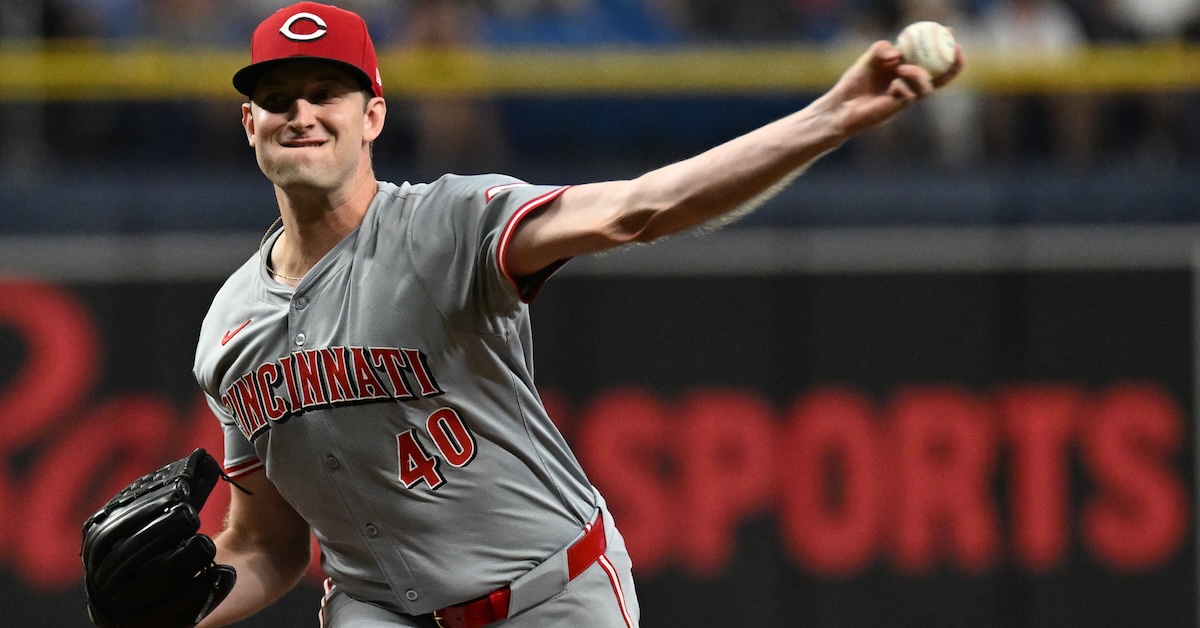
In last week’s power rankings, I called out the Reds and their offensive woes. Fast forward a week, and Cincinnati suddenly looks like it’s in a much better position thanks to some phenomenal pitching. The Reds cooled off the Giants with a series win in San Francisco and then swept the Pirates over the weekend. Hunter Greene contributed two scoreless starts during the week, and Brady Singer has looked dominant after joining the team in an offseason trade. Shockingly, the Reds are tied with the Mets for the major league lead in pitcher WAR and are second in park- and league-adjusted ERA and FIP.
Tier 6 – No Man’s Land
| Team |
Record |
Elo |
Opponent Elo |
Playoff Odds |
Power Score |
| Angels |
9-6 |
1487 |
1471 |
15.5% |
1487 |
| Cardinals |
7-8 |
1485 |
1505 |
17.7% |
1483 |
| Twins |
5-11 |
1473 |
1486 |
34.9% |
1470 |
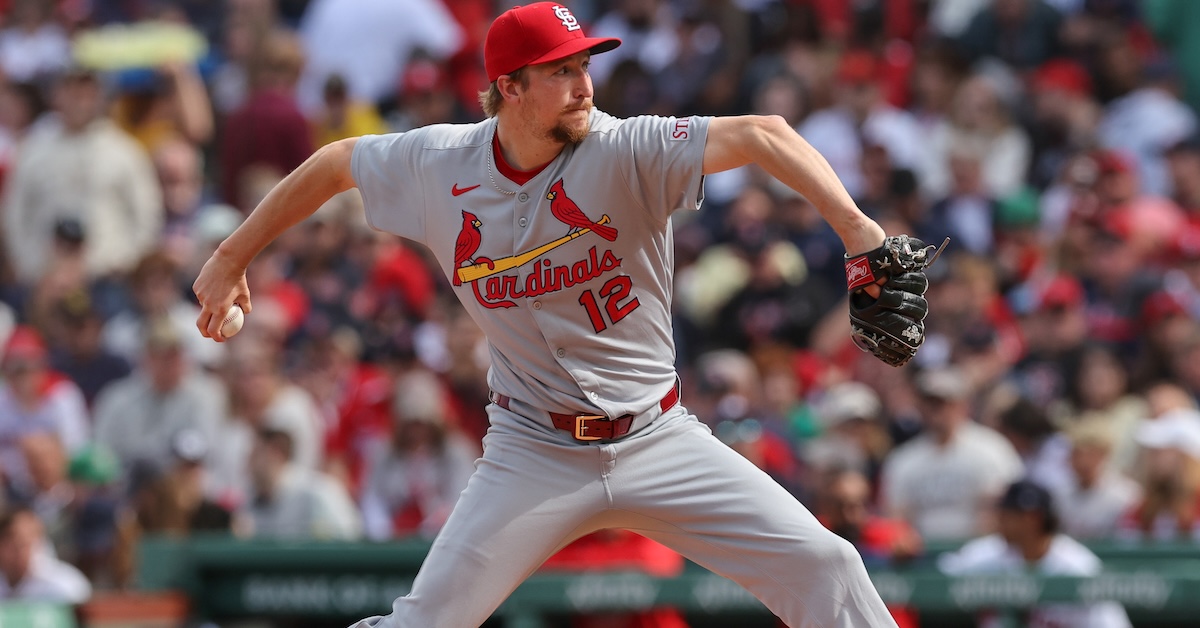
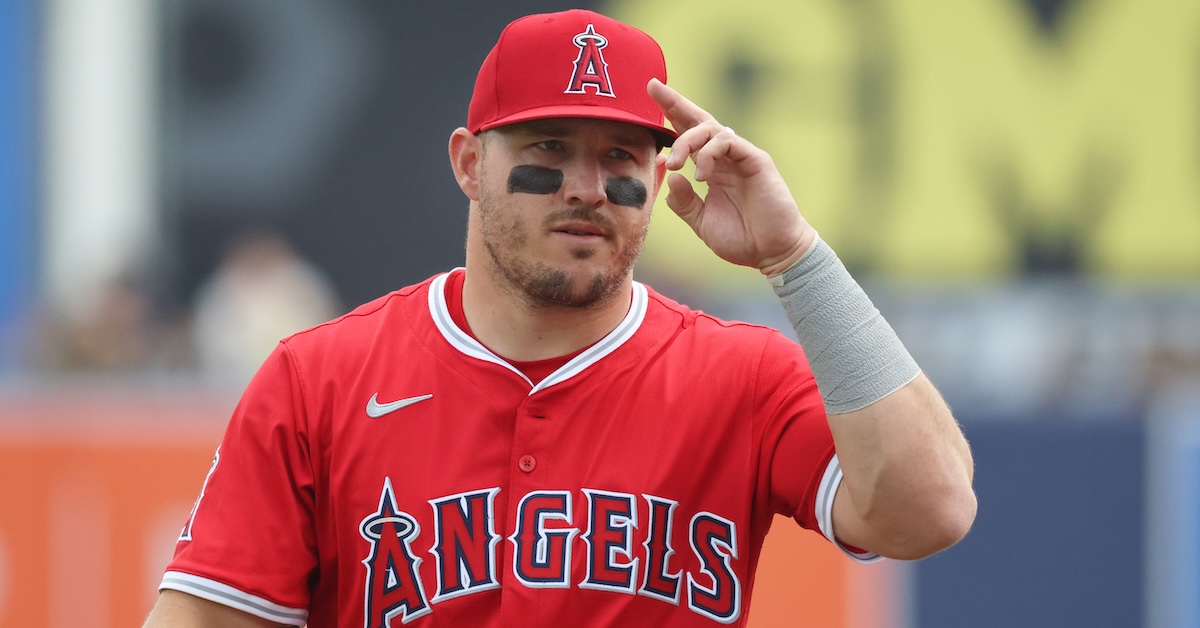
There have been plenty of surprising hot starts in the NL, but the Angels hold that honor in the AL. They lost their first series of the season last weekend but are still tied with the Tigers for the best record in the AL. Mike Trout is healthy and blasting home runs — already six on the year — but the biggest surprise has been the emergence of Kyren Paris; he’s running a 266 wRC+ with five dingers.
The Twins’ bad start got even worse last week after they lost their series against the Royals and the Tigers. They showed some signs of life on Sunday in a fairly complete win over Detroit to salvage a single win in that three-game set, but that only pushed their record to 5-11. To make matters worse, Minnesota placed ace Pablo López on the IL with a hamstring injury on Wednesday. Thankfully, the Twins have enough starting pitching depth to weather his absence for a short period. More concerning are the slow starts from Carlos Correa and Byron Buxton, the two guys who are supposed to be driving the offense. A home run and a double from Buxton on Sunday pushed his season wRC+ up to 94, but Correa’s mark is still all the way down at 44.
Tier 7 – Laying the Foundation
| Team |
Record |
Elo |
Opponent Elo |
Playoff Odds |
Power Score |
| Marlins |
8-7 |
1459 |
1505 |
1.2% |
1458 |
| Athletics |
6-10 |
1454 |
1502 |
13.6% |
1453 |
| Nationals |
6-9 |
1450 |
1533 |
1.2% |
1449 |
| Pirates |
5-11 |
1446 |
1487 |
6.6% |
1444 |
It’s pretty clear already that Sutter Health Park in Sacramento is an offensive haven. Baseball Savant gives the Athletics’ new ballpark a 116 park factor in the early going. That means that 12 of the team’s 16 games have been played in extremely hitter-friendly environments — including a three-game series in Colorado between homestands — which possibly explains why its pitching staff has allowed 89 runs this season, the most in the majors. The A’s offense hasn’t yet benefited from the friendly confines of their new home, though Tyler Soderstrom is off to a hot start and Jacob Wilson has quickly established himself as a favorite for the AL Rookie of the Year award.
Tier 8 – Hope Deferred
| Team |
Record |
Elo |
Opponent Elo |
Playoff Odds |
Power Score |
| White Sox |
4-11 |
1367 |
1489 |
0.0% |
1367 |
| Rockies |
3-12 |
1366 |
1514 |
0.0% |
1365 |
The White Sox have climbed out of the cellar and leaped ahead of the Rockies in these rankings thanks to a pair of wins against the Red Sox over the weekend. If you’re looking for a glimmer of hope on the South Side, look no further than Shane Smith. The Rule 5 pick is making the most of his opportunity in the rotation; he threw six innings of two-run ball in his start on Sunday and now has a 2.04 ERA and a 3.00 FIP.
As for the Rockies, they were completely shut out across their three games in San Diego; they have scored a pitiful 40 runs total so far this season. To their credit, they called up Chase Dollander and Zac Veen last week and Adael Amador on Sunday, so at least they’re getting their prospects valuable big league development time. It’s only mid-April, but Colorado is already looking toward the future.