Archive for Featured

The Second-Half Slides That Have Crowded the Wild Card Races

It didn’t explicitly come up in the Effectively Wild podcast spot I did highlighting this year’s Team Entropy series, but one reason why the Wild Card races that I covered in my second installment early this week are so wild — with five teams chasing two spots in the AL, and five more chasing one spot in the NL — is a handful of prominent collapses. The Mets, Padres, and Red Sox all spent a good chunk of the season occupying playoff positions, with New York and Boston occupying the top spots in their respective divisions for more days than any of their competitors. Yet all three teams could miss out on October baseball thanks to some of the most drastic first half-to-second-half drop-offs we’ve seen in recent years.

The Mets, despite a slew of injuries, led the NL East — at times with company in first place — for nearly four months, from April 13 to August 6, with a slight return after falling out of first that stretched the window to August 13. They somehow did that by posting winning records only in May (17-9) and July (14-13), and even after being overtaken, they remained within striking distance for about half of a dreadful August during which they went 9-19. Since the July 30 trade deadline, when they acquired Javier Báez but arguably didn’t do enough to bolster their rotation — a decision that was exacerbated by Jacob deGrom’s subsequent setback, which came to light almost immediately after the deadline passed — they’ve gone just 17-28. At this writing, they’re 72-75, 5 1/2 games behind the Braves in the NL East, and five behind the Cardinal for the second NL Wild Card spot, with cumulative playoff odds of 2.1%. I’m skeptical they’ll be relevant by the time I next cover Team Entropy.

The Red Sox had an on-and-off relationship with first place in the AL East, occupying at least a share of it from April 8 through May 23, and then again for most of a stretch that ran from June 19 through July 30. They’ve gone just 20-24 since the deadline passed, for the third-worst record in the AL; they did so while the Rays (29-14), Blue Jays (31-16), and Yankees (29-16) peeled off the AL’s top three records in that span. A wave of COVID infections has played a part, knocking 12 players — including Xander Bogaerts, Enrique Hernández, Chris Sale, and Matt Barnes — out of action since August 27; notably, the Red Sox are one of the six teams that has failed to reach the 85% vaccination threshold to loosen protocols, though the majority of those infected were vaccinated. They’re now 8 1/2 games back in the AL East, but occupying the second Wild Card spot, a percentage point behind the Blue Jays and half a game ahead of the Yankees, with Playoff Odds of 75.3%.

The Padres were projected to be one of the NL’s two best teams, albeit in a division occupied by the other one, the Dodgers. But while the defending champions have indeed been one of the top two, it’s been the Giants, not the Padres, who have provided their closest competition; San Diego has spent just 14 days in first place in the NL West. Even so, they spent nearly three-quarters of the season with Playoff Odds of 75% or better, but have gone just 16-25 since the deadline, and 10-21 since August 10. Having just won back-to-back games for the second time in the past five weeks, they’ve closed the gap behind the Giants to, uh, 18 1/2 games, but their Playoff Odds have dwindled to 32.0%.

As you can see, there’s a pretty wide spread when it comes to these three teams’ chances of playing October baseball, but each has fallen significantly from the spots they occupied earlier in the season. Depending on where I set the endpoints, their slumps might appear even more acute, which works for storytelling purposes, but is harder for comparative analysis. Since all three were riding rather high in early July, I decided to see how their declines in winning percentage from the first 81 games — a point the Padres reached on June 29, the Red Sox on June 30, and the Mets on July 4 — to the second compared to those of other teams in recent years.

As it turns out, the Padres’ drop from a .593 first-half winning percentage — the first 81 games of the season, not the uneven “halves” defined by proximity to the All-Star break — to a .422 second-half mark so far is the fourth-largest since 2012, the start of the two Wild Card team era; their dip ranked second until this two-game hot streak. Meanwhile those Red Sox and Mets rank among the dozen largest drop-offs, with yet another team from this year, one I hadn’t even considered for this piece given my apparent East Coast bias, in the top 20:

Largest Winning Percentage Drop-Offs After First 81 Games
Team Year W-L1 WPCT1 W-L2 WPCT2 WPCT Dif Postseason
Brewers 2014 49-32 .605 33-48 .407 -.198
Athletics 2014 51-30 .630 37-44 .457 -.173 Wildcard
Mets 2012 44-37 .543 30-51 .370 -.173
Padres 2021 48-33 .593 27-37 .422 -.171
Giants 2016 50-31 .617 37-44 .457 -.160 Wildcard
Rangers 2019 45-36 .556 33-48 .407 -.149
Diamondbacks 2018 47-34 .580 35-46 .432 -.148
Pirates 2012 45-36 .556 34-47 .420 -.136
Mariners 2018 50-31 .617 39-42 .481 -.136
Red Sox 2021 50-31 .617 33-34 .493 -.124
Mets 2021 44-37 .543 28-38 .424 -.119
Rangers 2016 52-29 .642 43-38 .531 -.111 Division Champ
Pirates 2013 51-30 .630 43-38 .531 -.099 Wildcard
Yankees 2018 54-27 .667 46-35 .568 -.099 Wildcard
Phillies 2018 44-37 .543 36-45 .444 -.099
Astros 2015 47-34 .580 39-42 .481 -.099 Wildcard
Athletics 2021 47-34 .580 31-33 .484 -.096
Nationals 2015 45-36 .556 38-43 .469 -.087
Blue Jays 2014 45-36 .556 38-43 .469 -.087
Astros 2017 54-27 .667 47-34 .580 -.087 WS Champ

That’s not really a list you want to be on, judging by the minimal postseason impact of those teams. Obviously, we don’t yet know the playoff fates of the Padres, Red Sox, Mets (well, I think we know that one), and A’s (welcome to the party). Of the other 16 teams, seven made the playoffs; four won Wild Card games (the 2013 Pirates, ’15 Astros, ’16 Giants, and ’18 Yankees), but the only one that won a Division Series or a later round was the ’17 Astros, who, well, you know. Only one team with a drop-off of at least 87 points and a sub-.500 record in the second half won so much as a Wild Card game, namely the 2015 Astros.

Since the A’s turn up here, their arc is worth retracing as well. Despite being outscored in both April and May, strongly suggesting that they were playing over their heads, they climbed to the top of the AL West, and spent all but a single day of the next two months there, from April 20 to June 20. Despite their stellar June (17-9), an Astros team that had been lurking just behind them overtook them, and while the A’s were just 1 1/2 games back at the 81-game mark, and just 2 1/2 back at the 115-game mark (August 14) after some ups and downs, they’ve lost 18 of their last 29 and fallen seven games back. Their Playoff Odds peaked at 76.9% on June 18, and spent the next two months mostly in the 40-60% range, but they’ve plummeted from 62.5% on August 12 to just 4.3%.

So that’s two AL and two NL teams that have each taken rather dramatic tumbles this season. As you can see from the table above, it’s the second time within this span we’ve seen four teams from a single season take such falls; in 2018, the Yankees and Mariners both crumbled, as did the Phillies and Diamondbacks, with Philadelphia even sliding below .500 for the season to finish 80-82.

Not surprisingly, all four of these teams that have crashed in 2021 have underachieved relative to their Pythagenpat records during the second half. The Padres are the only ones who were underachieving during the season’s first half as well:

Second-Half Sliders
Team RS1 RA1 WPCT1 Pyth WPCT1 RS2 RA2 WPCT2 Pyth WPCT2
Red Sox 5.06 4.47 .617 .557 5.10 4.93 .493 .516
Padres 4.57 3.60 .593 .607 4.47 4.89 .422 .459
A’s 4.54 4.14 .580 .543 4.70 4.28 .484 .543
Mets 3.72 3.64 .543 .509 4.27 4.64 .424 .463
SOURCE: Baseball-Reference

For the Padres, this has mainly been about the collapse of a rotation projected to be the majors’ best coming into the season; it’s been lit for a 5.52 ERA and 4.82 FIP in this second half. Yu Darvish has been battered for a 7.67 ERA and 5.74 FIP in 54 innings during this slide, that while landing on the injured list twice, for left hip tightness and lower back tightness. Ryan Weathers has completely collapsed (9.00 ERA, 7.55 FIP in 38.1 innings) after a promising beginning, Chris Paddack (5.74 ERA, 4.13 FIP in 42.1 innings) has had some bad luck, and even Joe Musgrove has regressed (3.79 ERA, 4.31 FIP). On the other hand, Blake Snell (3.03 ERA, 3.34 FIP) turned his season around, but a groin strain forced him out during the first inning of his September 12 start against the Dodgers. Adding insult to injury, the Padres reportedly were close to acquiring Max Scherzer at the deadline, only to watch as the Dodgers snatched him away, and he’s been brilliant. Scrapheap pickup Jake Arrieta? Not so much.

Run prevention has become a major issue for the Red Sox as well, with both the rotation and bullpen (4.42 ERA and 4.59 ERA, respectively) underperforming their FIPs by about four-tenths of a run. High-leverage guys such as Barnes, Adam Ottavino, and Hansel Robles have been particularly lousy. On the offensive side, the Sox have been a juggernaut, but while they’ve received a 100 wRC+ or better from nine out of the 11 players with 90 or more PA since July 1, Bogaerts (107 wRC+) and J.D. Martinez (108) haven’t been themselves, and rookie center fielder Jarren Duran (50) was over his head before landing on the COVID-19 injured list.

The Mets have continued to show holes on both sides of the ball. Offensively, Jeff McNeil (91 wRC+), James McCann (66), and Dominic Smith (56) have come up notably short even while the arrival of Báez (156), the return of J.D. Davis (118), and the upswing of Francisco Lindor (139) after a dreadful beginning to his season have helped; the last of those made the 36 games he missed due to an oblique strain a particularly big thumbs down. While late July additions Rich Hill and Trevor Williams have been pretty good, they don’t add up to a deGrom; meanwhile, the much-awaited arrival of Carlos Carrasco (5.59 ERA, 4.38 FIP) hasn’t really panned out, and Taijuan Walker (7.04 ERA, 6.90 FIP) has turned into a pumpkin. Key relievers such as Seth Lugo, Trevor May, Jeurys Familia, and Edwin Díaz have taken steps backwards of varying size at the wrong time as well.

By runs scored and allowed, the A’s have produced the same Pythagenpat winning percentages in both halves, but have gone from overachieving by 37 points to underachieving by 59 points, making for both the largest second-half shortfall and the largest overall swing relative to their expected record. The second-half fades of Sean Manaea and James Kaprielian and the frightening loss of Chris Bassitt (who’s still rehabbing his way back) have loomed large in the rotation. The bullpen — particularly Lou Trivino, Sergio Romo, and Yusmeiro Petit, three of the most four heavily-used relievers in the second half — has proven shaky as well.

For as much as these four teams have in common in terms of the severity of their second-half slides, and for as crowded as they’ve made the Wild Card races, it’s clear by now that the A’s and Mets are just hanging on, while the Red Sox are odds-on favorites to make it through, and the Padres are hardly out of it. Still, when the playoff slate is finally set, at least some of these teams will look back and wonder what might have been, and how they fell so far.

Choose Your Own Lineup Adventure: On-Base vs. Slugging

Let’s get right down to the question that all baseball analysis is asking at its core: Which of these two players would you rather have on your team, all else being equal?

Two Mystery Players
Player AVG OBP SLG wOBA
Player A .319 .387 .469 .371
Player B .267 .328 .556 .372

It’s a close one, right? That’s largely because I decreed it to be so; these aren’t real players, just stat lines I made up that have the same wOBA. Who would you rather have? They’re extremely different, of course; one gets a ton of value from walks and singles, with some doubles sprinkled in for good measure. You can surmise that the other gets a ton of value from home runs — look at that slugging percentage — but does worse elsewhere.

Oh yeah, a few other caveats. These are underlying talent levels; you might look at Player A and say that the BABIP can’t continue, or Player B and say the HR/FB rate can’t be real, but for our purposes, these are the lines they’ll put up over 1,000 PA, or 10,000, or 1,000,000. This is their real skill level. Given that, in most cases, it doesn’t matter much which one you choose, because they’re about the same. That’s the point of wOBA, after all.

That’s not a very interesting answer, so I decided to go deeper. I constructed a generic American League lineup. I removed intentional walks so that we’re comparing apples to apples. The result looks like this:

Generic Batting Order
Order BA OBP SLG wOBA
1 .261 .328 .423 .325
2 .256 .324 .423 .323
3 .255 .332 .458 .339
4 .255 .325 .453 .333
5 .248 .319 .431 .323
6 .240 .308 .408 .309
7 .233 .294 .399 .299
8 .227 .289 .371 .287
9 .228 .293 .360 .285

I threw that lineup into a lightly modified version of my lineup simulator, a short snippet of code that lets you put in a lineup (based on the probability of each outcome every time they bat) and get an estimate of how many runs they’d score per game. This one comes out to 4.53 runs per contest, which is close enough to the actual AL average for my purposes. Read the rest of this entry »


The Best Bunts of the Year, Part Two

Yesterday, I compiled the worst bunts of the season. They were bad in various ways — poor execution, great defense, a spot where failing was particularly painful — but they all cost their team dearly. Today, we’re looking at the opposite: the bunts that have added the most value.

As a refresher, this absolute gem was the best bunt of the first third of the season:

That perfect execution of an audacious plan is the platonic ideal of a bunt. If every successful bunt this season was like that, this would be a really fun series to write. A well-placed bunt is art; post five of those, and I could skate by with almost no commentary and let the GIFs do the talking.

Sadly, that’s not quite the case. There’s quite a bit of bad defense this time around — plenty of errors in the top five. That’s just how bunts work: they’re designed to force the defense to make a play, and while defenders are excellent, they’re not automatons. A sacrifice bunt that works as planned is never going to be one of the best plays a team can make — it’s designed to minimize variance, neither as bad as a strikeout nor as good as a single. The best bunts of the year by WPA, then, need to either score runs without surrendering outs or feature dubious fielding.

So yeah, some of these bunts aren’t perfectly placed gems that the defense has to eat. Some of them are just players making bad throws or bad decisions. As a palate cleanser, though, take a look at this beautiful honorable mention. Read the rest of this entry »


The Worst Bunts of the Year, Part Two

Earlier this year, I took a look at the worst (and best) bunts of the year. I couldn’t help myself. It’s simply too much fun to watch the best-laid bunting plans go down in flames, while a perfectly executed bunt is one of the most exciting plays in baseball.

Originally, I planned on waiting until the end of the season to update both lists. I forgot something, though: the end of the season is really busy and fun as it is. Playoff races, individual awards, wondering where the Mets went so wrong. There are already innumerable annual traditions to write about at season’s end. Instead, I decided to get a head start on these standout bunts, and circle back if one improbably beats them out for the worst (or best) bunt of the year.

As a reminder, here was the worst bunt of the first third of the season:

That one was really bad, both in execution and outcome. It cost the Cardinals dearly — more than a quarter of a win by WPA. It’s not easy to lose so much value in a single play on offense. With that in mind, I’ll be answering a bonus question for each bunt in this list: was it worse than José Rondón’s ill-fated attempt? Without further ado, let’s get bunting. Read the rest of this entry »


Team Entropy 2021: Let’s Get Wild

This is the second installment of this year’s Team Entropy series, my recurring look not only at the races for the remaining playoff spots but the potential for end-of-season chaos in the form of down-to-the-wire suspense and even tiebreakers. Ideally, we want more ties than the men’s department at Macy’s. If you’re new to this, please read the introduction here.

Heading into July 4, at the exact midpoint of their season, the Yankees were just 41-40. Beset by injuries and underperformance, they even scraped .500 before the fireworks could go off, losing the first game of a holiday doubleheader to the Mets before rebounding to take the nightcap. From July 4 until now, they’ve gone 39-24, good for the second-best record in the entire American League, and good enough to vault them back into contention for a playoff spot, though not enough to catch the Rays, who have gone 42-19 in that stretch.

Within that impressive hot streak are two shorter, diametrically opposed streaks, however. From July 4 through August 27, the Yankees went 35-11, the hottest 46-game span of any team in the majors all season, and one capped by a 13-game winning streak, tied for the majors’ longest. The tear vaulted them from sixth in the AL Wild Card race, five games out of the second spot, and into the Wild Card lead, three games ahead of the second Wild Card team (the Red Sox), and 6 1/2 games ahead of the race’s third-place team (the A’s). Since then, however, the Yankees have skidded to an AL-worst 4-12 record, and they’ve now got company; at 80-64, they’re a game behind the Wild Card-leading Blue Jays (81-63) and in a virtual tie with the Red Sox (81-65).

That skid — aided by the Jays going 38-25 from July 4 through Monday, and 15-2 while the Yankees have gone 4-12, a situation that Ben Clemens detailed on Monday — has created quite a pileup in AL Wild Card race, where five teams are separated by just 2 1/2 games from top to bottom. The NL Wild Card race is similarly tight; while the second-place team in the NL West (currently the Dodgers) is head and shoulders above the rest of the group, five other teams are separated by just 3 1/2 games top to bottom. The chances of getting bonus baseball in each league — a do-or-die game just for the right to play in the do-or-die Wild Card game — are a bit better than one in six. As to how the various scenarios will be disentangled, that’s a job for the latest Team Entropy 2021 installment. Read the rest of this entry »


Are Hitters Who Swing At More Strikes and Fewer Balls Actually Better?

If you’ve read any of my articles of late, you would know that I am currently fixated on plate discipline. My piece on Jarred Kelenic sparked an article on take value and hitter approach. After that, a discovery that Darin Ruf is succeeding with one of the lowest swing rates in baseball despite not having phenomenal plate discipline on the surface inspired research into zone-swing differential and what it may tell us about a hitter.

Under the plate discipline section of player pages and on our leaderboards, we list both O-Swing% and Z-Swing%. On a handful of occasions, though, writers here have used zone-swing differential. Chet Gutwein defined this stat as D-Swing% in his piece about the NL West, and Justin Choi wrote about it in an article on the Blue Jays’ aggressiveness in early counts. In my most recent piece on Ruf, I cited zone-swing differential to conclude that while his overall swing rate is low, his discipline might not actually be that good, as he’s still swinging at a fair amount of pitches outside the zone, which you can see when you look at his below-average D-Swing rate.

The idea behind D-Swing% is simple: Hitters should be better when they swing at strikes and take balls. This isn’t the only way to succeed at the plate, but you would think that better hitters would have higher D-Swing rates on average. There were a couple comments about D-Swing rate on my Ruf piece, and that inspired me to look into it further. Is this a stat that tells us more about hitters than what we already have with the standalone O-Swing% and Z-Swing% stats?

This exact question was actually explored on the FanGraphs community blog back in 2017, where user Dominikk85 broke hitters into top- and bottom-30 groups by wRC+, ISO, OBP, and BABIP to see if O-Swing%, Z-Swing%, or what they referred to as Z-O-Swing% had the biggest impact in explaining the difference between the groups. They found that being more aggressive in the strike zone “helps the power but seems to slightly hurt the OBP,” but overall, they saw an advantage in using D-Swing% over the individual components.

I ran a similar study, but I wanted to control for more variables — zone rate and contact rate — to isolate the effect of D-Swing%, as many plate discipline metrics are interrelated. You may swing less at pitches in the strike zone if you are seeing more pitches outside, or you may choose to swing at pitches in the strike zone with which you can make contact (preferably hard), which may lower your Z-Swing% but raise your Z-Contact%. Without at least attempting to adjust for some of these variables, we may be missing out on conscious hitter tendencies that may be more the result of the pitches that they are seeing rather than their inherent swing choices. Read the rest of this entry »


The Blue Jays Soar Into Playoff Position

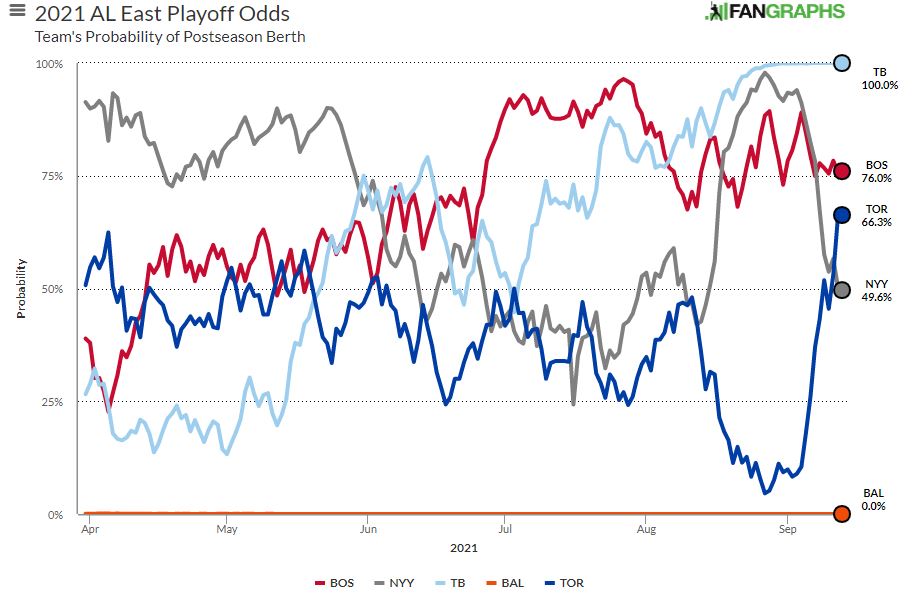
Mere weeks ago, the Toronto Blue Jays were 66-61, the last of five teams in contention for two Wild Card spots. They looked the part — their +112 run differential led those five, and adding José Berríos at the deadline helped stabilize their rotation. That’s all well and good, but they were 6.5 games out of the second Wild Card, and their bullpen was undoing a lot of the rotation’s good work, especially new acquisition Brad Hand’s 8.22 ERA and 8.12 FIP.

Despite their evident talent, our playoff odds game them only a 4.7% chance of reaching the playoffs at their nadir on August 27. A one-in-20 shot isn’t impossible — less than 5% of plate appearances end in a home run, and yet we see tons of those every day — but things didn’t look good for Toronto. But here we are, three weeks later, and the Jays are in the first Wild Card spot (in a tie for it, but still). How did those rampaging Jays do it? Let’s take a look. Here’s a graph of what we’ll be talking about:

First things first: if you want to overcome a big deficit quickly, stop losing. The Jays have gone 14-2 in their past 16 games, scoring a comical 7.5 runs per game while allowing just over four themselves. That’s good for a Pythagorean record of .774 (using the Pythagenpat formulation of it), or in regular English, “Stop using a record estimator when a team is scoring twice as many runs as they allow, of course they’re doing well.” Read the rest of this entry »


Max Scherzer Chases Perfection and Collects Milestones

Max Scherzer couldn’t quite pull off a trifecta for the ages on Sunday, but he was utterly dominant nonetheless. Facing the Padres in Los Angeles, he entered the history books with a flourish by becoming the 19th pitcher to reach 3,000 strikeouts, and just the third to record three immaculate innings — nine pitches, nine strikes, three strikeouts — in a career. Along the way, the 37-year-old righty retired the first 22 batters he faced, giving chase to a perfect game and his third career no-hitter, but he couldn’t complete that feat, as Eric Hosmer, who earlier in the game had become his 3,000th strikeout victim, broke up his bid with an eighth-inning double into the right field corner.

Not that the hit put a damper on the afternoon given what Scherzer accomplished. Making his eighth start for the Dodgers and needing six strikeouts to reach the milestone, he simply dominated the Padres all afternoon. He got to work quickly, striking out leadoff hitter Trent Grisham and needing just 12 pitches to get through the first, before mowing down Fernando Tatis Jr., Hosmer, and Tommy Pham consecutively on three-pitch strikeouts in the second.

The immaculate inning made Scherzer the third pitcher and the first right-hander to total three such innings in his career, joining lefties Sandy Koufax and Chris Sale. Scherzer previously threw immaculate innings against the Phillies (May 14, 2017) and Rays (June 5, 2018). Read the rest of this entry »


The Past, Present, and Future of International Scouting

“I was at dinner with our scout in Japan and he made a comment that even truck drivers throw 95 over here,” said Oakland’s Assistant General Manager Dan Feinstein. “That caught my attention. I said, ‘If that’s true, maybe we should be trying out some of these truck drivers.'”

Feinstein soon decided to run an experiment. Oakland advertised an open tryout for pitchers and invited players with a college pedigree to send video to the A’s scouting department. From there, the team invited 60 of them to throw in front of scouts. One of them, right-hander Shohei Tomioka, bumped 95 on the gun, which impressed Oakland enough to offer him a contract then and there. “We call it the truck driver tryout,” Feinstein said with a chuckle.

Tomioka’s story was only possible because of a brilliant combination of scouting and technology, with a dash of luck mixed in. His signing is also an indication that the international talent market is laden with players just waiting to be discovered. See, Tomioka wasn’t simply a truck driver with a live arm. He was an experienced pitcher, a graduate of one of Tokyo’s top baseball programs — he was just never seen at the right time by the right people. By the time Oakland discovered him, he was loitering in a small local league. “There’s a lot of independent ball over there,” Feinstein says, “and he had been pitching in one of these kind of obscure leagues. He was free to try out and was throwing 95 so we signed him.”

For anyone lamenting the rise of big tech in baseball or the demise of the scout, Tomioka is living proof that, for good and for ill, an element of the unpredictable remains in the game. His signing demonstrates the value of having a robust international department, while also highlighting how fertile the international market is today, and how teams that invest abroad now stand to reap a competitive advantage in the years to come. To get a better sense of how that might develop, let’s take a deeper dive into how teams scout internationally today. Read the rest of this entry »


Sunday Notes: Xzavion Curry is Commanding Attention

Xzavion Curry is a prospect-on-the-rise in the Cleveland organization. A seventh-round pick in 2019 out of Georgia Tech, the 23-year-old right-hander is 8-1 with a 2.23 ERA in 18 starts between Low-A Lynchburg and High-A Lake County. With the lion’s share at the latter, Curry has allowed just 65 hits in 93 innings. Moreover, he’s fanned 118 batters and issued just 16 free passes.

Command is Curry’s forte, but it’s not his only attribute. As our own Eric Longenhagen wrote in early June, the 5-foot-11, 195-pound hurler’s “vertical arm slot creates angle and carry on a fastball that plays well at the letters.” Augmenting Curry’s 91-94 mph four-seamer are a curveball, a slider, and a changeup.

He’s only been a full-time pitcher for a handful of years. Curry came to Georgia Tech as a two-way player, having excelled both on the mound and at short as an Atlanta-area prep. That his college coaches made him a full-time pitcher is a testament to changing times. Curry is African-American, and Black players have historically been channeled into position-player roles. Black pitchers have been at a premium.

“That does enter my mind,” said Curry, who had a 17-inning scoreless streak come to an end earlier this week. “As I go around to different places, and play different teams, I don’t really see a lot of Black pitchers. So that is something I’ve noticed, but as the younger generation goes forward, those guys just keep getting better and better. We have a couple in our organization, and I’m pretty sure we’ll start to see more and more Black pitchers.”

Curry cited a different sport when addressing his plus command. Read the rest of this entry »