Archive for Angels

Tommy La Stella is Doing Mike Trout-like Things

Just as we all predicted in spring training, Tommy La Stella has taken over the Angels’ lead in home runs, surpassing Mike Trout. Wait, what?

You’re forgiven if you haven’t been paying much attention to the Angels, who are 20-22, haven’t been more than a game above .500 all season, and are now more than a month removed from their last time at that plateau. Trout was impossibly hot to start the season, but he cooled off, and Shohei Ohtani only made his 2019 debut last week, albeit without the novelty of double duty due to his Tommy John surgery. The Ohtani-less rotation has been dead-last dreadful, with practically everybody carrying ERAs and FIPs in the 5.00s, 6.00s, and 7.00s, or else on the injured list, and there’s been no heroic career turnaround for Matt Harvey, to say the least. Albert Pujols just passed the 2,000 RBI milestone, but he’s a shadow of his former self, and who cares about RBI, right?

Into this less-than-compelling spotlight has stepped La Stella, a 30-year-old lefty-swinging infielder who entered this season best known for his pinch-hitting prowess (.278/.397/.386 in 193 PA) and the Cubs’ gentle handling of his mid-2016 walkabout, the kind of thing that could have ended his career. The Angels acquired him last November 29 in exchange for a player to be named later (lefty reliever Conor Lillis-White) who has yet to throw a competitive inning in 2019, and are paying him all of $1.35 million. In our preseason Positional Power Rankings, we forecast La Stella to receive just 77 plate appearances as the Angels’ second baseman behind David Fletcher, with another 105 at third base behind Zack Cozart, and 14 at designated hitter. Given that he’d hit just 10 homers and produced a 96 wRC+ (.264/.345/.366) and 2.0 WAR in 947 career plate appearances — including just one homer and an 86 wRC+ in 192 PA last year — he wasn’t on anybody’s radar as a potential impact player.

Read the rest of this entry »


I Wanna Be Like Mike (Trout)

It’s amazing to write about baseball through the lens of a singular player like Mike Trout. The sheer totality of his excellence is fun in a way that just wouldn’t be true if you looked at all of his skills individually. Trout is an above-average outfielder, sure, but that isn’t all that fun by itself. He has great plate discipline — so too, though, does 2019 Jason Heyward, and he doesn’t spark the same kind of joy as Trout. No, the fun is that there’s basically no category you can come up with where Mike Trout isn’t good.

This got me to thinking: would it be fun to have a player who was like Trout, except not to quite the same degree? I don’t mean in the broad player value sense — in a way, every player in baseball is just a worse version of Trout. No, I mean someone who’s good at everything across the board in the same way that Trout is — just, a little less.

Trout hits for power, so our mystery player will need to hit for good (but sub-Troutian) power. Scratch both Joey Gallo and Jose Altuve from the list. They have to have an excellent eye at the plate and be judicious with their swings; sorry, Javier Baez, but the ride ends for you here. They need to be an above average baserunner, but not the best of the best — J.D. Martinez and Trea Turner both fall at this hurdle.

To work out this highly unscientific study, I started with stats from 2017-present for everyone who qualified for the batting title in at least one of the three years. This lets me cast a wide net without picking up someone whose prime isn’t happening now. First, I looked for players who were worse than Trout in a few categories: ISO, OBP, SLG, BsR/PA, BB%, and K%. (At this point in the search, I learned that Trout has a higher ISO than Aaron Judge, and I mean, wow.) Read the rest of this entry »


The Unstoppable Matt Shoemaker

I thank God every day. It’s still a dream. Being here, it’s a dream. It’s surreal and I’m trying to hold onto it.

Matt Shoemaker, 2013

***

The Blue Jays are playing the A’s. Two out, an 0-2 count in the bottom of the third, a runner on first. Matt Shoemaker is facing Stephen Piscotty.

You can probably guess what’s coming next. It’s Shoemaker’s specialty, his put away pitch, the pitch he has thrown 71% of the time this season when facing a right-handed hitter in a two-strike count: a splitter, diving out of the bottom of the zone. Matt Chapman guesses, and he takes his chances, straying a few steps away from first. Stephen Piscotty guesses, and when the pitch leaves Shoemaker’s hand, he doesn’t swing.

They guess right — it’s a splitter, low, and it hits the dirt in front of Danny Jansen. Ball one. But Jansen recovers it faster than Chapman can recover his steps. He throws to first, where Rowdy Tellez is waiting, ready. They have Chapman caught. And as Tellez chases after him, ball in hand, Shoemaker does what he’s supposed to do. He runs from the mound to cover first, and when the ball comes his way, he, too, is ready. He sprints alongside Chapman, both of them unstable, the unwieldy dance of the rundown clearly in its dying stages. Shoemaker reaches out his glove, turns to avoid a collision, and suddenly —

Something is wrong. Read the rest of this entry »


Guessing the Fate of April’s Underachieving Pitchers

Earlier this week, I made my on-the-record guesses for what would happen with some of April’s underachieving hitters. Now we’ll turn to look at the disappointing pitchers and the potential for more helpings of crow for me to eat come October.

Chris Sale, Boston Red Sox

Last year, through the late-season shoulder problems, I counseled people not to panic so soon on Sale. He’s Chris Freaking Sale after all. When the White Sox put him in the rotation in 2012, there was a lot of doom-and-gloom about how his pitching motion and his frame meant he wouldn’t survive long as a starting pitcher. But from 2012-17, Sale was one of the most durable starters in baseball and now he drinks overflowing pints out of the skulls of those pundits.

But now, I am quite worried, especially in the short-term. He’s shown he can occasionally dial it up as he did in the Yankees matchup, hitting 96-97 through most of the game. But his velocity is generally down, severely so in most games. He went three months without a start below an average of 95 mph last year. This year he’s only had individual pitches passing this mark in a single game (the Yankees one).

If this is the Sale that we have now, I do expect him to adjust in the long-term. But the Sale of 2018 had a highly edited repertoire. He’s essentially a fastball-changeup-slider pitcher who is amazing at changing the look of these pitches. He could throw his fastball anywhere between 88-98 and have it look like five different pitches depending where it was. In 2019, he’s Pavarotti with an octave taken away. His fastball is more one-note and hitters have realized it; of every 10 fastballs that batters swing at, one in 10 of those swings-and-misses from previous years are now being hit.

“But Dan, he’s just being cautious because of his shoulder!” That makes me even more worried if 10 months later, he’s still having to pitch in a way that makes him a less effective pitcher because of a shoulder issue. Elbow problems are bad, but shoulder problems are a whole new level of scary, like going from a haunted house at an elementary school carnival to a Saw movie. I’m hopeful in the long-term, but it’s a problem for Boston getting back into the race. Read the rest of this entry »


The Angels Refuse To Strike Out

As you probably already know, strikeouts are on an upward trend. Since 2005, baseball’s strikeout rate has increased every single year, and here in the first few weeks of 2019, it is up yet again. Hitters are striking out at a 23.3% rate, already representing a percentage point increase over their 2018 mark.

There is one team, though, that appears to be bucking the strikeout trend in a big way. Through 776 plate appearances, the Angels have struck out just 16.0% of the time, the lowest rate of any team in the major leagues. In the same breath, Los Angeles’ hitters are walking at the 14th-highest rate, 9.7%. This excellent combination of limiting strikeouts and drawing walks has resulted in a team-wide 0.60 BB/K ratio, which unsurprisingly leads the league.

Of course, a lot of this might have to do with Mike Trout. In 77 plate appearances, Trout has 18 walks to just nine strikeouts. But even if you were to remove Trout from the Angels’ team-wide stats, their strikeout rate would only “jump” to 16.5%. This would still be 1.9 percentage points better than the next closest team, the Athletics (18.4%).

This unique characteristic that Angels hitters are demonstrating clearly goes beyond Trout. In fact, among the 10 Angels hitters with at least 50 plate appearances, four have more walks than strikeouts. Across the rest of the league, there are only seven non-Angels hitters who have 50 plate appearances and can say the same, and no other team has more than two. Read the rest of this entry »


Hot Starts to Believe In

T.S. Eliot once mused that April is the cruelest month, but for me, it’s the most curmudgeonly one. While baseball returning is always a good thing, a good portion of my April job is to (partially) crush the hopes and dreams of fans excited about hot starts from their favorite players. While stats don’t literally lie, April numbers, thanks to our old friend and scapegoat small sample size, only tell a little bit of the story of 2019. But as cautious as I try to be about jumping to conclusions in baseball’s first month, at least some of those torrid beginnings will contain more than the customary grain of truth. So let’s go out on that proverbial limb and try to guess which scorching Aprils represent something real.

Yoan Moncada

I’ve been burned before touching this hot stove, but there’s something so compelling about Moncada’s early-season performances as to once again disarm the skeptic in me. In 2018’s version of this piece, Moncada’s high exit velocity and his .267/.353/.524 April line had me believing that he had finally turned the corner, the one long-expected from a young, talented player with impressive physical tools.

As the narrator meme goes, he had not turned that corner. Moncada spent the next two months with an OPS that didn’t touch .600, and his final 2018 line represented no real improvement over his 2017.

Moncada is hitting the ball just as hard as he did last year, with his average exit velocity ranking sixth in baseball. But this time around, his performance is also coming with some significant progress in his contact statistics. Moncada’s profile has always been a bit weird in that he doesn’t seem to have a serious problem chasing bad pitches, certainly not as you would expect from a player who just led the league in strikeouts with the fourth-highest total in baseball history. But Moncada was in the top 20 in not swinging at pitches outside the zone.

In 2019, he’s been more aggressive, swinging at more bad and good pitches, but there hasn’t been a corresponding contact tradeoff, and he’s in fact making more contact overall, especially against good pitches. Given that one of the purposes of plate discipline is for hitters to actually hit the good pitch they eke out of the dude on the mound, I once again return to the ranks of the believers. Read the rest of this entry »


Daily Prospect Notes: 4/15/19

These are notes on prospects from lead prospect analyst Eric Longenhagen. Read previous installments here.

Patrick Sandoval, LHP, Los Angeles Angels
Level: Double-A   Age: 22   Org Rank: 16   FV: 40
Line: 5 IP, 4 H, 2 BB, 0 R, 9 K

Notes
Acquired from Houston in exchange for Martin Maldonado last summer, Sandoval now has 45 strikeouts in 28.2 career innings at Double-A. He continues to work with middling fastball velocity but some mechanical elements help it to play better than 90-94. Houston got Sandoval to open his front side a little more, tilt his spine, and release the ball with a more vertical arm slot than he was using in high school. It’s a weirder look for hitters and creates more backspin and, therefore, more “rise” on his fastball. Sandoval also works heavily off his two secondary pitches, and his changeup may be better than we currently have it projected to be on The Board. The strike-throwing is still inconsistent start to start, but Sandoval is officially having upper-level success for a franchise that keeps having injury issues on the big league roster, so perhaps he should be included in the Canning/Suarez/Barria group of young hurlers who may help the Angels sooner than later.

Nate Pearson, RHP, Toronto Blue Jays
Level: Hi-A   Age: 22   Org Rank: 4   FV: 50
Line: 5 IP, 1 H, 0 BB, 0 R, 9 K

Notes
Pearson was removed from his previous start after just 27 pitches, so it was a relief to see him back and dominant five days later. Pearson’s future as a strike-thrower is hard to anticipate. He was wild last fall but he hadn’t pitched all year due to a fractured ulna, so that wildness could have just been due to rust. He threw 43 of 59 pitches for strikes yesterday, a sign he may actually be able to harness his alien stuff and find a way to start long-term. He may be on an innings limit this year, so unless the Jays expertly manicure his workload with a big league goal in mind (perhaps that two-inning outing last start is an indication of how they’ll handle Pearson throughout the year) it’s unlikely we see him in the big leagues until next year at least. It’s still too early to reposition Pearson in our rankings due to increased confidence that he’ll start, but yesterday’s outing, during which he sat 94-98 and touched 102, could soon be part of a body of evidence indicating we should.

Anderson Tejeda, SS, Texas Rangers
Level: Hi-A   Age: 20   Org Rank: 4   FV: 45+
Line: 2-for-5, 2 HR

Notes
These were Tejeda’s first two homers of the year. He’s back at Hi-A despite having success there last year, presumably so the Rangers can let Michael De Leon (who peaked as a teenager) get regular at-bats at Frisco for the third consecutive year. Tejeda is off to a strong start, and may force a promotion to Double-A (and into our Top 100) if he keeps it up for another few weeks.

Ljay Newsome, RHP, Seattle Mariners
Level: Hi-A   Age: 22   Org Rank: NR   FV: 35
Line: 6.2, 4 H, 0 BB, 0 R, 10 K

Notes
We touch base on players like Newsome when we write the org lists. He threw a lot of innings last year and he barely walked anyone, so we checked on the stuff to see if it cleared the bar to stick someone on the list at all. With Newsome, that had not been true. Despite all the strikes, his fastball has been in the mid-to-upper 80s basically since high school, and those guys typically max out as spot starters. Now, Newsome is different. He took part in an offseason velo program and now resides in the 91-94 mph range. He’s clearing his front side a little more, his two-seamer has more tail, he’s working up in the zone with his four-seamer more often, and is setting up his changeup better. Take the performance of a 22-year-old repeating Hi-A with a grain of salt, but know Newsome has grown and changed, and is off to a strong start.

A Weird Box Score
Tulsa pitchers combined to no-hit Arkansas into extra-innings last night, but still lost due to a slew of walks in the 10th inning. The Arkansas staff allowed five hits, but fewer total baserunners than Tulsa did, so in my opinion, justice was done.

Weekend Notes
I saw mostly amateur stuff over the weekend, as both Adley Rutchsmann and Andrew Vaughn (the top two prospects on our Draft Board) were in the state of Arizona. Neither did anything to merit a move in our rankings. The only surprising moment of my weekend was seeing a person in a Detroit Tigers polo operating an Edgertronic camera. To this point, I had only seen Houston employees training cameras like that on hitters.

We’ve begun experimenting with high speed video and while some of its applications (beyond just looking cool) are obvious, especially as it relates to pitching (who is spin efficient, who is not, ah, there’s also a two-seamer, etc), we’re curious if there are applications on the hitting side beyond just breaking down mechanics.


Their Powers Combined: Finding the Best of Trout and Harper

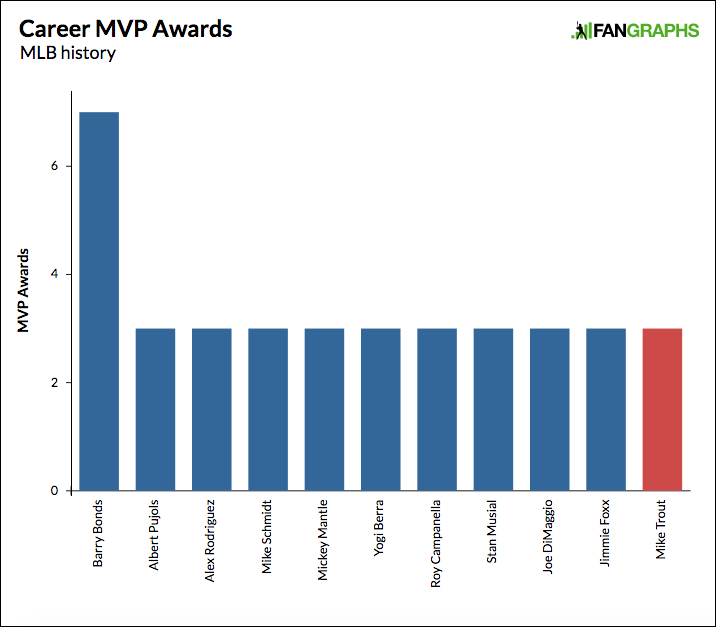
By now — and barring a mid-career role reversal — the arguments over the relative greatness of Mike Trout and Bryce Harper have been settled in favor of the Millville Meteor. Trout has perennially played at an MVP-caliber level since 2012, winning the award twice while finishing second four times and fourth once, the year that he missed more than a quarter of the season due to a thumb injury, and — as of this week — has climbed to sixth in the JAWS rankings among center fielders. Harper owns one MVP award and might have won a second if not for a late-season knee injury in 2017, but in terms of consistency and overall levels of accomplishment, he’s second banana. Trout has chalked up five seasons worth at least 9.3 WAR, which matches Harper’s best, but the latter’s second- and third-best seasons merely add up to 9.2 WAR. As Jeff Sullivan put it in his penultimate post, “Mike Trout Has Been as Good as Manny Machado and Bryce Harper Combined.”

Yet Trout and Harper remain inextricably linked in the minds of many (including this scribe) in part because on the day that Harper debuted in the majors (April 29, 2012), Trout returned from Triple-A for good, and both players took their respective leagues by storm en route to Rookie of the Year awards. Though separated by about 14 months in age, they’re part of a baseball cohort in a way that Trout and Paul Goldschmidt or Giancarlo Stanton (whose totals of plate appearances are all in the same vicinity), or Harper and Machado (whose free agencies coincided) are not. The relatively stoic Trout and the more demonstrative Harper pair well as contrasts, too. Trout is so routinely great without calling attention to himself that he sometimes recedes into the background, to the point of being forgotten, while Harper’s combination of hot streaks and exuberance is more eye-catching — in grabbing our attention, he also reminds us that hey, that other guy is playing even better.

The dynamic duo are currently scalding the ball, in case you haven’t noticed. Harper, who signed a record-setting 13-year, $330 million contract, is off to a flying start with the Phillies (.314/.500/.743, four home runs, and a 198 wRC+ through Wednesday).

Trout, who signed a record-setting $12-year, $430 million extension less than three weeks after Harper inked his deal, is flying even higher (.406/.592/.938, five home runs, and a 288 wRC+).

The coincidence of their current hot streaks got me wondering whether we’re seeing their collective apex, the peak pair. The answer, within the way I chose to address the matter, is “pretty damn close.” For this, I called upon our player graphs tool — putting the graphs in FanGraphs, after all — to calculate each player’s rolling 10-game wRC+ since the aforementioned point of arrival in 2012. This ignores defense, for which we can’t get any kind of reliable read across 10 games anyway, and makes the familiar squiggly pictures, like so…

…And so…

Using that page’s “Export Data” function, I calculated the pair’s combined wRC+ for every date on which they both played and had the requisite 10 games in the sample (we’re not yet to 15 games for either player in 2019, hence this choice). That means that if one player was on the disabled list, or even had an off day, there’s no data point for that day. On the other hand, each player’s 10-game range might have different dates attached due to such absences.

Here’s the top 20 of the pair’s most productive stretches, with overlapping 10-game spans included:

Highest Combined 10-Game wRC+ for Trout and Harper
Rk Season End Trout PA Trout wRC+ Harper PA Harper wRC+ Combined wRC+
1 2017 4/26/17 44 209.0 43 369.9 288.5
2 2015 5/16/15 43 154.4 44 403.2 280.2
3 2015 5/17/15 43 154.4 45 376.9 268.1
4 2017 4/27/17 43 197.3 44 326.5 262.7
5 2015 7/20/15 44 274.7 40 149.5 261.4
6 2015 9/23/15 44 223.4 42 297.6 259.7
7 2019 4/9/19 40 313.8 45 208.0 257.8
8 2017 4/25/17 43 204.3 42 311.9 257.5
9 2015 6/20/15 41 234.2 42 279.6 257.2
10 2017 4/28/17 44 229.0 45 283.4 256.5
11 2017 4/21/17 42 194.9 47 309.4 255.4
12 2015 6/16/15 41 220.0 43 285.3 253.5
13 2015 9/22/15 43 213.1 42 289.6 250.9
14 2015 9/19/15 43 193.4 41 304.7 247.7
15 2015 5/15/15 42 112.4 44 366.8 242.6
16 2015 7/10/15 45 286.2 43 193.3 240.8
17 2016 9/3/16 46 314.3 42 158.8 240.1
18 2013 8/7/13 45 316.2 42 158.1 239.9
19 2017 4/22/17 42 202.8 46 273.6 239.8
20 2017 4/24/17 43 195.1 42 285.3 239.7

As it turns out, April 9 — the point at which Harper reached 10 games this year (Trout had done so two days earlier), and the last point for which we have data, because Trout hasn’t played since then due to a groin strain that we’re all praying is minor — is the end of the seventh-best such stretch. Trout’s videogame-like numbers you saw above; Harper was hitting .333/.511/.788 for a 210 wRC+ before taking an 0-for-3 and an early exit from Wednesday night’s 15-1 drubbing by the Nationals. The heavyweight championship belongs to a stretch in late April 2017 during which Harper hit .588/.674/1.206 with five homers, with Trout at .375/.432/.725 and three homers.

One aspect of this that’s particularly striking is that we have to dig down to the 19th spot to find a combined performance that lands in an even-numbered year. Harper hit for a career-low 111 wRC+ in that 2016 season, four points lower than in 2014 and nine points lower than in 2012. For some weird reason, he’s simply been better in odd-numbered years, like two-time Cy Young winner Bret Saberhagen.

Condensing the above table to remove the overlapping streaks (i.e., tossing out the third-ranked streak, because most of it is already represented within the second-ranked streak) yields this top 10:

Highest Combined 10-Game wRC+ for Trout and Harper, No Overlap
Rk Season End Trout PA Trout wRC+ Harper PA Harper wRC+ Combined wRC+
1 2017 4/26/17 44 209.0 43 369.9 288.5
2 2015 5/16/15 43 154.4 44 403.2 280.2
3 2015 7/20/15 44 274.7 40 149.5 261.4
4 2015 9/23/15 44 223.4 42 297.6 259.7
5 2019 4/9/19 40 313.8 45 208.0 257.8
6 2015 6/20/15 41 234.2 42 279.6 257.2
7 2016 9/3/16 46 314.3 42 158.8 240.1
8 2013 8/7/13 45 316.2 42 158.1 239.9
9 2012 10/1/12 46 224.9 43 250.3 237.2
10 2016 7/3/16 47 297.3 48 146.7 221.2

From a contemporary standpoint, that’s more satisfying, as this season’s opening salvo climbs to fifth (not third, as I originally had it when this published — score that E6). Streaks from every season except 2014 and ’18 are represented, with the 2015 season, Harper’s MVP year, dominating the charts, as separate streaks from May, June, July, and September all rank among the top six. Harper pulls his weight here, owning the higher wRC+ of the pair (highlighted with the bold-faced numbers) in five of the streaks .

As for the coldest spells, I’ll skip to the mirror image of the second table, identifying only the extremes of each discrete streak:

Lowest Combined 10-Game wRC+ for Trout and Harper, No Overlap
Rk Season Date Trout PA Trout wRC+ Harper PA Harper wRC+ Combined wRC+
1 2016 9/17/16 41 59.7 42 32.8 46.1
2 2016 7/29/16 43 106.5 40 16.6 63.1
3 2012 8/15/12 45 136.2 45 15.2 75.7
4 2018 5/19/18 39 118.8 44 37.9 75.9
5 2013 9/28/13 45 99.3 40 54.5 78.2
6 2012 9/25/12 43 113.4 41 52.7 83.7
7 2014 8/2/14 47 101.3 42 66.7 85.0
8 2016 5/30/16 46 115.3 37 50.8 86.6
9 2014 8/17/14 47 44.0 44 135.4 88.2
10 2015 8/18/15 43 70.5 46 108.2 90.0

Above we’ve got almost entirely even-year streaks, with one exception apiece from 2013 and ’15. Every season but 2017 and this one is represented, with 2016 the most common one. During the very worst stretch, in September 2016 — a rare instance of both players falling well below 100 — Harper hit .094/.310/.188, with a home run representing one of his three hits, and Trout hit .229/.317/.229 without a homer. For eight of the 10 stretches, it’s Harper dragging the pair down, with a wRC+ below 70; that conforms to the general impression that he’s the more slump-prone player of the two.

One could certainly look at the matter in other ways, using larger sample sizes — going by 15-game stretches with the same methodology, for example, or simply by our monthly splits, or even full seasons. On that last front, 2015 gets the nod on the basis of combined wRC+ (184) or WAR (18.6) if we’re bringing defense into this. By the monthly splits, the pair’s combined wRC+ of 243 for March and April (which we customarily lump together, as we do for September and October) would rank first, but with an asterisk, as it’s the only month besides April 2012 for which the pair has combined for fewer than 100 PA. Discarding what would be the second-ranked month (June 2014) on the grounds that Harper had just four PA, the best combined month for the pair is July 2015, when Trout (260) and Harper (172) combined for a 214 wRC+ in 193 PA. Incidentally, by this method the pair has combined for a 120 wRC+ or better in every month for which we have a meaningful sample from both save for July 2016, when Trout (144) and Harper (65) combined for a 104 mark.

Still, I do like the immediacy of the 10-game sample and the fact that it places what we’ve witnessed so far this season near the top of the heap. If Trout doesn’t miss too much time, there’s a chance we can see that number climb. All of which serves to remind us that while major league baseball has problems on and off the field that shouldn’t be ignored, the level of talent today is astounding, and anytime Trout and Harper are both firing on all cylinders is a great time to be watching.


Daily Prospect Notes: 4/11/19

These are notes on prospects from lead prospect analyst Eric Longenhagen. Read previous installments here.

Cole Tucker, SS, Pittsburgh Pirates
Level: Triple-A   Age: 22   Org Rank: 5   FV: 50
Line: 3-for-5, HR, 2 SB

Notes
Readers are often looking for a prospect outside the top 50 who might break out and move near the top of our overall list. My answer to that question is typically some big, projectable teenager who I expect to experience sizable physical growth. Tucker is rare in that he’s also a viable answer to this question even though he turns 23 this summer. Having answered once-relevant, shoulder-related questions about his arm strength, Tucker is now seen as a plus-gloved shortstop who has good feel for contact. But because he still has this big, seemingly unfinished frame on him, we think it’s possible that he comes into power a little late, and he might take a sizable leap. A source indicated to me that Tucker looks noticeably bigger and stronger this year. He hit for power during the first week of the season, and his batted ball data should be monitored for a possible indicator that he’s made a mechanical adjustment, too.

Tarik Skubal, LHP, Detroit Tigers
Level: Hi-A   Age: 22   Org Rank: HM   FV: 35
Line: 6 IP, 2 H, 1 BB, 1 R, 6 K

Notes
Kiley saw Skubal last night and had him up to 97, with an average breaking ball. A possible second or third rounder as a college underclassman, Skubal’s amateur career was derailed by an elbow injury that required Tommy John. He missed his junior year, instead throwing side sessions in front of scouts close to the draft. Nobody was confident enough to pull the trigger on drafting him, and he went back to school and couldn’t throw strikes. The Tigers signed him after his redshirt junior year for $350k and he threw almost all fastballs during his first pro summer. Things seemed to have clicked a bit.

Michael Baumann, RHP, Baltimore Orioles
Level: Hi-A   Age: 23   Org Rank: 28   FV: 35+
Line: 5 IP, 1 H, 0 BB, 0 R, 10 K

Notes
Orioles pitching prospects should be considered potential movers this year as the new front office applies the player dev philosophy that seems to be working in Houston. Baumann already has some components Houston might have otherwise tried to install; he has a vertical release point that looks like it creates backspin, he throws hard, and he works up in the zone. Maybe that just means he has less to fix and is likely to improve more quickly than others in the system. He was up to 96 last night.

Brendan McKay, LHP, Tampa Bay Rays
Level: Double-A   Age: 23   Org Rank: 2   FV: 60
Line: 4.2 IP, 2 H, 1 BB, 3 R, 11 K

Notes
McKay’s stuff is not especially nasty — he was 91-95 last night — but his fastball plays up because of good extension. All of his pitches look the same coming out of his hand, and he has shockingly good feel for pitching even though his attention has been split between the mound and the plate for much of his career. If he keeps dominating Double-A hitters like this, it’s fair to start considering him as a potential big league option sometime this year.

Shed Long, 2B/3B/LF, Seattle Mariners
Level: Triple-A   Age: 23   Org Rank: 6   FV: 50
Line: 4-for-5, BB, walk-off HR

Notes
Shed’s defensive assignments mimic what we saw during spring training. He remains a 40 glove at second base who survives through a combination of athleticism and will, but he’s going to mash enough that you want him in your lineup every day. I tend to think of multi-positional players as individuals who excel defensively at various spots, but maybe it’s time to consider if players who can really hit can be barely playable at several positions and just spend each game at a different spot in the field, wherever they’re the least likely to touch the ball that day. Willians Astudillo would seem to be another candidate for a role like this, and perhaps it could be taken to a batter-by-batter extreme. Hiding your worst defensive player is old hat in other sports; maybe there’s a better way to do it in ours.

A Quick Rehabber Update
I saw Angels lefty Jose Suarez rehab in Tempe yesterday. He looked good, sitting 91-93, with command and an above-average curveball (it’s slow but has good bite, and he commands it), and some plus changeups. He didn’t break camp due to a sore shoulder, which is kind of scary, but the stuff looks fine. The Angels rotation has struggled with injuries, so Suarez might see the big leagues this year. He’s in our top 100.

On Pedro Avila
Padres righty Pedro Avila makes his big league debut tonight against Arizona. Expect him to sit 90-94 and touch 96, have scattered fastball command, and try to work heavily off secondary stuff — a change and curveball — that is consistently plus. His long term role may ultimately be in the bullpen, especially since three-pitch relievers may become more necessary due to forthcoming rule changes.


Getting Mike Trout to a 15-WAR Season

The baseball world suffered a brief moment of shock on Tuesday night. Mike Trout, who needs no introduction within this interrupting clause to emphasize his greatness, was replaced by Peter Bourjos in the fourth inning of the Angels-Brewers game. Afterwards, Trout was diagnosed with a mild groin strain, and baseball collectively breathed a large sigh of relief. It appears that he plans to miss just a single game with the injury.

Before Trout exited on Tuesday, however, he had already gone 2-for-2 at the plate, adding yet another game to his hot start; in 49 plate appearances this season, Trout is slashing .406/.592/.938. Even in a brief outing, his WAR total still managed to increase, moving from 1.2 to 1.3. As of Wednesday, he is tied with Cody Bellinger for the major league lead in WAR rounded to one decimal place.

As we all know, Trout is the WAR king. He’s already put up 66.2 WAR in his career, making him the most valuable player in baseball since 2006, even though his career didn’t even start until 2011 and his first full season didn’t even come until 2012. I could go on and on about how great Mike Trout is at producing WAR, but a lot of those articles have already been written here and at other places.

One article that did catch my attention, however, was this 2015 piece from August Fagerstrom titled “Getting Mike Trout to 168.4 WAR.” In this piece, Fagerstrom outlined a potential career curve for Trout to hit 168.4 total WAR, a mark that would tie him with Babe Ruth for the most WAR produced by a single player in baseball history.

In this piece, I plan to do something similar but different. As in Fagerstrom’s piece, I want Trout to tie Ruth, but on a different WAR leaderboard: the all-time single-season mark. Read the rest of this entry »