Archive for Teams

Effectively Wild Episode 1337: Season Preview Series: Angels and Brewers

EWFI
Ben Lindbergh and Jeff Sullivan banter about Manny Machado signing with the Padres and what the news means for the free-agent market and the futures of the NL West, the Phillies, and Bryce Harper, then preview the 2019 Los Angeles Angels (31:34) with The Athletic’s Angels beat writer, Fabian Ardaya, and the 2019 Milwaukee Brewers (1:02:42) with The Athletic’s Brewers beat writer, Robert Murray, plus a postscript on Machado and Don Newcombe.

Audio intro: The Frames, "Finally"
Audio interstitial 1: The Minus 5 (Feat. Ben Gibbard), "I See Angels"
Audio interstitial 2: Chip Taylor, "Why Milwaukee"
Audio outro: Led Zeppelin, "Ten Years Gone"

Link to Ben’s Machado piece
Link to Jeff’s Machado piece
Link to Padres celebration thread
Link to Ben’s Calhoun article
Link to Baseball Mogul offer
Link to preorder The MVP Machine

 iTunes Feed (Please rate and review us!)
 Sponsor Us on Patreon
 Facebook Group
 Effectively Wild Wiki
 Twitter Account
 Get Our Merch!
 Email Us: podcast@fangraphs.com


The Padres Are Actually Signing Manny Machado

According to those estimated franchise values at Forbes, the San Diego Padres are in the bottom half of baseball’s 30 organizations. Perhaps even more relevant, the Padres are routinely among baseball’s bottom ten spenders. The Padres have pretty much never behaved like a big-market team, and after long enough, that creates a pretty rigid impression. One thinks of the Padres the way one might think of, say, the Reds. When it comes to high-profile free agents, you feel comfortable ruling them out. Why would you think the Padres would be a player?

Of course, teams can choose to change. And as much as we might still think of free agency as directing players toward certain big spenders, you never know when someone might surprise you. One offseason ago, the biggest free-agent contract went to Eric Hosmer, and it was given by the Padres. And now this offseason, the biggest free-agent contract so far is going to Manny Machado, and it’s being given by the Padres. According to reports, the deal will be worth $300 million over ten years, with an opt-out after year five. It’s close enough to the contract we’ve always expected. I just don’t think anyone really expected the team.

The Padres read the market, and they chose to be aggressive, where other clubs were more cautious. Now the door could be open a year ahead of schedule.

Read the rest of this entry »


Ray Black, Tanner Scott, and Matt Strahm on Learning and Developing Their Sliders

Pitchers learn and develop different pitches, and they do so at varying stages of their lives and careers. It might be a curveball in high school, a cutter in college, or a changeup in A-ball. Sometimes the addition or refinement is a natural progression — graduating from Pitching 101 to advanced course work — and often it’s a matter of necessity. In order to get hitters out as the quality of competition improves, a pitcher needs to optimize his repertoire.

In this installment of the series, we’ll hear from three pitchers — Ray Black, Tanner Scott, and Matt Strahm— on how they learned and developed their sliders.

———

Ray Black, San Francisco Giants

“When I was in high school, I had the privilege of working with Andy Ashby, who is pretty much a legend around Wilkes-Barre. We messed around a little bit with a slider at the time, but I really started developing it more coming back from my Tommy John surgery. I blew out my senior year.

“My curveball was too big, too loopy, and easy to distinguish. I think I was throwing it almost 20 mph slower than my fastball. When you’re younger, you see this big breaking ball, somebody is diving out of the way, and you’re like, ‘Man, that’s nasty.’ But when you get up to the higher levels, you realize it’s more deception; it’s not just movement. I tried to develop a slider like a cutter. That’s what I think when I throw my slider: cutter. If I don’t, I always end up trying to make it bigger than it should be. I need to try to keep it tight, keep it small. Read the rest of this entry »


Dustin Pedroia Tries to Rebound

It’s a rare day when a player looks back on a championship-winning season with something approaching regret, but then, Dustin Pedroia didn’t get much chance to contribute to the Red Sox during their World Series-winning 2018 campaign. After being limited to 105 games in 2017, largely due to ongoing discomfort in his left knee, Pedroia underwent an experimental cartilage restoration procedure that was expected to cost him the first couple months of last season. He returned in late May, but played just three games before inflammation forced him back to the injured list, and he spent the rest of the season as a bystander as the Sox overcame his absence while romping to their fourth title in the last 15 seasons.

“I don’t regret doing it, but looking back and knowing what I know now, I wouldn’t have done it,” Pedroia told reporters in Fort Myers last week, referring to the surgery, called osteochondral allograft transfer surgery, which involves grafting cartilage from a cadaver. While basketball and soccer players had undergone the procedure prior to Pedroia, teammate Steven Wright was the only baseball player who had done so.

The 35-year-old second baseman, who had previously undergone surgery to repair a torn meniscus in his left knee in October 2016 (among his numerous other ailments), believes both that he pushed himself too hard and that some of the expectations with regards to recovery times were “a little off.” In retrospect, he believes that avoiding the surgery in favor of longer rest and rehab might have been a more productive route. “It’s a complicated surgery,” said Pedroia. “The cartilage in my knee is great now. The graft is the thing. You’re putting somebody else’s bone in your body. To get that to incorporate fully, there are so many things going into it that.”

For what it’s worth, Wright, who was limited to 53.2 innings last year by three separate trips to the injured list for left knee inflammation (as well as a 15-game suspension for violating the league’s domestic violence policy) and missed the entire postseason, is similarly less than enamored with the results of his cartilage restoration surgery, which took place on May 8, 2017, 5 1/2 months prior to Pedroia’s. “It’s been tougher mentally than physically,” he told reporters last week. “It’s a game where it’s tough on your body, but then when you’ve got a flat tire going out there trying to pitch, it makes it a little bit tougher.” Wright later said that his knee currently feels like it’s been from a flat tire to a spare.

In anticipation of Pedroia’s early-2018 absence, the Red Sox retained July 2017 acquisition Eduardo Núñez in free agency, but both he and utilityman Brock Holt struggled in the role, to the point of topping my Replacement Level Killers list in late July. To that point, Sox second sackers had combined for a sad-sack -0.7 WAR. On July 30, they traded for the Tigers’ Ian Kinsler, who was replacement-level as well, though he did represent a defensive upgrade. In all, the eight players Boston used at second base — a cast rounded out by Brandon Phillips, Tzu-Wei Lin, Mookie Betts (!), and Blake Swihart — combined to hit .252/.308/.350 for a 75 wRC+ and -0.3 WAR. Only the Giants and Tigers were worse in the last two categories.

All of the participants save for Phillips and Kinser (who signed with the Padres) remain on the Red Sox’s 40-man roster. President of baseball operations Dave Dombrowski told reporters last week that he’s not expecting Pedroia to play 150 games. “We’re hopeful that he’s a 125-game player at this point,” said Dombrowsk. “We do feel we have some people who are solid and can fill in. To fill in if [Pedroia] plays 120, guys like Holt, a guy like Nunez coming over there. Even some depth with Tzu-Wei Lin in our organization we like a great deal.”

Our current depth charts projections, which feature Pedroia getting 74% of the team’s plate appearances at second base, forecast him for a .272/.344/.390 line with 2.0 WAR, and for the group as a whole to return 2.5 WAR, good for 12th in the majors. While the Red Sox would probably be overjoyed if things unfold that way, history suggests there may be less reason for optimism. Along the lines of what I did for Troy Tulowitzki last August, I asked Dan Szymborski to put together a list of infielders who are over 30 — shortstops and third basemen as well as second basemen, in order to start with a larger pool than the Tulo study — and missed all or nearly all of a season, then returned to the majors. I used 100 plate appearances as the upper limit for the “missed” season (Pedroia had 13), and confirmed with a variety of resources that the players’ absences were due to injuries, not detours to foreign leagues or mere attrition. As before, I considered only players from 1980 onward. The resulting list of 18 players was less than encouraging, to say the least:

Infielders 30 and Over Who Missed Most or All of a Season
Name Year Age Pos PA wRC+ WAR Year PA wRC+ WAR
Troy Glaus 2008 31 3B 637 128 4.8 2010 483 104 0.0
Rick Burleson 1981 30 SS 490 116 4.0 1983 134 95 -0.1
Derek Jeter 2012 38 SS 740 117 3.2 2014 634 75 0.2
Alex Gonzalez 2007 30 SS 430 99 2.2 2009 429 58 0.3
Aaron Boone 2003 30 3B 656 102 2.1 2005 565 80 0.2
Randy Velarde 1996 33 2B 611 106 1.8 1998 224 108 0.5
Jeff Frye 1997 30 2B 442 102 1.7 1999 131 82 -0.5
Herbert Perry 2002 32 3B 496 109 1.6 2004 153 69 -0.3
John Valentin 1999 32 3B 503 78 1.3 2001 70 64 0.0
Art Howe 1982 35 3B 415 80 1.2 1984 161 71 0.0
Jay Bell 2001 35 2B 509 93 0.9 2003 142 49 -0.8
Rafael Furcal 2012 34 SS 531 86 0.7 2014 37 23 -0.2
Carney Lansford 1990 33 3B 564 90 0.6 1992 561 102 1.9
Alex Gonzalez 2011 34 SS 593 75 0.6 2013 118 11 -0.9
Tony Fernandez 1995 33 SS 438 77 0.5 1997 442 93 2.1
Scott Spiezio 2004 31 3B 415 67 -0.1 2006 321 123 1.3
Cesar Izturis 2010 30 SS 513 46 -0.4 2012 173 56 -0.4
Rafael Santana 1988 30 SS 521 66 -0.6 1990 13 87 -0.1
Average 528 92 1.5 266 83 0.2

One can wave off individual results here and there on various grounds. Sports medicine has improved vastly over the past four decades, and in considering Pedroia, it’s debatable how much we can extrapolate from players’ failures to recover from injuries to other body parts, such as Jeter’s ankle, the shoulders of Burleson, Glaus, and Perry, or the elbows of Fernandez, Howe (who also underwent ankle surgery), and a quartet of Tommy John surgery recipients (Furcal, Izturis, Santana, and Velarde). We can also debate the propriety of comparing the fates of players who were 30 or 38 at the start of these sequences to that of a 34-year-old.

Even so, within the timeframe, I couldn’t find any examples of an over-30 infielder who was significantly above replacement level both before missing most or all of a season and then again in his return year. Gonzalez (the “Sea Bass” one) underwent microfracture surgery in his left knee in March 2008 and did post a big 3.0 WAR season in 2010; he’s in this table twice thanks to a 2012 torn ACL. And Velarde, who underwent Tommy John surgery, totaled about 10 WAR from 1999-2001, but both needed at least one more year to recover form.

That said, three players who had dreadful seasons pre-injury did rebound substantially upon returning. Lansford, the regular third baseman for the A’s from 1983-1990 (including their three pennant-winning teams from 1988-1990) was pretty lousy in the last of those seasons, then suffered serious right shoulder and left knee injuries while snowmobiling in Oregon in January 1991. A’s vice president Sandy Alderson said at the time, “Carney’s contract doesn’t say he can snowmobile and it doesn’t say he can’t,” adding that the team declined to pursue terminating his employment. Lansford played just five games in the 1991 season, but returned for a solid 1992 season before retiring.

Fernandez, who racked up 43.5 WAR in a career that spanned from 1983-2001, endured a career-worst season as the Yankees’ starting shortstop in 1995, then fractured his right elbow in March 1996. The Yankees turned to the 22-year-old Jeter, who went on to win AL Rookie of the Year honors while helping the team win its first championship in 18 years. Fernandez missed the entire season, then resurfaced with the Indians in 1997, hitting for a 93 wRC+ with 2.1 WAR; he spent three more years in the majors and accumulated 4.9 WAR.

Spezio, a useful infielder for the Angels (6.6 WAR from 2000-2003), struggled in the first year of a three-year, $9.15 million deal with the Mariners (67 wRC+ and -0.1 WAR in 415 PA) in 2004. Between being relegated to a backup role by the free agent signings of Adrian Beltre and Richie Sexson, missing 10 weeks due to an oblique strain, and then drawing his release in late August, he was limited to 51 PA in 2005. Divorce, depression, and substance abuse — the last two of which would further derail his career years later — were contributing factors to his 2005 struggles. Nonetheless, he played a significant role for the Cardinals’ 2006 championship team, posting a 123 wRC+ and 1.3 WAR in 321 PA.

Even with that trio in my quick-and-dirty study, the group of players I identified averaged a meager 83 wRC+ and 0.2 WAR in their returns. Limiting the player pool to those whose pre-injury seasons were worth at least 1.0 WAR, which clears out some light hitters whose careers were essentially on their last legs anyway, the averages are 81 wRC+ (down from 105 pre-injury) and 0.0 WAR (down from 2.4) — an even steeper drop that probably owed something to more complete players getting longer leashes.

All of which is to say that if history is a guide, the 2019 Red Sox may not get anything close to the Pedroia they’re used to, the one who has never really had a below-average season. Even in his most injury-wracked campaigns, when his bat has been about average (98 wRC+ in 2014, 101 in 2017), he’s played at a three-win pace, solidly above average if not up to the standard that helped him make four All-Star teams and win four Gold Gloves from 2008-14. That said, even a slog of a season is unlikely to mean the end of the line for Pedroia, given that he’s still owed $40 million through 2021 via the eight-year, $110 million extension he signed in July 2013.

If Pedroia can recover some semblance of form, the stakes are high; he still has a shot at a Hall of Fame berth. He’s got the hardware (AL MVP, AL Rookie of the Year, three World Series rings, two of them as starter), but with 1,803 hits, he needs two seasons worth of playing time to reach 2,000, a number that has functioned as a bright-line test for Hall voters when it comes to post-1960 players. Likewise he’s still short in JAWS. He’s 19th among second basemen at 47.3, 9.6 points below the standard, but he’s only 2.0 WAR below the seven-year peak standard (42.4 versus 44.4). Given Chase Utley’s retirement short of 2,000 hits, Kinsler’s fade, and the PED suspension of Robinson Cano, none of this era’s aging second baseman have clear paths to Cooperstown, but a functioning if not fully resurgent Pedrioa would be best positioned to change that.

Of course, talk of any resurgence is premature when discussing a player whose availability can’t yet be taken for granted. If he’s batting leadoff on Opening Day, per manager Alex Cora’s promise for when he’ll return, Pedroia will have hit the first big mark.


Prospect Limbo: The Best of the Post-Prospects

Prospects “graduate” from prospect lists when they exceed the playing time/roster days necessary to retain rookie eligibility. But of course, that doesn’t mean they’re all in the big leagues for good. Several are up for a while but end up getting bounced back and forth from Triple-A for an extended period of time. Others get hurt at an inopportune moment and virtually disappear for years.

Nobody really covers these players in a meaningful way; they slip through the cracks, and exist in a limbo between prospectdom and any kind of relevant big-league sample. Adalberto Mondesi, Jurickson Profar, A.J. Reed, and Tyler Glasnow are recent examples of this. To address this blind spot in coverage, I’ve cherry-picked some of the more interesting players who fall under this umbrella who we didn’t see much of last year, but who we may in 2019. Read the rest of this entry »


2019 ZiPS Projections – New York Yankees

After having typically appeared in the hallowed pages of Baseball Think Factory, Dan Szymborski’s ZiPS projections have now been released at FanGraphs for more than half a decade. The exercise continues this offseason. Below are the projections for the New York Yankees.

Batters

After I posted the Yankees’ WARtoon on twitter, lots of people responded by picking the overs, particularly when it came to Luke Voit. Don’t be greedy. This is essentially a mean projection of 96-99 or so wins. Didn’t you learn the meaning of A Christmas Carol? If you hoard all the WAR, you will be visited by George Steinbrenner’s ghost. Wait, that actually sounds pretty cool, unless he brings along a ghastly manifestation of the Ken Phelps trade. (What is a ghost’s favorite player? Jay BOO-hner.)

ZiPS may be low on Voit, but 2.4 WAR per 600 plate appearances is an above-average first baseman, and Voit doesn’t have a long track record of excellence. It was only in 2017 that ZiPS started being interested in him, seeing his combined major league time and minor league translation as a .283/.352/.481 line. In 2018, the combined line was .284/.361/.516, not all that different in the big picture. Voit’s not a young player, and while he has hit very well in the majors, a player’s minor league career doesn’t just evaporate the second they hit the bigs and rock the league in a cup of coffee (see: Chris Singleton or Shane Greene).

The Yankees appear to have an almost Dodgers-like level of flexibility, with a number of infielders who can theoretically play every other position on the diamond. It’s a bit of over-engineering, but ideally, top teams should accumulate depth in this manner. I’d argue that the Phillies ought to have tried to sign Mike Moustakas, though he may not have been all that interested upon realizing that he’d basically be the team’s backup in the event Manny Machado cares to sign.

ZiPS now projects Aaron Hicks to be the fifth best center fielder in baseball. It’s a weird timeline, but we’re in it. Hicks is a borderline star and the fluke talk should be more or less behind us. Read the rest of this entry »


2019 ZiPS Projections – Minnesota Twins

After having typically appeared in the hallowed pages of Baseball Think Factory, Dan Szymborski’s ZiPS projections have now been released at FanGraphs for more than half a decade. The exercise continues this offseason. Below are the projections for the Minnesota Twins.

Batters

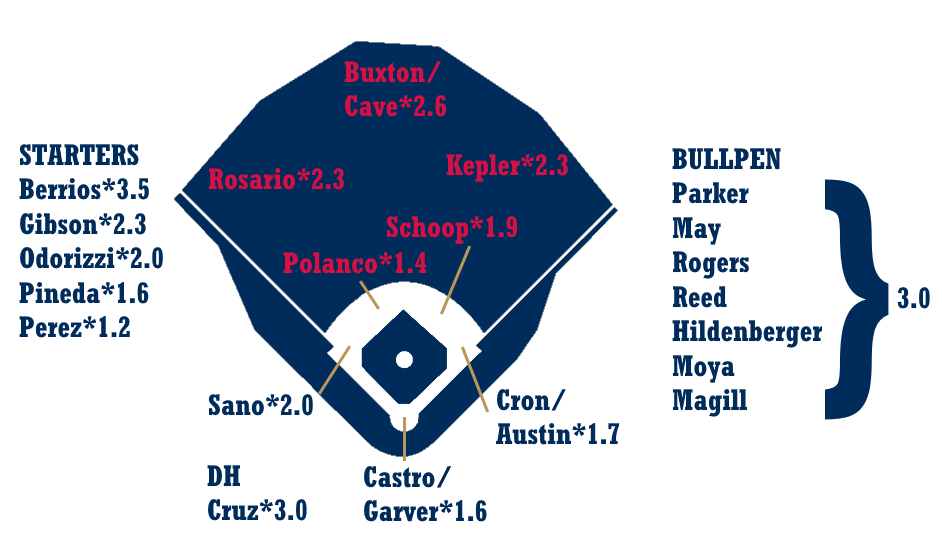
In a league that is largely dominated by teams at the extremes of winning and rebuilding, the Minnesota Twins represent an increasingly rare breed: the excruciatingly, unbearably, average team. If you look at the lineup from top to bottom, there just aren’t any horrible weaknesses, with the bottom of the ZiPS ranks (Jorge Polanco, and the catching and first base timeshares) still living in the neighborhood of league-average; no scary negatives or zero-point-somethings lurk in there. But the highs aren’t really that high, either; Nelson Cruz tops the projections at 2.6 WAR, thanks to a .266/.348/.500 line. That’s the lowest top projected offensive WAR for any team that hopes to be a realistic contender in 2019.

This situation is not entirely the team’s fault, of course. ZiPS, like the Twins and most prospect-watchers, thought that Byron Buxton and Miguel Sano would, by this point, be players who formed the core of Minnesota’s lineup. There are a number of valid criticisms of how the Twins have managed Buxton and Sano, especially the former. Buxton’s inconsistent performance has been maddening, but so has the team’s tendency to go back-and-forth on whether he needed to be in the majors or the minors at any given time. His regular injuries add another frustrating complication. ZiPS has generally been optimistic about Buxton’s future, even when he’s struggled in the majors, but at this point, it’s only buying him as a league-average overall performer thanks to his excellent glove. It’s a good thing I don’t believe in curses; several years ago, I noted that ZiPS was rather cruel in assigning Carlos Gomez as Buxton’s top offensive comp, but it’s been more on-target than a computer can understand.

One of the problems with having a team full of average players is that it becomes damned hard to upgrade. There’s nowhere in the lineup where the Twins can be improved by any significant margin by adding a two-win player; really, even a three-win player would be an underwhelming addition at most positions. To upgrade the team’s offense, they need to add a legitimate star. And if that’s less likely to come by way of giant breakouts from Sano or Buxton than it once appeared, money becomes the best option in the short-term. After chasing Yu Darvish last year, I thought the Twins might sneakily be real players in the free agent market this offseason, but they really haven’t been. In a division with three rebuilding teams and a Cleveland squad whose plan in the outfield includes a heavy dose of Jordan Luplow, it feels like Minnesota should be more carpe diem and less dimitte diem.

Pitchers

The theme of being largely average continues with the pitching staff. Only Jose Berrios (at 14-10, 3.93, and 3.2 WAR) really pushes out of that middling range in the rotation. While his 2018 looked vaguely similar to his 2017, Berrios bumped up his strikes by a batter a game, and it still feels like that he has some ceiling left, even if ZiPS sees him continuing to pitch at about the same level. Berrios’s changeup has always looked nastier than it’s actually played on the field. I can’t speak for Twins fans, but to me, it’s looked like a pitch that should have struck out more than a mere 15 batters (against 11 home runs) in the right-hander’s brief career.

ZiPS remains unexcited about Blake Parker — one of the Twin’s “big” offseason moves — getting the highest-leverage innings, and instead sees Taylor Rogers or Trevor May (higher upside) as being better suited for the role. The projections are also bullish on Andrew Vasquez, a big lefty who serves up more sliders than White Castle and who rose from the Florida State League to the American League in ten weeks. But overall, the back of the bullpen looks shallower than other contenders’ and the highs are not quite as high. Of the teams that look to be around .500 or better, ZiPS projects Minnesota’s bullpen to be around the bottom, along with the Washington Nationals.

Bench and Prospects

Nick Gordon‘s offensive development has been a bit spotty, but ZiPS still sees him as a league-average regular in his prime, on the level of a slightly-better Polanco. That’s fine, but Royce Lewis’s projection is more exciting, with ZiPS seeing him peak as a 20-25 home run hitter, with projected lines in the .260/.330/.460 range, which will still work if he ends up playing center field rather than short in the majors. He even projects as useful if he were to play in the bigs this year, which is an impressive feat for a player with two months of Hi-A experience. As for Alex Kirilloff, while ZiPS doesn’t see him ever being a high-OBP player when his batting average inevitably comes down, his prime projections check in with just over a .280 batting average, with slugging percentages peeking just over the .500 mark.

One pedantic note for 2019: for the WAR graphic, I’m using FanGraphs’ depth chart playing time, not the playing time ZiPS spits out, so there will be occasional differences in WAR totals.

Ballpark graphic courtesy Eephus League. Depth charts constructed by way of those listed here at site.

Batters – Counting Stats
Player B Age PO G AB R H 2B 3B HR RBI BB SO SB CS
Nelson Cruz R 38 DH 131 474 65 126 19 1 30 101 50 113 1 0
Max Kepler L 26 RF 147 516 74 127 31 5 20 70 61 107 6 4
Eddie Rosario L 27 LF 148 565 84 156 30 5 23 78 30 117 9 5
Willians Astudillo R 27 C 102 364 40 102 18 1 15 49 9 18 4 4
Jonathan Schoop R 27 2B 150 561 74 146 31 1 25 90 26 140 1 1
Byron Buxton R 25 CF 116 403 54 95 18 5 12 45 28 136 17 2
Miguel Sano R 26 3B 112 411 60 93 19 1 25 70 56 176 1 0
C.J. Cron R 29 1B 135 475 59 123 27 2 24 80 32 119 2 2
Logan Forsythe R 32 2B 121 401 51 98 20 1 8 39 51 102 4 2
Jorge Polanco B 25 SS 118 456 54 120 23 5 10 61 35 89 10 6
Nick Gordon L 23 SS 138 561 61 138 25 6 7 50 33 132 16 6
Jake Cave L 26 CF 132 486 67 120 23 4 17 63 37 160 5 3
Jason Castro L 32 C 89 280 32 58 14 1 7 28 35 99 0 0
Logan Morrison L 31 1B 113 374 50 87 17 1 20 59 47 98 3 1
Taylor Motter R 29 3B 110 384 47 88 21 1 13 48 36 90 13 6
Luis Arraez L 22 2B 119 455 49 122 19 4 4 37 27 60 3 4
Joe Mauer L 36 1B 121 459 56 124 25 2 6 47 52 85 1 1
Tyler Austin R 27 1B 109 385 51 89 21 2 21 64 35 144 3 2
Mitch Garver R 28 C 106 356 43 83 21 2 8 46 37 99 1 1
Lucas Duda L 33 1B 103 338 40 76 18 0 18 57 39 115 1 0
LaMonte Wade L 25 LF 113 424 54 104 14 3 9 41 51 86 8 3
Royce Lewis R 20 SS 118 481 57 112 21 3 12 50 32 109 19 8
Alex Kirilloff L 21 RF 128 511 62 138 30 3 17 68 27 110 3 3
Ehire Adrianza B 29 SS 106 296 36 72 16 1 5 34 23 66 5 2
Wynston Sawyer R 27 C 66 223 27 52 11 0 5 22 23 62 2 2
Dean Anna L 32 2B 115 412 49 100 16 2 2 31 41 65 5 5
Ronald Torreyes R 26 2B 91 273 28 72 13 2 1 21 12 36 1 1
Zach Granite L 26 CF 105 391 45 97 13 3 3 28 29 56 18 8
Brian Schales R 23 3B 129 438 49 98 20 3 9 47 44 128 3 3
Michael Reed R 26 CF 107 357 49 77 16 1 10 37 54 136 10 5
Tomas Telis B 28 C 104 346 40 90 14 2 4 35 20 45 3 2
Brian Navarreto R 24 C 98 348 30 72 15 0 4 25 12 76 0 1
Jermaine Curtis R 31 3B 67 223 27 49 9 0 3 18 27 54 3 1
Jeremy Hazelbaker L 31 CF 102 296 36 61 13 3 10 35 28 117 10 2
Jordan Gore B 24 SS 101 344 36 76 11 2 3 25 29 104 4 2
Brent Rooker R 24 1B 125 489 62 110 24 2 21 67 41 167 4 2
Leonardo Reginatto R 29 3B 93 329 31 76 13 1 3 26 18 76 4 4
Luke Raley L 24 1B 118 475 59 107 17 7 12 50 30 166 4 1
Drew Maggi R 30 2B 84 286 29 63 12 1 2 20 22 77 11 6
Wilin Rosario R 30 1B 114 419 50 104 22 1 16 63 23 104 5 3
Andy Wilkins L 30 1B 80 276 34 56 13 1 13 40 27 96 2 0
Randy Cesar R 24 3B 115 449 46 106 18 1 7 40 27 144 2 2
Jordany Valdespin L 31 2B 68 227 25 55 9 2 3 19 16 43 7 4
Adam Rosales R 36 2B 117 324 36 67 15 1 9 36 24 100 2 3
Mike Olt R 30 3B 84 290 33 56 12 0 10 31 32 117 0 0
Jaylin Davis R 24 RF 118 445 47 93 18 2 12 45 30 169 6 3
Zander Wiel R 26 1B 122 469 52 103 22 3 12 51 38 134 5 2
Edgar Corcino B 27 RF 105 394 41 94 17 3 7 37 26 94 3 2
Jordan Pacheco R 33 C 58 147 12 29 6 0 1 9 10 33 0 0


Batters – Rate Stats
Player PA BA OBP SLG OPS+ ISO BABIP RC/27 Def WAR No. 1 Comp
Nelson Cruz 540 .266 .348 .500 127 .234 .290 6.4 0 2.6 Joe Adcock
Max Kepler 586 .246 .328 .442 107 .196 .275 5.2 6 2.2 Robin Jennings
Eddie Rosario 602 .276 .310 .469 108 .193 .313 5.4 7 2.2 Rondell White
Willians Astudillo 385 .280 .307 .459 104 .179 .263 5.2 3 2.0 Bengie Molina
Jonathan Schoop 601 .260 .300 .453 101 .193 .306 4.9 0 2.0 Kevin Kouzmanoff
Byron Buxton 440 .236 .291 .395 84 .159 .325 4.4 11 1.9 Reggie Sanders
Miguel Sano 471 .226 .321 .460 109 .234 .324 5.2 -3 1.7 Mark Reynolds
C.J. Cron 523 .259 .317 .476 111 .217 .298 5.5 0 1.5 Larry Sheets
Logan Forsythe 461 .244 .336 .359 90 .115 .309 4.3 1 1.2 Dick Green
Jorge Polanco 501 .263 .316 .401 93 .138 .308 4.6 -4 1.1 Kurt Stillwell
Nick Gordon 603 .246 .292 .349 74 .103 .310 3.7 6 1.0 Carlos Garcia
Jake Cave 533 .247 .303 .416 93 .169 .333 4.5 -2 1.0 LaVel Freeman
Jason Castro 319 .207 .299 .339 73 .132 .293 3.5 6 1.0 Jerry Goff
Logan Morrison 428 .233 .325 .444 106 .211 .262 5.1 -1 1.0 Carmelo Martinez
Taylor Motter 425 .229 .296 .391 85 .161 .267 4.1 3 0.9 Tom Brookens
Luis Arraez 493 .268 .309 .354 80 .086 .302 3.9 5 0.8 Martin Prado
Joe Mauer 517 .270 .345 .373 96 .102 .321 4.7 3 0.8 Mike Hargrove
Tyler Austin 426 .231 .298 .460 102 .229 .309 4.8 0 0.7 Jason Dubois
Mitch Garver 398 .233 .307 .371 83 .138 .301 4.0 -2 0.7 Chad Moeller
Lucas Duda 387 .225 .315 .438 102 .213 .283 4.8 0 0.7 Graham Koonce
LaMonte Wade 486 .245 .330 .356 87 .111 .289 4.3 2 0.5 Trevor Penn
Royce Lewis 522 .233 .286 .364 75 .131 .278 3.7 0 0.5 Asdrubal Cabrera
Alex Kirilloff 545 .270 .306 .440 100 .170 .315 4.9 -5 0.4 Jose Guillen
Ehire Adrianza 328 .243 .299 .355 77 .111 .298 3.8 -1 0.3 Doug Strange
Wynston Sawyer 253 .233 .316 .350 81 .117 .301 3.8 -3 0.2 Bob Henley
Dean Anna 468 .243 .320 .306 72 .063 .284 3.4 2 0.2 Don Blasingame
Ronald Torreyes 291 .264 .294 .337 71 .073 .301 3.6 3 0.2 Mario Diaz
Zach Granite 428 .248 .302 .320 70 .072 .283 3.5 3 0.1 Leo Garcia
Brian Schales 491 .224 .300 .345 75 .121 .296 3.5 0 0.1 Pedro Castellano
Michael Reed 417 .216 .321 .350 83 .134 .318 3.9 -6 0.0 Todd Self
Tomas Telis 373 .260 .305 .347 77 .087 .290 3.8 -4 0.0 Kirt Manwaring
Brian Navarreto 368 .207 .243 .284 43 .078 .254 2.3 11 0.0 Alex Sutherland
Jermaine Curtis 261 .220 .323 .300 72 .081 .277 3.4 -1 -0.1 Rico Rossy
Jeremy Hazelbaker 328 .206 .278 .372 75 .166 .302 3.7 -2 -0.1 Dewayne Wise
Jordan Gore 380 .221 .281 .291 56 .070 .308 2.8 3 -0.2 Adam Haley
Brent Rooker 537 .225 .291 .411 88 .186 .296 4.2 -4 -0.4 Kevin Eberwein
Leonardo Reginatto 356 .231 .275 .304 58 .073 .292 2.8 4 -0.4 Steve Sisco
Luke Raley 525 .225 .291 .366 77 .141 .320 3.8 1 -0.4 Otis Green
Drew Maggi 316 .220 .284 .290 57 .070 .295 2.8 1 -0.5 Ray Holbert
Wilin Rosario 451 .248 .295 .420 91 .172 .294 4.4 -6 -0.5 Tom Nevers
Andy Wilkins 308 .203 .276 .399 80 .196 .257 3.8 -2 -0.5 Jay Gainer
Randy Cesar 480 .236 .279 .327 64 .091 .332 3.2 1 -0.5 Jack Hannahan
Jordany Valdespin 249 .242 .300 .339 74 .097 .287 3.6 -7 -0.6 Luis Maza
Adam Rosales 357 .207 .265 .343 64 .136 .270 3.0 -1 -0.7 Shane Halter
Mike Olt 327 .193 .276 .338 66 .145 .282 3.1 -4 -0.7 Jose Santos
Jaylin Davis 483 .209 .266 .339 63 .130 .307 3.1 4 -0.9 Daniel Carte
Zander Wiel 516 .220 .283 .356 72 .136 .282 3.5 0 -1.0 Brian Turner
Edgar Corcino 426 .239 .287 .350 72 .112 .297 3.5 -3 -1.0 Ed Yacopino
Jordan Pacheco 161 .197 .255 .259 41 .061 .248 2.2 -6 -1.0 Chad Moeller


Pitchers – Counting Stats
Player T Age W L ERA G GS IP H ER HR BB SO
Jose Berrios R 25 14 10 3.93 32 32 183.3 169 80 22 59 181
Kyle Gibson R 31 11 10 4.48 29 29 170.7 178 85 22 65 135
Jake Odorizzi R 29 9 8 4.45 30 30 153.7 148 76 22 59 136
Zack Littell R 23 9 8 4.57 30 22 141.7 152 72 17 53 109
Martin Perez L 28 8 7 4.58 26 22 129.7 144 66 13 45 79
Fernando Romero R 24 8 7 4.64 25 22 132.0 143 68 16 47 91
Ervin Santana R 36 7 7 4.61 21 21 121.0 124 62 19 36 90
Lewis Thorpe L 23 7 7 4.67 24 23 113.7 119 59 17 42 102
Taylor Rogers L 28 3 2 3.22 70 0 67.0 61 24 5 19 63
Kohl Stewart R 24 6 6 4.80 27 22 131.3 142 70 14 58 86
Adalberto Mejia L 26 6 6 4.41 22 20 100.0 106 49 12 35 77
Stephen Gonsalves L 24 9 9 4.84 28 24 124.7 126 67 13 72 104
Michael Pineda R 30 5 4 4.50 15 15 80.0 88 40 12 21 72
Devin Smeltzer L 23 6 6 4.78 31 17 107.3 124 57 17 28 79
Andrew Vasquez L 25 3 2 3.68 46 1 66.0 57 27 6 31 76
D.J. Baxendale R 28 3 3 4.63 32 11 79.7 89 41 10 24 52
Gabriel Moya L 24 3 3 4.23 64 8 76.7 74 36 10 27 71
Sean Poppen R 25 7 7 4.95 25 21 116.3 130 64 16 42 80
Trevor Hildenberger R 28 5 4 4.00 65 0 69.7 69 31 9 19 64
Cody Stashak R 25 3 3 4.76 30 9 73.7 78 39 11 25 60
Blake Parker R 34 2 1 3.88 61 0 58.0 53 25 8 20 62
Addison Reed R 30 4 3 3.94 63 0 61.7 64 27 7 16 50
Trevor May R 29 3 2 3.86 49 0 44.3 41 19 5 19 48
Tyler Duffey R 28 5 5 4.31 57 1 79.3 82 38 10 23 68
Ryne Harper R 30 3 3 3.95 37 0 57.0 56 25 7 17 55
Randy LeBlanc R 27 6 6 5.18 19 14 83.3 95 48 10 31 47
Tyler Wells R 24 7 8 5.29 22 21 102.0 110 60 18 39 83
Mike Morin R 28 3 3 4.37 48 2 57.7 62 28 7 15 45
Justin Nicolino L 27 6 8 5.26 27 24 131.7 164 77 22 39 71
Adam Bray R 26 3 3 5.03 24 9 77.0 93 43 15 18 55
Kevin Comer R 26 3 3 4.58 47 1 57.0 59 29 7 27 50
Matt Belisle R 39 1 1 4.40 43 0 45.0 47 22 6 12 34
Alan Busenitz R 28 4 4 4.79 49 2 67.7 73 36 10 24 56
Jake Reed R 26 2 2 4.74 36 1 49.3 49 26 6 24 41
Preston Guilmet R 31 1 1 4.66 36 1 46.3 48 24 8 13 43
Ryan Eades R 27 4 4 5.38 31 10 80.3 88 48 12 34 59
Dario Alvarez L 30 2 2 4.58 38 0 37.3 36 19 5 21 39
Austin D. Adams R 32 2 2 4.91 30 1 33.0 35 18 4 17 27
Dan Camarena L 26 6 8 5.62 24 23 117.0 140 73 20 46 74
Luke Bard R 28 3 3 4.73 40 0 59.0 60 31 8 27 54
Jorge Alcala R 23 6 8 5.62 24 17 91.3 99 57 14 59 71
Chris Gimenez R 36 0 0 9.00 4 0 4.0 6 4 2 0 1
Pat Dean L 30 5 7 5.76 18 15 89.0 115 57 15 25 41
Dusten Knight R 28 3 3 5.02 35 1 57.3 62 32 10 24 49
Matt Magill R 29 3 3 4.94 45 0 58.3 59 32 10 28 56
Tim Collins L 29 3 3 5.24 59 0 44.7 45 26 6 29 42
Chase De Jong R 25 7 9 5.76 29 27 148.3 178 95 29 53 89
Tyler Jay L 25 5 6 5.66 34 8 76.3 90 48 13 31 46
Zack Weiss R 27 3 4 5.54 33 1 37.3 39 23 7 22 35
Jeff Ames R 28 2 3 6.17 38 1 46.7 48 32 9 36 47


Pitchers – Rate Stats
Player TBF K/9 BB/9 HR/9 BABIP ERA+ ERA- FIP WAR No. 1 Comp
Jose Berrios 778 8.89 2.90 1.08 .292 111 90 3.91 3.2 Jack Morris
Kyle Gibson 747 7.12 3.43 1.16 .300 98 103 4.47 2.0 Omar Olivares
Jake Odorizzi 661 7.97 3.46 1.29 .286 98 102 4.47 1.9 Roger Bailey
Zack Littell 628 6.92 3.37 1.08 .307 96 105 4.48 1.5 Aaron Cook
Martin Perez 570 5.48 3.12 0.90 .305 95 105 4.35 1.4 Jim O’Toole
Fernando Romero 586 6.20 3.20 1.09 .301 94 106 4.64 1.3 Cha-Seung Baek
Ervin Santana 519 6.69 2.68 1.41 .285 95 105 4.72 1.3 Bob Forsch
Lewis Thorpe 500 8.08 3.33 1.35 .306 94 107 4.57 1.1 Danny Borrell
Taylor Rogers 279 8.46 2.55 0.67 .296 136 74 3.22 1.1 Sparky Lyle
Kohl Stewart 592 5.89 3.97 0.96 .300 91 110 4.73 1.1 Rick Berg
Adalberto Mejia 438 6.93 3.15 1.08 .304 96 104 4.37 1.1 Scott Sauerbeck
Stephen Gonsalves 569 7.51 5.20 0.94 .302 90 111 4.71 1.0 Jimmy Anderson
Michael Pineda 345 8.10 2.36 1.35 .319 97 103 4.16 1.0 Brian Tollberg
Devin Smeltzer 472 6.62 2.35 1.43 .313 91 109 4.69 0.8 Kevin Pickford
Andrew Vasquez 287 10.36 4.23 0.82 .302 119 84 3.67 0.8 Buzz Oliver
D.J. Baxendale 350 5.87 2.71 1.13 .304 94 106 4.53 0.6 Bill Fischer
Gabriel Moya 329 8.33 3.17 1.17 .294 100 100 4.17 0.6 Pat Clements
Sean Poppen 519 6.19 3.25 1.24 .305 86 117 4.83 0.6 Michael Macdonald
Trevor Hildenberger 296 8.27 2.45 1.16 .300 109 92 3.98 0.5 Jeff Tam
Cody Stashak 323 7.33 3.05 1.34 .300 92 109 4.64 0.5 Steve Parris
Blake Parker 246 9.62 3.10 1.24 .294 109 92 3.99 0.4 Steve Reed
Addison Reed 261 7.30 2.34 1.02 .305 107 93 3.83 0.4 Kent Tekulve
Trevor May 192 9.74 3.86 1.02 .305 113 88 3.87 0.4 Jason Bulger
Tyler Duffey 340 7.71 2.61 1.13 .305 101 99 4.06 0.4 Jose Santiago
Ryne Harper 243 8.68 2.68 1.11 .304 107 93 3.87 0.3 Terry Leach
Randy LeBlanc 374 5.08 3.35 1.08 .302 84 119 4.88 0.3 Brian Allard
Tyler Wells 453 7.32 3.44 1.59 .300 83 121 5.14 0.3 Carlos Crawford
Mike Morin 249 7.02 2.34 1.09 .307 100 100 4.10 0.3 Bill Fischer
Justin Nicolino 593 4.85 2.67 1.50 .312 80 124 5.27 0.2 Wade Blasingame
Adam Bray 341 6.43 2.10 1.75 .315 84 119 5.15 0.2 Dick Marlowe
Kevin Comer 256 7.89 4.26 1.11 .308 95 105 4.57 0.1 Mike Gardner
Matt Belisle 193 6.80 2.40 1.20 .295 96 104 4.31 0.0 Boom-Boom Beck
Alan Busenitz 298 7.45 3.19 1.33 .307 91 110 4.61 0.0 Rob Marquez
Jake Reed 219 7.48 4.38 1.09 .295 92 108 4.65 0.0 Ken Wright
Preston Guilmet 199 8.35 2.53 1.55 .301 91 110 4.51 0.0 Dan Giese
Ryan Eades 362 6.61 3.81 1.34 .302 81 123 5.08 0.0 Preston Larrison
Dario Alvarez 169 9.40 5.06 1.21 .304 92 108 4.65 0.0 Arnold Earley
Austin D. Adams 150 7.36 4.64 1.09 .307 89 112 4.73 0.0 Jerry Johnson
Dan Camarena 534 5.69 3.54 1.54 .309 78 128 5.44 0.0 Rich Rundles
Luke Bard 264 8.24 4.12 1.22 .304 92 108 4.66 -0.1 Sean Green
Jorge Alcala 430 7.00 5.81 1.38 .302 78 128 5.69 -0.1 Edwin Morel
Chris Gimenez 18 2.25 0.00 4.50 .267 49 206 9.15 -0.2 John Gardner
Pat Dean 402 4.15 2.53 1.52 .314 76 132 5.36 -0.2 Dave Gassner
Dusten Knight 257 7.69 3.77 1.57 .304 84 119 5.12 -0.2 John Koronka
Matt Magill 261 8.64 4.32 1.54 .299 86 117 5.05 -0.3 Kevin Gryboski
Tim Collins 207 8.46 5.84 1.21 .305 83 120 5.10 -0.3 Arnold Earley
Chase De Jong 671 5.40 3.22 1.76 .302 76 132 5.71 -0.3 Mark Ratekin
Tyler Jay 350 5.42 3.66 1.53 .303 77 129 5.61 -0.3 Wade Blasingame
Zack Weiss 172 8.44 5.30 1.69 .302 76 131 5.64 -0.4 Ryan Baker
Jeff Ames 224 9.06 6.94 1.74 .302 71 141 6.15 -0.7 Bart Evans


Disclaimer: ZiPS projections are computer-based projections of performance. Performances have not been allocated to predicted playing time in the majors — many of the players listed above are unlikely to play in the majors at all in 2019. ZiPS is projecting equivalent production — a .240 ZiPS projection may end up being .280 in AAA or .300 in AA, for example. Whether or not a player will play is one of many non-statistical factors one has to take into account when predicting the future.

Players are listed with their most recent teams, unless I have made a mistake. This is very possible, as a lot of minor-league signings go generally unreported in the offseason.

ZiPS’ projections are based on the American League having a 4.29 ERA and the National League having a 4.15 ERA.

Players who are expected to be out due to injury are still projected. More information is always better than less information, and a computer isn’t the tool that should project the injury status of, for example, a pitcher who has had Tommy John surgery.

Both hitters and pitchers are ranked by projected zWAR — which is to say, WAR values as calculated by me, Dan Szymborski, whose surname is spelled with a z. WAR values might differ slightly from those which appear in full release of ZiPS. Finally, I will advise anyone against — and might karate chop anyone guilty of — merely adding up WAR totals on a depth chart to produce projected team WAR.


Milwaukee Brings Back the Moose

Free agency was supposed to be different for Mike Moustakas this time around. Last winter, coming off his second All-Star appearance and a career-high 38 home runs, the longtime Royals third baseman turned down a $17.4 million qualifying offer in anticipation of a multiyear contract, only to receive a frosty reception on the open market. Ultimately, he made a belated return to Kansas City on a one-year deal, was traded to the contending Brewers in late July, and hit free agency again this fall — this time without a qualifying offer and associated draft pick compensation. Yet once again, he only landed a considerably discounted one-year contract. He’ll return to the Brewers on a $10 million deal that includes a mutual option for 2020.

Moustakas, who turned 30 on September 11, hit a combined .251/.315/.459 with 28 homers, a 105 wRC+, and 2.4 WAR in 2018. His offense wasn’t quite what it was in 2017 (.272/.314/.521, 114 wRC+) but his defense improved significantly in terms of both DRS (from -8 in 2017 to 2 in 2018) and UZR (from -4.5 to 1.0). Given that he was finally more than a year removed from the right ACL tear that limited him to 27 games in 2016, that shouldn’t be tremendously surprising; according to Statcast, his average sprint speed also increased substantially, from 24.0 feet per second to 25.7, though even that puts him somewhere around the 15th percentile of major league regulars.

Moustakas’ defensive rebound helped offset his slight offensive downturn; his overall WAR was a bit ahead of his 2.1 from 2017, if still shy of his career-best 3.8 in 2015. He’s not what you’d call the most disciplined hitter; his 37.0% rate of swinging at pitches outside the zone places him in the 15th percentile among qualifiers, while his 7.7% walk rate puts him in the 35th percentile. He doesn’t strike out much (16.2%, 72nd percentile), but even so, 2018 saw his highest K rate since 2012, his first full major league season. A pull-happy hitter, he had 372 plate appearances against a traditional shift, the majors’ third-highest total. He hit for just a .243 average with a .311 slugging percentage and a 43 wRC+ in those plate appearances, which is 14th percentile stuff. Combine that with his non-blazing speed and you get a .259 BABIP, the majors’ 15th lowest among qualified hitters.

Read the rest of this entry »


Taylor Williams on His Undersized (and Interrupted) Path to Milwaukee

Taylor Williams is a tad shorter than the 5-foot-11 he’s listed at in the Milwaukee media guide. But as the saying goes, size doesn’t matter. His fastball averaged 96.1 mph, and ticked up even higher, in his 2018 rookie season. More importantly, he consistently recorded outs. In 56 appearances out of the Brewers bullpen, Williams fanned 57 batters in 53 innings, and fashioned a 3.95 FIP. All in all, it was a successful campaign for the 27-year-old right-hander who hails from Camas, Washington.

He faced a speed bump on his way to Beer City. Seemingly on the fast track after a stellar first-full professional season, the 2013 fourth round pick suddenly began feeling elbow discomfort. Rest didn’t help, nor did a platelet-rich plasma injection. He underwent Tommy John surgery and missed all of the 2015 and 2016 seasons.

He barely missed a beat after returning to action. Williams pitched well enough at Double-A Biloxi to earn a five-game cameo with the Brewers in September 2017. Then came last season’s further step forward, which portends a continuation of what could arguably be called a David-slays-Goliath career.

The undersized — but by no means underperforming — hurler discussed his path to the big leagues midway through last summer.

———

Williams on being drafted out of Kent State: “I was originally at Washington State, but decided that I didn’t want to go back. This was after after my freshman year. I transferred to Mount Hood Community College, in Oregon, in part because I didn’t want to have to sit out a season. I finished my associates degree at Mount Hood, then transferred to Kent State.

“I’d played summer ball with some Kent State guys after my freshman year. That was up in the New England Collegiate Baseball League. The team I was with played out of Keene, New Hampshire. The NECBL is a good league. Our All-Star team actually beat Team USA that year. Read the rest of this entry »


Sunday Notes: Cincinnati’s New Coaches Don’t Have a Billy Hamilton Conundrum

The Cincinnati Reds did more than hire a new manager over the offseason. They also revamped their coaching staff. Two of the additions will be entrusted with optimizing the offense. Turner Ward, formerly with the Dodgers, is now the hitting coach. Donnie Ecker, who came over from the Angels, will serve as the assistant hitting coach. Neither will be faced with the challenge of helping Billy Hamilton turn a corner. The Reds non-tendered the enigmatic speedster, who subsequently signed with the Royals, back in November.

I recently asked Dick Williams about the decision to cut ties with Hamilton, who slashed .245/.298/.333 in his five seasons as Cincinnati’s centerfielder. Before we get to that, here is the team’s President of Baseball Operations on Ecker:

We’ve had some really interesting sessions the last couple of days, where coaches have gotten up and talked about their areas. Donnie Ecker is a movement specialist. He has a bio-mechanical approach to the swing. We had some great hitters in the room, like Barry Larkin and Eric Davis. Donnie gave a bio-mechanical explanation of some of the things he sees in hitters, using descriptions and examples that all of us could understand.

Would Ecker, along with Ward, have been able to transform Hamilton into the productive hitter he’s thus far failed to become? Read the rest of this entry »