Liam Hicks is on the receiving end of some serious heat in Miami. Selected second overall by the Marlins in last winter’s Rule-5 draft, the 26-year-old backstop is catching the likes of Sandy Alcantara, Edward Cabrera, and Eury Pérez. Power arms aren’t new to him. Hicks caught Jackson Jobe in Double-A Erie last summer after joining the Detroit Tigers organization in the trade deadline deal that sent Carson Kelly to the Texas Rangers.
Who among the pitchers on the Marlins staff is most comparable to a healthy Jobe (the 23-year-old right-hander had Tommy John surgery in mid-June after making 10 starts for the Tigers and going 4-1 with a 4.22 ERA)? I asked that question of Hicks prior to a recent game.
“Comps are tough, but I would probably say the closest is Edward Cabrera,” replied Hicks, who is currently sharing catching duties with fellow rookie Agustín Ramírez. “Jobe had five different pitches he could throw [the same number the Marlins righty has in his repertoire].Their four-seams are pretty similar, although Jobe has a little bit lower slot and gets a little more ride, whereas Cabby’s is more just at the top of the zone. Cabby has a two-seam. Jobe wasn’t throwing a two-seam last year.
“Their changeups are very different,” added Hicks. “Cabby’s is more like a power changeup — it’s 94-95 [mph] — while Jobe’s had a lot bigger separation from his fastball. It was almost screwball-ish. Again, it’s hard to compare guys, but [Jobe] definitely had electric stuff.”
Cabrera’s stuff is likewise electric. Featuring a heater that is averaging 96.7 MPH this season, he has a 3.34 ERA and a 3.56 FIP over 21 starts comprising 113-and-a-third innings.
Hicks also caught Troy Melton in his month-plus with Erie. Called up to make his debut for the Tigers three weeks ago, the 24-year-old righty has a 2.82 ERA and 21 strikeouts over his first 22-and-a-third big-league innings. Melton has a six-pitch mix, including a heater that’s been averaging 96.5 mph.
Hicks couldn’t come up with a comp for Melton, but he certainly came away impressed with the arsenal.
“I like Troy a lot,” Hicks said of his short-time teammate. “I actually texted him a few days ago after I saw that he shoved against the White Sox. He’s got a really good fastball, as well as a really good changeup. Troy is another guy who has good secondaries that he can land. When you can also throw 97-98, it makes it pretty tough for hitters.”
As for the pitchers whose stuff most stands out, Hicks cited three of his current teammates.
“Cabby and Sandy are up there,” the Toronto native told me. “Eury, of course. His fastball is probably the best I’ve ever caught. It’s 98, and he’s also got seven feet of extension. It looks like he’s handing the ball to you.”
———
RANDOM HITTER-PITCHER MATCHUPS
Chris Getz went 9 for 15 against Jeremy Guthrie.
Paul Janish went 5 for 6 against Ted Lilly.
Josh Barfield went 5 for 6 against Gary Majewski.
Phil Nevin went 5 for 6 against Chris Holt.
Carlos Quentin went 7 for 15 against Brian Bannister.
———
How similar are Cincinnati Reds southpaws Andrew Abbott and Nick Lodolo?
“We’re a little similar pitch-wise, but our shapes are completely different,” Lodolo told me in early July. “Andrew has more carry than me, as he’s got a true four and I throw a two-seam sinker. We kind of throw the same breaking ball, although they’re from different arm slots — he’s more over the top than I am. He’s throwing a changeup more this year, but I don’t know if those are even close to mine.”
Even with their differences, the southpaws discuss how to go about attacking opposing hitters.
“He pitches in front of me, so I’m definitely going to pick his brain about what he saw,” said Lodolo. “But at the end of the day, our plans are going to be different. We’re going to attack guys a little bit differently, although with some guys it may be close to the same. But yeah, we have those conversations for sure.”
———
While starting pitchers routinely throw a bullpen session between starts, that’s rarely the case for relievers. Much for that reason, I was surprised to see a sweaty Brent Suter strolling in from the visiting bullpen prior to an afternoon affair at Fenway Park. What had the 35-year-old Cincinnati Reds hurler been up to?
“Since April 2018, I’ve been doing dry visualizations,” Suter told me. “It’s kind of a mental and physical sensation of getting on the mound and doing my resets. I get the catcher down, giving a target for a common pitch that I throw, and then go through little dry-work throws. It’s not full arm action. I’m basically working on conviction, belief, and intensity with my visualization, getting the ball where I want it. I do this every day.”
The veteran of 10 big-league seasons went on to explain that if he hasn’t pitched in the previous three days, he will do “actual throws on that fourth day.”
The Harvard alum has other routines as well, and they go beyond studying scouting reports. On the first day of a series, Suter does “core activation,” while day two is “a total body lift,” and day three is “mobility/soft-tissue mobilization.” Moreover, he does “meditation/visualization” for 10 or 15 minutes on a daily basis. About 20 minutes before each game, Suter showers, then has Atomic Balm applied to his pitching arm, at which point he is “ready to rock.”
———
A quiz:
Henry Aaron is the Boston/Milwaukee/Atlanta franchise’s all-time leader in home runs. Who ranks second?
———
NEWS NOTES
Roki Sasaki made a rehab start on Thursday with the Triple-A Oklahoma City Comets. In his first game action since May 9, the Los Angeles Dodgers right-hander allowed six hits and three runs over two innings, with one walk and no strikeouts. He threw 41 pitches and reportedly topped out at 95.7 mph.
Bill Hepler, a left-hander who appeared in 37 games for the New York Mets in 1966, died earlier this week at age 79. Just 20 years old when he made his MLB debut, the Covington, Virginia native went 3-3 with a 3.52 ERA over 69 innings.
———
The answer to the quiz is Eddie Mathews, who hit 493 of his 503 career home runs with the Braves (the Hall of Famer did so playing in all of Boston, Milwaukee, and Atlanta). Chipper Jones ranks third in franchise history with 468 home runs.
———
Kansas City Royals manager Matt Quatraro was effusive in his praise when asked recently about Maikel Garcia. That’s understandable. The 25-year-old third sacker earned an All-Star berth this summer amid a breakout campaign.
“He’s grown up in front of our eyes.,” Quatraro told reporters prior to a recent game. “Off the field. Maturity level. Strength: he’s put on a good amount of muscle this year. He’s really worked on his swing, keeping his body in better control, so he’s hitting pitches that last year he was fouling off. He’s using the whole field. Defensively, he’s put in a lot of work on his range and his first-step quickness. We’ve seen a lot of growth.”
Garcia is slashing .301/.364/.467 with 11 home runs, 22 steals, and a 128 wRC+. Moreover, his 4.2 WAR is sixth-best among American League position players, while his nine Outs Above Average ranks first at his position. Overshadowed by Bobby Witt Jr. in small-market Kansas City, Garcia is emerging as a big-time performer.
———
When our Bold Predictions For the 2025 Season were published in late March, I wrote that Ceddanne Rafaela would win a Gold Glove, record a wRC+ of 110 or better, and be worth 4.0 or more WAR. My optimism was based in part on how Rafaela would be “unburdened by having to move between the infield and the outfield.”
Boston manager Alex Cora is doing his best to foil my prediction.
Through July 11, Rafaela had played all but one of his 90 games in center field and boasted a 114 wRC+ and 3.0 WAR. Since July 12, Rafaela has had little stability, starting 15 games in center and 13 games at second base. Moreover, he’s had a 44 wRC+ and 0.0 WAR.
On the season, Rafaela has 16 Defensive Runs Saved as a centerfielder, and minus-one DRS as a second baseman. At the plate, he is slashing .257/.318/.483 in 377 plate appearances as a centerfielder, and .143/.182/.159 in 66 plate appearances as a second baseman.
Cora claims there is no correlation. Color me skeptical. Comfortability taken out of the equation has clearly done Rafaela no favors.
———
FOREIGN AFFAIRS
Cody Ponce now has a record of 15-0, as well as a 1.61 ERA, a 1.93 FIP, and a 36.8% strikeout rate over 145-and-two-thirds innings for the Hanwha Eagles. The 31-year-old former Pittsburgh Pirates right-hander leads KBO pitchers in most categories.
Teruaki Sato leads the pitcher-friendly NPB in doubles (26) and home runs (31). The 26-year-old Hanshin Tigers third baseman/outfielder has gone deep eight more times than Hokkaido Nippon Ham Fighters DH Franmil Reyes, who has the circuit’s second-highest dinger total.
Miles Simington slashed .332/.385/.517 over 291 plate appearances while playing for three teams in the Mexican League, primarily the Tigres de Quintana Roo. The 25-year-old former Purdue Boilermakers outfielder spent last year with the independent American Association’s Winnipeg Goldeyes, as well as the Australian Baseball League’s Canberra Cavalry.
The ABL’s Brisbane Bandits announced that 18-year-old second baseman/outfielder Max Durrington will be back with the team for the 2025-2026 season. The Tweeds Head, New South Wales native — and son of former big-league infielder Trent Durrington — has spent this summer in the [don’t call us Sacramento) Athletic system, logging an 86 wRC+ between the Arizona Complex League and Low-A Stockton.
———
A random obscure former player snapshot:
Fans of a certain age will remember Steve Renko. The tall right-hander logged 134 wins and a 3.99 ERA over 2,494 innings while playing for seven teams from 1969-1983. Renko’s rookie season was spent with the Montreal Expos in the expansion club’s inaugural campaign, and he went on to have his best years with the Quebec-based club. In 1971, he went 15-14 with a 3.75 ERA, and in 1973 he went 15-11 with a 2.81 ERA. Prior to pro ball, Renko played baseball, basketball, and football at the University of Kansas, where as a quarterback he shared a backfield with Hall of Fame running back Gale Sayers.
———
On April 16, 2023, Sunday Notes led with my addressing the question, “Are Kenley Jansen and/or Craig Kimbrel Cooperstown Bound?” Sixteen months later, I’ve more or less come to a decision on the former. While Kimbrel remains a question mark, I am increasingly of the opinion that Jansen is having a Hall of Fame-worthy career.
Still going strong at age 37, Jansen now ranks fourth all-time with 470 saves, and he is poised to shortly move past Lee Smith (478) into third place. Moreover, Jansen ranks 21st all time with 920 appearances, and he is fourth in strikeout rate — right in front of Billy Wagner — among relievers who have thrown at least 500 innings (Josh Hader, Aroldis Chapman, and Kimbrel top the list).
Wagner is a meaningful comp, given the his recent induction. Jansen not only has the edge in saves and strikeout rate, he also has more WAR, WPA, and innings pitched. He also boasts a better FIP.
The belief that relievers — even closers — don’t belong in the Hall of Fame isn’t without merit. That said, if relievers do deserve the honor, Jansen has numbers on his side. They include 23 saves and a 2.74 ERA with the Los Angeles Angels so far this season.
———
FARM NOTES
Nate George is slashing .345/.420/.502 with four home runs and a 166 wRC+ over 292 plate appearances between the Florida Complex League and Low-A Delmarva (and briefly) High-A Aberdeen. Drafted in the 16th round last year out of Minooka (Illinois) Community High School, the 19-year-old outfielder is No. 39 on our updated Baltimore Orioles Top Prospects list, with a 40 FV.
Yorman Gómez is 11-0 with a 2.62 ERA, a 2.91 FIP, and a 27.3% strikeout rate over 99-and-two-thirds innings between High-A Lake County and Double-A Akron. A native of Coro, Venezuela who was signed in July 2019, the 22-year-old right-hander is No. 38 on our updated Cleveland Guardians Top Prospects list, with a 40 FV.
Griffin Herring is 7-3 with a 1.79 ERA, a 2.76 FIP, and a 29.9% strikeout rate over 100-and-a-third innings between Low-A Tampa and a pair of High-A affiliates. Acquired by Colorado from the New York Yankees as part of the Ryan McMahon trade, the 22-year-old left-hander — a 2024 sixth-round pick out of LSU — is No. 21 on our our updated Rockies Top Prospects list, with a 40 FV.
Kendry Chourio has a 30.7% strikeout rate and a 1.2% walk rate to go with a 3.05 ERA and a 2.72 FIP over 41-and-a-third innings across the Arizona Complex League, the Dominican Summer League, and Low-A Columbia. The 17-year-old right-hander was signed out of Venezuela by the Kansas City Royals in January.
———
These back-to-back passages in Jane Leavy’s new book, Make Me Commissioner (I Know What’s Wrong With Baseball and How To Fix It) caught my eye:
“[Jim] Palmer threw the first of his 211 complete games at Fenway Park in April 1966. He threw 177 pitches that day and hit a home run too. After the game, someone said to Orioles pitching coach Harry Brecheen, ‘Harry, that’s a lot of pitches,’ Palmer recalled. ‘Harry says, ‘Yeah, we wanna get that pitch count down into the 140s.’
“He missed most of the 1967 season and all of 1968 because of shoulder surgery, The Orioles left him unprotected in the 1968 expansion draft. The Kansas City Royals and Seattle Pilots passed on him.”
Palmer went 16-4 for the Orioles in 1969, then won 20 more games in eight of the next nine seasons. The Hall of Famer won four Cy Young awards.
And then there is this passage, regarding a managerial moment from Buck Showalter’s time with the New York Mets.
“When a valued relief pitcher, Trevor May, melted down over the death of his cat and couldn’t pitch for three days — that was in Buck’s portfolio. “I couldn’t tell the media that. So, I had to wear it. ‘Why didn’t you use Trevor May?’ Was I supposed to say because his cat died?”
———
LINKS YOU’LL LIKE
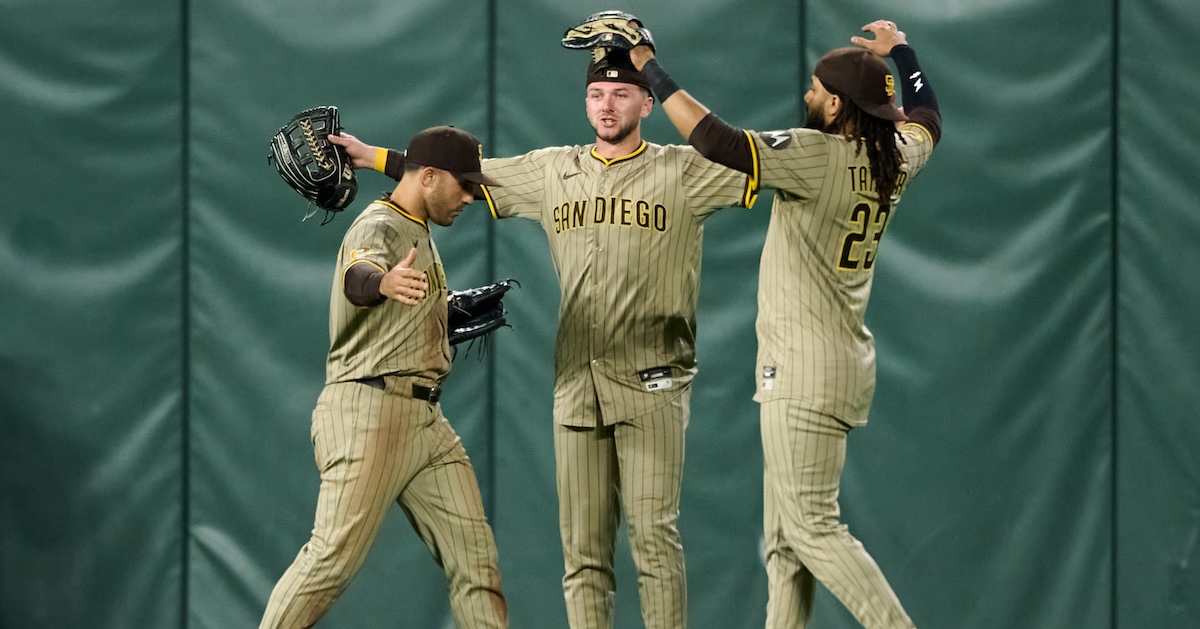
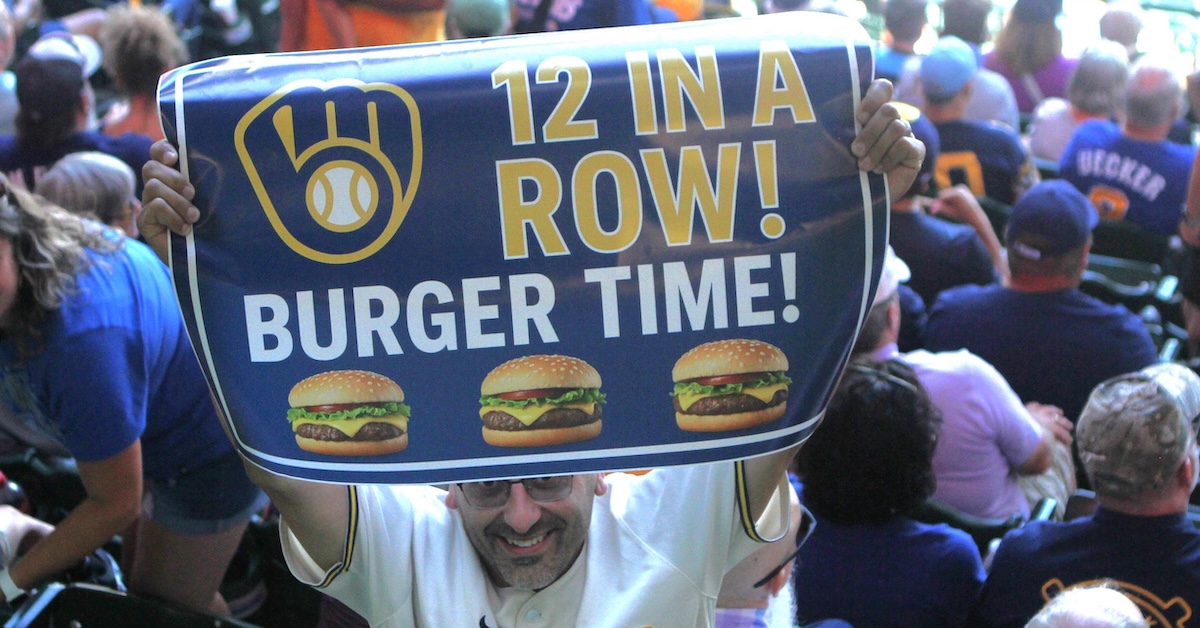
Baseball America has released its midseason farm system rankings, which have the Milwaukee Brewers on top and the San Diego Padres on the bottom.
Why do the small-market Milwaukee Brewers win, and the small-market Pittsburgh Pirates lose? Pittsburgh Baseball Now’s John Perrotto talked to Brewers president of baseball operations Matt Arnold in an effort to find out.
The Athletic’s Aaron Gleeman wrote about how the Pohlad family’s pulling the Minnesota Twins off the market is a crushing blow to a fanbase that deserves better.
At NPR’s Morning Edition, Becky Sullivan delved into who is still trying to be an MLB umpire in an age of replay review and robot umps.
Unlike MLB, Little League Baseball wants nothing to do with gambling. Scooby Axson has the story at USA Today.
———
RANDOM FACTS AND STATS
The Detroit Tigers are 19-8 in one-run games this season. They are 7-1 in one-run games since the beginning of July.
The Boston Red Sox have 10 walk-off wins and 11 walk-off losses. The Baltimore Orioles have one walk-off win and three-walk-off losses.
In 2007, Greg Maddux allowed 221 hits and issued 25 walks. In 1975, Nolan Ryan allowed 221 hits and issued 202 walks.
Texas Rangers president of baseball operations Chris Young went 2-0 with a 2.02 ERA over five postseason appearances. The right-hander pitched three hitless and scoreless innings and got credit for the win as the Kansas City Royals beat the New York Mets 5-4 in Game One of the 2015 World Series.
The San Diego Padres beat the New York Mets 15-10 in Monterrey, Mexico on August 16, 1996 in the first-ever MLB game played in a country other than the United States or Canada. Fernando Valenzuela was credited with the win.
On today’s date in 1990, Ruben Sierra hit a walk-off single in the 13th inning to give the Texas Rangers a 1-0 win over the Chicago White Sox. Nolan Ryan went the first 10 innings for the Rangers, allowing three hits, walking none, and punching out 15 batters.
Ernie Banks took Don Drysdale deep for a walk-off home run to give the Chicago Cubs a 1-0 win over the Los Angeles Dodgers on today’s date in 1960. The blast was the All-Star shortstop’s 34th on the season. He finished with 41, the fourth consecutive year that Banks hit 40 or more home runs.
Players born on today’s date include Dick Lines, a left-hander who went 7-7 with six saves and a 2.83 ERA while making 107 appearances for the Washington Senators across the 1966-1967 seasons. A native of Montreal, Lines went 1-for-19 at the plate, his lone hit coming against Wally Bunker in a 9-7 Senators loss to the Baltimore Orioles in a game that took 19 innings to complete. Andy Etchebarren hit a walk-off homer.
Also born on today’s date was Dave Lemanczyk, a right-hander who led the 1977 Toronto Blue Jays with 13 wins in the team’s inaugural season. Originally with the Detroit Tigers, Lemanczyk went 37-63 with a 4.62 ERA while appearing in 185 games for three teams from 1973-1980. He threw a one-hitter against the Texas Rangers in 1979.
Count Campau played professionally from 1885-1905, with a handful of his seasons spent with teams in his home state of Michigan. The outfielder suited up for the Detroit Tigers, Detroit Wolverines, Detroit Creams, and Grand Rapids Bob-o-links. Campau recorded 1,999 hits, including 153 in the majors.