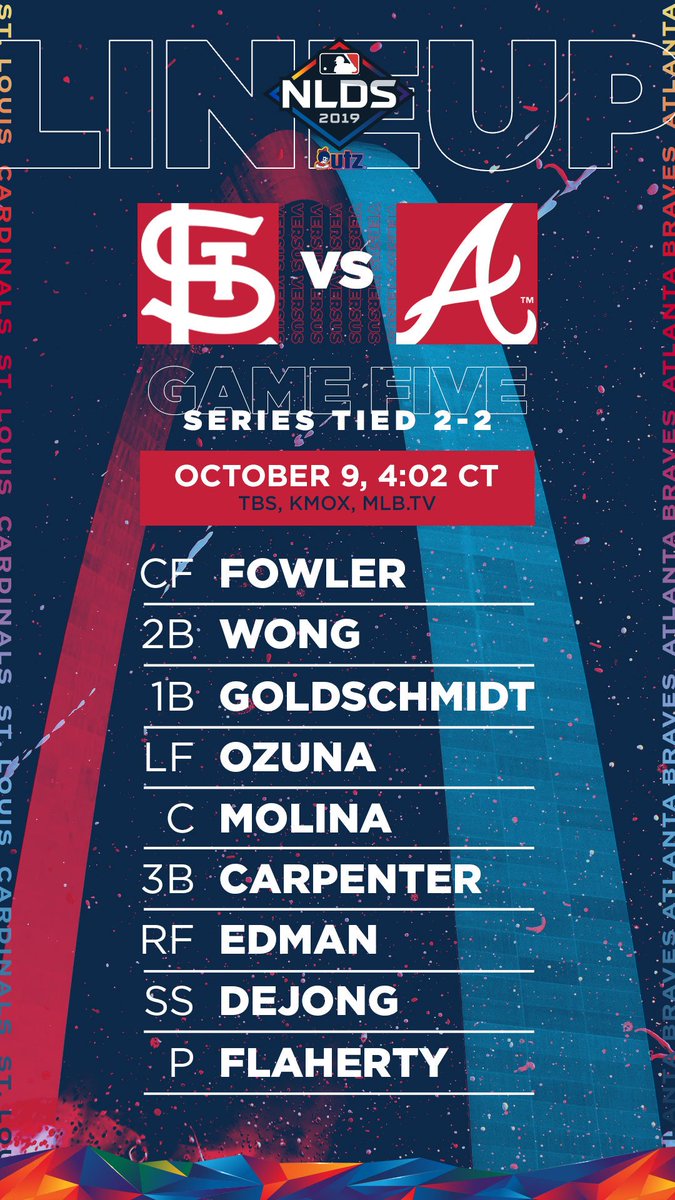
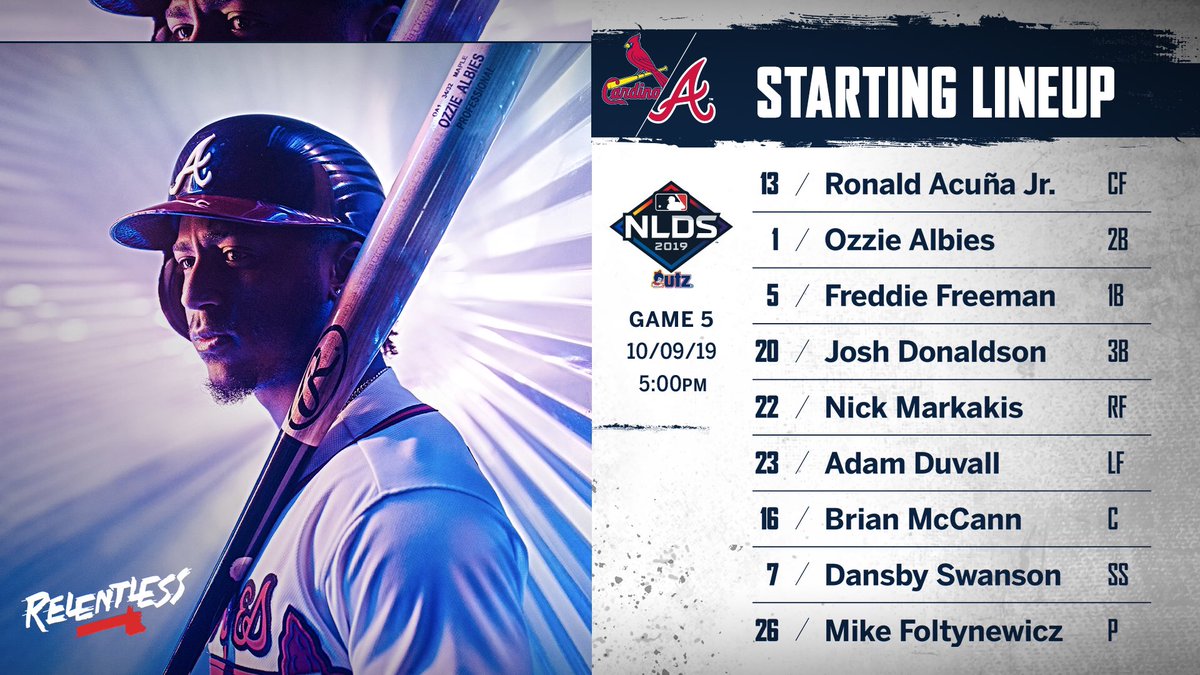
Steve Stone Has a Lot of Opinions on Pitching

Steve Stone knows a lot about pitching. A savvy right-hander for four teams from 1971-1981, he hurled 43 complete games, and augmented a 101-93 record with a rock solid 3.97 ERA. Stone was especially stellar in the 1980 season, garnering 25 wins for the Baltimore Orioles and taking home the American League Cy Young Award.

He doesn’t lack for opinions. Given his current job, he’s not supposed to. The 71-year-old has been in the broadcast booth for 30-plus years, the last 10 of them with the White Sox. As fans of Chicago’s South Side team can attest, Stone knows his stuff, and he’s not shy about sharing it. Agree with him or not, he’s rarely boring.

Stone sat down for a wide-ranging interview — one that offered some blunt commentary on players and trends alike — during a visit to Fenway Park midway through the 2018 season.

———

Steve Stone on learning as a young pitcher: “I pitched with Juan Marichal and Gaylord Perry. I pitched with Jim Palmer and Mike Flanagan. I pitched with Wilbur Wood. One thing I learned … I was very young when I was with Marichal and Perry. I didn’t have Hall of Fame talent, so it was hard to assimilate what they had to show me. Plus, Gaylord wasn’t forthcoming about anything that made him the pitcher he was. Marichal probably would have been, had I been able to understand how he did certain things.

“Perry threw a spitter. He wasn’t going to share that. Not unless I brought $3,000 to the park. That’s how much he said he’d charge to teach me the spitter. I was taking home $8,500. I didn’t want to give him 40% of my yearly take-home pay to try to learn a pitch that very few people can master. Read the rest of this entry »


Job Posting: Chicago Cubs Baseball Systems Software Engineer

Position: Baseball Systems Software Engineer

Location: Chicago, IL

Description:
This role will primarily focus on the development and maintenance of the Cubs internal baseball information system, including creating web interfaces and web tools for the user interface; building ETL processes; maintaining back-end databases; and troubleshooting data sources issues as needed.

Responsibilities:

  • Assist in the design and implementation of web interfaces for the Baseball Ops information system
  • Develop and maintain ETL processes for loading, processing and quality-checking new data sources
  • Identify, diagnose and resolve data quality issues
  • Build and/or support mobile-friendly user interfaces and experiences
  • Build and/or support web services and business-layer applications that speak to both back-end databases and front-end interfaces
  • Provide development support and guidance to Baseball Operations power users and general support to all Baseball Operations front-office and field personnel, as needed
  • Examine, and where appropriate, prototype new technologies in the pursuit of creating competitive advantages through software, applications and tools
  • Partner with Data Architects and Infrastructure/Operations resources on the Information Technology team to ensure secure, scalable and high-performing applications

Required Qualifications:

  • Bachelor’s degree in Computer Science, Engineering or Related Quantitative Subjects
  • Expertise with modern database technologies and SQL
  • Expertise in Python, Java or C#
  • Experience with Javascript
  • Experience with front-end Javascript frameworks like ReactJS, Angular or Vue
  • Experience with HTML/CSS
  • Excellent written and verbal communication skills
  • Working knowledge of advanced baseball statistics and sabermetric concepts

Preferred Qualifications:

  • Experience with the R programming language
  • Experience with Pandas, NumPy and SciPy Python Libraries
  • Experience working in a Linux environment
  • Experience building web or native applications for mobile devices
  • Experience building and supporting ETL processes

To Apply:
To apply, please use this link to complete the online application.

Response Expectations:
Due to the overwhelming number of applications the Cubs receive, they unfortunately may not be able to respond in person to each applicant. However, they can assure you that you will receive an email confirmation when you apply as well as additional email notifications whether you are selected to move forward for the position or not. Please note, the Cubs keep all resumes on file and will contact you should they wish to schedule an interview with you.

The Chicago Cubs and its affiliates are an Equal Opportunity Employer committed to inclusion and employing a diverse workforce. All applicants will receive consideration without regard to race, color, religion, sex, national origin, age, sexual orientation, gender identity, gender expression, veteran status, disability, or other legally protected characteristics.

The content in this posting was created and provided solely by the Chicago Cubs.


2019 FAN Projections!

The 2019 FAN Projection ballots are now open!

Before you can project any players, you’ll have to select the team you follow most closely towards the top of the screen. If you don’t really follow a team, just pick one. You’ll only have to do this once.

After you’ve selected a team, you can begin projecting players. There are nine categories of interest for pitchers and 10 categories for position players. Pick the values in the drop-down boxes closest to what you think the player will do in 2018. Hit the submit button and you’re done! If you made a mistake, you can always go back and change your selection at any time.

Please note that everything is a rate stat. You’re projecting 2B+3B, HR, SB, and Fielding as a measure of 150 games (basically a full season). The player’s previous stats are shown per 150 games in the projection ballot, too. This will make changing playing-time projections much easier, as you’ll only have to change the games played portion.

That’s really all there is to it. You can filter players by team or, if you go to the player pages, you can project players individually. If you want to see all the players you’ve projected, you can click on the “My Rankings” button, which will show you only what you specifically projected a player to do.

FAN Projections will appear on a player’s page after five ballots have been submitted for him.

If you do notice any issues, please let us know.


The Specter of Jason Heyward’s Contract Looms Over Manny Machado

Three winters ago, Jason Heyward was a young free agent, a relative rarity as most players make their debuts at 23 years old or older, while many other young stars sign contract extensions prolonging the wait to hit the open market. Heyward debuted at just 20 years old on Opening Day back in 2010 and moved through the arbitration process to become a free agent heading into his age-26 season. There hadn’t been a free agent like Heyward — that young and that accomplished — in more than a decade. Three seasons later, Heyward has put up just four wins rather than the four wins per year that was expected. And now a very similar player in Manny Machado is hitting free agency, and might not be receiving the offers he expected.

While Manny Machado isn’t Jason Heyward, he’s not Bryce Harper either. Machado just put up his best offensive season with a 141 wRC+, while Harper’s season was almost viewed as a disappointment despite him hitting a very similar 135 wRC+. Harper derives nearly all of his value from his bat, while Machado is a more balanced player, getting value from his bat and his glove. In that way, he’s a remarkably similar player to Jason Heyward when the latter hit free agency.

Manny Machado and Jason Heyward Through Age-25
Name PA HR BB% K% ISO AVG OBP SLG wRC+ WAR
Manny Machado 4074 175 7.3 % 16.4 % .204 .282 .335 0.487 120 30.2
Jason Heyward 3429 97 10.8 % 18.5 % .163 .268 .353 0.431 118 25.2

Machado got a one-third season jump on Heyward to begin his career and has almost never been hurt, leading to roughly an extra season’s worth of playing time and a five-WAR lead. Heyward walked more, while Machado hit for more power. Heyward’s baserunning exceeded Machado’s, but his good defense at a more difficult position evened out that baserunning deficiency. When Heyward hit free agency, there were some (including me) who argued that Heyward’s contract floor in free agency should have been something like $160 million, with a reasonable value potentially above $300 million based on his comps at the time. Heyward is the most recent player to point to when it comes to long-term deals not working out, even when signed at a young age. Setting aside that Heyward was hurt almost immediately, that the Cubs changed a swing that worked in 2015, and that Heyward will now be on his third hitting coach in four years, what Heyward really should be is another data point among potential Manny Machado comps.

Earlier this month, I took a look at some comps for Bryce Harper mostly ignoring his MVP season. Near the end of the piece, I noted just how great Harper’s overall comps were.

There are so few players like Bryce Harper in baseball history that it is tough to find a lot of good comparisons. In the past 100 years, there have only been 16 players within five WAR of Harper and also within 20% of his plate appearances. Of those 15 other players, 11 are in the Hall of Fame. Manny Machado is another player on that list, with the others being Jim FregosiCesar Cedeno, and Vada Pinson. The 14 players averaged 37 WAR from age-26 through age-35, with eight of the 11 players who played since 1947 hitting that average.

The same exercise with Machado yields slightly different results due to a difference in plate appearance and Harper’s half a win higher WAR total. We end up with 16 total players, including Machado and Harper. We lose Johnny Bench and Tim Raines, but gain Adrian Beltre, so the number of Hall of Famers is pretty close. Also added to the list is Jason Heyward, but even if we include Heyward’s 4.1 WAR and assume he will not generate any wins over the next seven seasons, the average WAR produced from 26 years old through age 35 is 34.8 WAR. That’s easily $300 million contract territory, and with seven of the 11 players since integration going above that mark, there’s a reasonable chance of hitting that mark with Machado.

On the other hand, if we were to admit that the valuations on Heyward missed the mark from some reason or another — like too much of his value being tied into defense or perhaps that debuting young isn’t as important as we thought — we can take a different angle to get a better perspective on Machado. The last set of comps look at only total value, go very far back in history, and take into account up to seven nearly full seasons for some players. Let’s start by narrowing things down a bit. We’ll look at Machado’s last four years, when he put up a 128 wRC+ and 21.7 WAR from age 22 through his age-25 season. To find good comparable players, we’ll look at non-catching position players from 1973-2008 with at least two wins at 25 years old, a WAR between 18 and 26, a wRC+ between 118 and 138, a positive defensive value, and enough plate appearances to qualify for the batting title. Here are Machado’s comps.

Manny Machado Age-22 Through Age-25 Comps From 26-35
Name PA HR AVG OBP SLG wRC+ Off Def WAR
George Brett 5554 204 .316 .393 .535 148 317.4 14.9 53.7
Scott Rolen 5367 195 .284 .367 .492 124 172.9 131.4 47.6
Derek Jeter 6923 161 .317 .387 .456 125 247.2 -14.1 46.1
Chet Lemon 5059 151 .266 .352 .441 121 112.1 43.6 33.2
Cesar Cedeno 4007 78 .277 .342 .418 113 76.6 -41.2 17.5
Troy Glaus 3485 172 .255 .357 .485 120 81.6 -38.9 15.6
AVERAGE 5066 160 .286 .366 .471 125 168 16 35.6

Through 2008, six players have taken Manny Machado’s path at the same age. Two are Hall of Famers, and Scott Rolen should be a third. Even if we include more recent players who have yet to play through age-35, only Jose Ramirez and Ryan Zimmerman qualify and the latter drops the average by just a couple of wins. Machado is still pretty easily a $300 million value by this analysis assuming we start with a $9M/WAR evaluation. Now, let’s only use the last three seasons, where Machado put up 15.1 WAR and a 125 wRC+. Using similar PA, defense, and age-25 restrictions, with WAR between 12 and 18, and a wRC+ between 115 and 135 yields the following comps at age 26 through 35 years old.

Manny Machado Age-23 Through Age-25 Comps From 26-35
Name PA HR AVG OBP SLG wRC+ Off Def WAR
Chipper Jones 6165 312 .312 .413 .565 150 401 -33 55.3
Scott Rolen 5367 195 .284 .367 .492 124 173 131 47.6
Derek Jeter 6923 161 .317 .387 .456 125 247 -14 46.1
Andre Dawson 5839 260 .285 .332 .502 125 180 7 39.6
Ryne Sandberg 5416 185 .290 .353 .465 122 148 42 38.5
Robin Ventura 5405 223 .267 .363 .465 113 85 114 37.4
Willie Randolph 5500 32 .273 .368 .343 106 43 87 31.8
Eric Chavez 3217 123 .260 .339 .451 108 30 29 16.6
Troy Glaus 3485 172 .255 .357 .485 120 82 -39 15.6
Edgardo Alfonzo 3390 84 .280 .357 .422 106 31 7 14.4
Lloyd Moseby 3237 88 .251 .333 .405 103 25 -42 9.3
AVERAGE 4904 167 .279 .361 .459 118 131 26 32

Another very good group here, but it’s worth noting that Glaus, Chavez, and Moseby all posted WAR totals at age-25 at least two wins lower than Machado last year, so restricting this group further would yield a number even higher than the previous group. It is also worth noting that Jason Heyward, Dustin Pedroia, Nolan Arenado, and Ryan Zimmerman are all recent comps. Pedroia has been worth 33 wins over the past 9 years with Zimmerman worth around 14 over the past eight seasons, and including those two players only drops the average WAR by about one win. Arenado has already put up 11 wins in two seasons, we’ve discussed Heyward, and in the unlikely event that none of the four active players produce anything else, the group average still sits at around 28 wins. We are dealing with a very accomplished group whose average production would be worth well over $300 million over the next 10 years.

When we drop down to just the last two years of Machado, we should see the most pedestrian group given Machado’s lackluster 2017 season. Over the last two seasons, Machado has a 122 wRC+ with 8.8 WAR, so we’ll look at players between 112 and 132 wRC+ with between 7 and 11 wins, leaving the other parameters the same.

Manny Machado Age-24 Through Age-25 Comps From 26-35
Name PA HR AVG OBP SLG wRC+ Off Def WAR
Carlos Beltran 5748 252 .282 .368 .509 129 265.8 21.6 47.2
Alan Trammell 5279 132 .293 .359 .445 121 138 125.5 44.8
Andre Dawson 5839 260 .285 .332 .502 125 180 7.4 39.6
Dave Winfield 6301 256 .290 .359 .496 136 263.7 -112.4 37.6
Matt Williams 5155 261 .278 .327 .503 112 79 76 31.9
Dwayne Murphy 3989 142 .241 .348 .410 116 73 42.7 25.4
Dusty Baker 5407 166 .279 .346 .432 119 114.5 -62.1 24
Coco Crisp 4345 82 .260 .327 .393 96 31.8 20.9 20.3
Eric Chavez 3217 123 .260 .339 .451 108 29.5 29.3 16.6
Raul Mondesi 4571 201 .264 .330 .478 109 61.5 -49 16
Edgardo Alfonzo 3390 84 .280 .357 .422 106 30.5 6.7 14.4
Roberto Kelly 3915 98 .290 .338 .436 105 29.6 -68.5 9.5
Lloyd Moseby 3237 88 .251 .333 .405 103 25.1 -41.7 9.3
AVERAGE 4646 165 .273 .343 .452 114 101.7 -0.3 25.9

As we might expect given Machado’s 2017, this is the most disappointing group we’ve seen. It’s also still a group that might produce an average outcome in the $275 million range. There are three Hall of Famers up there with Beltran having a chance at four. The same caveats as above regarding Moseby and Chavez apply here, as well. Among active players, we still have Pedroia, Heyward, and Arenado, though we add Kyle Seager, who has averaged around four wins per season over the last five years despite a disappointing 2018 campaign. We also add Christian Yelich, who has just one season beyond 25 years old, but won the NL MVP with a 7.6 WAR year. Javier Baez and Xander Bogaerts also qualify, but are the same age as Machado.

If we only had Machado’s 2018 season as a comparison, this is what that group looks like:

Manny Machado Age-25 Comps From 26-35
Name PA HR AVG OBP SLG wRC+ Off Def WAR
Larry Walker 5127 277 .331 .416 .613 147 323 6 48.6
Alan Trammell 5279 132 .293 .359 .445 121 138 126 44.8
Bobby Grich 5209 158 .271 .375 .438 132 185 51 42.7
Andre Dawson 5839 260 .285 .332 .502 125 180 7 39.6
Ryne Sandberg 5416 185 .290 .353 .465 122 148 42 38.5
Tim Raines 5808 107 .294 .385 .429 125 221 -53 36.8
Willie Randolph 5500 32 .273 .368 .343 106 43 87 31.8
Jesse Barfield 3456 153 .250 .336 .456 115 58 71 24.7
David Wright 3824 112 .286 .366 .458 128 127 -16 24.1
Marcus Giles 2190 38 .273 .348 .405 100 12 8 9.2
AVERAGE 4765 145 .285 .364 .455 122 143 33 34.1

These are the wildest results we’ve seen with a bad Marcus Giles, a good but injury shortened run from David Wright, a decent run from Jesse Barfield, and then near-Hall of Fame or better runs from the seven remaining players. Of the more recent players, Evan Longoria, Ryan Zimmerman, Hanley Ramirez, Kris Bryant and Matt Chapman also fit the bill. Even including the first three more recent players doesn’t drop the average below 30. Of note, Jason Heyward is not a comp in the last group, as Machado’s 141 wRC+ was significantly higher than Heyward’s age-25 season and at least 20 points higher than every season Heyward has put up since the right fielder’s 134 wRC+ in his 2010 rookie campaign.

Jason Heyward might show some similarities to Manny Machado, but that contract and the results the last three seasons shouldn’t scare people away from Manny Machado. Heyward is still young enough that he could turn his contract around, but that also shouldn’t matter for Machado. The current free agent has better comps than Heyward and is coming off a much better season. Even with similar comps, Heyward is still just one data point among multiple Hall of Famers. Players who hit like Machado, play solid defense, and perform well in their early to mid-20s tend to keep doing so. The same should be expected of Machado, as well.


Derek Holland Is Derek Holland Again

One season ago, Derek Holland was one of the worst pitchers in baseball. There were 134 pitchers in the majors who threw at least 100 innings. Holland wound up with the fifth-worst ERA-. He wound up with the single worst FIP-, and the single-worst xFIP-. He allowed the second-highest wOBA, and he allowed the very highest expected wOBA, based on Statcast. It was a new low for Holland in what had earlier been a promising career. After peaking with the Rangers when the Rangers were good, Holland fought knee trouble and shoulder trouble. After that miserable 2017 with the White Sox, Holland joined the Giants on a minor-league contract.

Last year’s Giants were bad. One of the things that happens when a team is bad is that the team also doesn’t draw very much attention. Criticism is heaped upon the good players who disappoint, and optimists might hunt for bright spots among youth. But bad teams are by and large forgotten or ignored as a summer wears on. As a consequence of that, you might not have noticed Derek Holland’s 2018. I know I didn’t, for a while. It was a terrible year for the Giants. It was a successful year for Holland.

Read the rest of this entry »


DJ LeMahieu Is Going to Look Familiar

Late last week, free-agent infielder DJ LeMahieu signed for two years and $24 million. LeMahieu is going into his age-30 season, and not that long ago, I wrote about his offensive upside. Given where we are in the information era — and the player-development era — I find LeMahieu intriguing, and so I’m a fan of the terms. I think he can be a lot more valuable than this, although to his agent’s credit, he’s also a member of baseball’s veteran middle class, so it’s good to lock down a multi-year contract at all.

The one thing that’s somewhat surprising is that LeMahieu didn’t sign with, say, the Brewers. He signed with the Yankees. The Yankees already had a player at LeMahieu’s primary position, just as the Mets already had a player (two of them, in fact) at Jed Lowrie‘s primary position. So, just like with Lowrie, LeMahieu is expected to move around the diamond. It makes it all the more difficult to fit Manny Machado with the Yankees. It also makes you wonder at least a little bit about Miguel Andujar’s future as the Yankees’ third baseman. In LeMahieu, the Yankees signed a talented player, but it raises new questions. It also re-raises old ones.

For the next few minutes, though, let’s forget all of that. Let’s forget about how the Yankees’ infield all works together. Let’s forget about Machado, and Andujar, and Troy Tulowitzki. Let’s just talk about DJ LeMahieu’s hitting. Does he remind you of anyone?

Read the rest of this entry »


Getting Mike Mussina to 75 Percent

Editor’s Note: As we approach the January 22 Hall of Fame announcement, we’ll be featuring a few pieces from Anthony Calamis and Adam Dore, members of Ryan Thibodaux’s excellent team that tracks public Hall of Fame ballot. This is the first such piece. Be sure to check out the ballot tracker, which is an indispensable tool for any Hall of Fame enthusiast.

In case you have somehow missed any of Jay Jaffe’s excellent coverage over the last month, December is the time of the year when Hall of Fame ballots get mailed out. More than 400 BBWAA members comprise the voting body tasked with electing players to the National Baseball Hall of Fame and Museum in Cooperstown, New York.

I’m part of a four-person ballot-tracking team led by Ryan Thibodaux (@NotMrTibbs) that finds every public ballot, records the percentage of votes for each candidate, and tracks which players have been added to or dropped from a voter’s ballot from one year to the next, assuming they were public in both years. Right now, there are 172 ballots in the Tracker.

This year in particular, a few intriguing trends have emerged as ballots have been made public. I chose to explore Mike Mussina’s candidacy and what needs to happen over the next nine days for him to share the stage next July with likely inductees such as Mariano Rivera.

Before diving into the particulars, here is a table showing the current results in the Tracker:

2019 BBWAA HOF Vote (172 Ballots Returned)
Candidate Votes Percentage
Mariano Rivera 172 100.0%
Roy Halladay 162 94.2%
Edgar Martinez 155 90.1%
Mike Mussina 140 81.4%
Curt Schilling 127 73.8%
Roger Clemens 126 73.3%
Barry Bonds 125 72.7%
Larry Walker 113 65.7%
Omar Vizquel 62 36.0%
Fred McGriff 61 35.5%
Manny Ramirez 45 26.2%
Scott Rolen 36 20.9%
Todd Helton 35 20.3%
Billy Wagner 26 15.1%
Sammy Sosa 23 13.4%
Gary Sheffield 23 13.4%
Jeff Kent 22 12.8%
Andruw Jones 14 8.1%
Andy Pettitte 12 7.0%
Michael Young 3 1.7%
Lance Berkman 2 1.2%
Roy Oswalt 2 1.2%
Miguel Tejada 2 1.2%
SOURCE: Ryan Thibodaux’s 2019 Baseball HOF Tracker

Three of the candidates have had their boxes checked on over 90% of known ballots. All the others are below the required 75% for election, leaving Mussina as the most interesting bubble candidate this year. In the 2018 voting, Mussina received votes on 268 of the possible 422 ballots cast, good for 63.5%, 11.5% (or 49 votes) shy of election; Chipper Jones, Vladimir Guerrero, Jim Thome and Trevor Hoffman all surpassed 75%.

Read the rest of this entry »


The Angels and Anaheim Made a Short-Term Deal

In October, we talked about the Angels opting out of their stadium lease with the city of Anaheim. At the time, the move required that the team vacate the venue at the close of the 2019 season. Given the rapidly approaching deadline and acrimony between the parties, I speculated then that the most likely outcome would be a short-term deal.

So where does that leave the Angels and Anaheim? Most observers think these two parties need each other, and I tend to agree. . . . The Angels need a baseball stadium, and Anaheim doesn’t want to lose its tenant, even if the team has been a pain in its butt. At the same time, however, we’re already seeing trial balloons floated about moves to Portland or Las Vegas, and neither side is moving with any urgency at this point (though that could and probably will change down the road). I think the safe bet is a short-term, five- or ten-year lease with another opt-out, enough for the two sides to have a brief cooling-off period.

As it turns out, the two sides did end up reaching a short-term agreement, but it was for a far shorter length of time than most observers, including myself, anticipated.

The Angels and the city of Anaheim are expected to agree to a one-year extension of the team’s lease at Angel Stadium, which would keep the team in Anaheim through the 2020 season.

The Anaheim City Council is expected to consider the extension at its meeting Tuesday. Harry Sidhu, the city’s new mayor, plans to introduce the proposal after meeting last week with Angels owner Arte Moreno.

So why the short-term pact? For one thing, both sides are reportedly planning to use the extension to give some breathing room to further negotiations. Alden Gonzalez wrote for ESPN that the team and city have already begun a dialogue.

New Anaheim Mayor Harry Sidhu, sworn in last month, met with Angels owner Arte Moreno last week, and both sides decided that more time would be beneficial.

“We realized a one-year extension will give us adequate time to work collaboratively on a long-term relationship,” Moreno said in a statement.

“From that meeting, it is clear the team’s priority is to stay in Anaheim, if we can work out a deal that benefits our residents, the city and the team,” Sindhu said in his statement. “We need a plan to make that happen, and we need time to make that happen.”

On the surface, this seems entirely reasonable. A deadline at the end of 2019 would make it difficult for extension talks to be productive given the proverbial sword of Damocles hanging over the parties. Still optimism for a deal seems to revolve around the city’s newfound willingness to discuss either a new stadium, or significant renovations to the existing structure, a proposition the city earlier considered a non-starter.

While neither side has commented in recent months on specifics of what they hope a new lease might include, city spokesman Mike Lyster said, “We’re going to look at everything from rehabbing the stadium all the way to building a new stadium.”

But for the team, there’s a catch. While the city is now willing to discuss the concept of a new ballpark, the city is not at all willing to finance such a venture. Instead, the city is proposing an arrangement like the one the Anaheim Ducks tentatively made for their venue, the Honda Center, late last year.

The broad terms of the deal were approved unanimously by the Anaheim City Council at the Oct. 23 meeting and call for the city to sell three Honda Center parking lots, plus a lot across the street, at fair market value to Anaheim Arena Management (AAM), which could be developed into homes, office and commercial space. The vote gives city staff a framework to negotiate the final terms of the deal for later approval by the city council.

The Ducks, who have been based in Anaheim the past 25 years, would sign onto another 25-year commitment with Anaheim after their current agreement ends in June 2023. Anaheim Arena Management, which currently operates and maintains the Honda Center, would continue operating the facility until 2048.

Such a deal would be an elegant solution to the current impasse, changing what the Angels consider to be a “toxic” atmosphere for local businesses into a private-public partnership. At the same time, it’s far from a sure bet; for one thing, a deal like this, while addressing the team’s location concerns, wouldn’t provide the upgraded facility the team desires. And worse, the Ducks’ deal did cut into what the Angels wanted as part of their own mixed-use complex.

[Anaheim] Councilman Stephen Faessel, who otherwise called the proposal a “great deal,” questioned why the deal includes the sale of a parking lot across from the Honda Center by ARTIC without a formal bidding process where other developers could also bid for the property.

“ARTIC is not that far from Angel Stadium, and now we’re likely going to have to negotiate a deal with the Angels, how do we know the Angels won’t give us a better deal?” Faessel said.

City spokesman Mike Lyster later clarified the city is not considering selling the ARTIC lot, but may lease it to the Honda Center.

So despite how the deal has been framed – as a way for the two sides to buy time to reach a more long-lasting arrangement – this extension is no guarantee that an agreement will, in fact, be reached. And most interestingly, the one-year extension keeps open the possibility that the team could consider a jump outside of California – particularly given the recent development that Portland may be ready for a major league team as soon as 2022.


2019 ZiPS Projections – Texas Rangers

After having typically appeared in the hallowed pages of Baseball Think Factory, Dan Szymborski’s ZiPS projections have now been released at FanGraphs for more than half a decade. The exercise continues this offseason. Below are the projections for the Texas Rangers.

Batters

Perhaps the biggest disappointment in last year’s projections (and in 2018, really) was the several steps taken backward by Willie Calhoun. Originally, it was believed he would only be in the minors temporarily to beat up minor league pitchers while some service time shenanigans resolved themselves. Problem was, Calhoun never really earned a callup, struggling to hit Triple-A pitchers and only besting an .800 OPS in a single month of the season, a July that was driven by a .364 batting average. The Rangers brought him up when there was obvious playing time for him, but hitting .222/.269/.333 in 108 plate appearances was hardly a strong push for a full-time job. Even ignoring the cameo role in the majors, Calhoun’s power was mostly gone in the minors, which is not good. To be a decent starting left fielder in the majors, you have to be a batting average/on-base percentage deity or be a legitimate all-world talent on defense. Calhoun is neither. I wouldn’t write him off yet, but I’m very worried.

I’m a little surprised that Texas either couldn’t or wouldn’t close a deal with another team for Shin-Soo Choo, a player whose presence required a losing Rangers team to carry a significant salary after Choo turned in a solid little year and had some trade value. Choo is quickly approaching age 40, and until Nomar Mazara actually turns his impressive raw power into actual counting numbers, Joey Gallo is the only really dependable Rangers hitter. Gallo is what he is, and will likely always have an abysmal batting average. He’s fortunate to not have been born 30 years earlier.

One projection that intrigues me is Christian Lopes’, who was a third-tier prospect for the Blue Jays a very long time ago with a fairly mature approach at the plate coming out of high school. It never really manifested itself in the stats, however, and the knock was that he didn’t have a standout tool otherwise. But he’s made great strides the last couple years and has gotten to the point where he may be a pretty interesting role player, with Texas using him at a lot of positions in the minors.

Pitchers

You can see the skinny rebuild in progress in the Rangers’ rotation. You have a number of OK-ish starters (excluding Yohander Mendez, who ZiPS hates with the fire of a thousand suns), probably none of whom will be part of the next good Rangers team. Drew Smyly, Edinson Volquez, and Shelby Miller are essentially reclamation projects, and at three years and $30 million, Lance Lynn may be the last of the quintet “out” of Texas (Mike Minor is there, too), but if the recovery in his peripherals in 2018 isn’t a fluke, Texas may get a real prospect for him.

ZiPS is a believer in Jose Leclerc at the front of the bullpen, and sees the rest of the group as a fairly boring but quite adequate relief corps, which is fine with the Rangers not seriously contending yet.

Bench and Prospects

One of the most interesting Rangers projections is that of Brock Burke, a former Rays third-rounder who the Rays brought around very slowly out of high school. 2018 was the year in which everything clicked, with Burke seeing a 30% bump in his strikeout rate while also being promoted, striking out almost 12 batters a game for Montgomery. ZiPS doesn’t give him a huge ceiling, but is surprisingly confident in Burke being a mid-rotation starter despite only him only having limited playing time in Double-A.

One pedantic note for 2019: for the WAR graphic, I’m using FanGraphs’ depth chart playing time, not the playing time ZiPS spits out, so there will be occasional differences in WAR totals.

Ballpark graphic courtesy Eephus League. Depth charts constructed by way of those listed here at site.

Batters – Counting Stats
Player B Age PO G AB R H 2B 3B HR RBI BB SO SB CS
Joey Gallo L 25 LF 142 436 85 93 19 3 40 84 78 202 7 2
Adrian Beltre R 40 3B 101 369 40 98 18 1 12 55 30 76 1 0
Elvis Andrus R 30 SS 132 511 69 139 29 4 10 54 37 81 13 7
Rougned Odor L 25 2B 148 551 82 137 28 4 24 77 38 141 13 10
Shin-Soo Choo L 36 DH 123 464 71 116 21 1 17 55 68 129 6 2
Nomar Mazara L 24 RF 144 536 65 140 25 3 23 88 46 129 1 1
Christian Lopes R 26 2B 120 434 55 111 23 2 9 45 46 85 12 5
Patrick Wisdom R 27 3B 125 418 56 96 21 2 16 60 37 145 8 3
Nolan Fontana L 28 SS 92 299 40 62 15 2 6 29 50 99 6 3
Tommy Joseph R 27 1B 117 411 52 107 23 0 21 69 26 99 0 0
Willie Calhoun L 24 LF 145 545 71 146 31 2 22 74 37 81 3 1
Ronald Guzman L 24 1B 131 454 56 112 20 3 15 58 39 127 2 1
Danny Santana B 28 CF 103 324 43 79 18 4 10 40 15 89 12 6
Chase d’Arnaud R 32 2B 106 340 44 82 15 3 9 39 29 90 13 4
Delino DeShields R 26 CF 118 380 66 90 16 3 4 26 48 104 25 7
Andy Ibanez R 26 3B 122 466 53 116 22 2 11 46 32 82 4 5
Carlos Perez R 28 C 76 250 27 58 14 1 7 32 17 52 2 1
Jett Bandy R 29 C 82 263 30 58 14 0 9 32 14 61 2 0
Isiah Kiner-Falefa R 24 C 122 441 50 111 20 2 4 35 34 81 9 6
Anderson Tejeda L 21 SS 125 476 59 109 19 4 15 54 36 171 8 6
Jack Reinheimer R 26 SS 114 417 49 98 16 2 5 34 35 104 14 6
Hunter Cole R 26 RF 107 404 47 96 19 3 13 48 31 128 2 3
Ryan Rua R 29 LF 89 247 32 54 9 1 9 26 17 88 6 1
Leody Taveras B 20 CF 138 551 61 132 18 6 8 43 41 121 15 12
Jeff Mathis R 36 C 56 166 13 32 7 1 2 15 14 58 0 0
Tony Sanchez R 31 C 67 233 27 54 11 1 5 25 20 64 1 1
Josh Morgan R 23 C 95 363 39 87 16 2 4 29 23 64 2 1
Jose Trevino R 26 C 89 347 35 76 13 1 6 31 14 58 1 2
Charles Leblanc R 23 2B 126 464 52 110 21 3 9 45 38 121 5 3
Carlos Tocci R 23 CF 130 382 40 98 14 6 1 28 23 93 4 7
Nick Noonan L 30 SS 89 304 30 69 14 1 4 28 16 80 2 2
Jose Cardona R 25 CF 111 425 47 101 15 1 8 35 26 82 11 9
Cliff Pennington B 35 SS 91 234 24 48 8 1 2 16 25 67 2 1
Scott Heineman R 26 RF 118 479 59 118 22 3 11 46 34 128 12 8
Michael De Leon R 22 SS 140 515 46 124 21 1 4 37 18 80 2 2
Destin Hood R 29 RF 108 384 44 86 18 2 14 48 24 130 5 3
Yonny Hernandez B 21 SS 116 390 46 86 13 2 2 26 48 95 31 16
Eliezer Alvarez B 24 LF 108 408 50 92 20 4 9 41 34 141 20 5
Eli White R 25 2B 122 484 55 113 24 4 6 40 40 146 10 6
Yanio Perez R 23 1B 96 365 39 84 12 1 8 32 25 105 2 1
Michael O’Neill R 27 CF 122 439 46 92 19 2 10 39 29 157 18 6
Preston Beck L 28 1B 109 404 43 92 17 3 7 37 29 104 2 3
Correlle Prime R 25 1B 86 292 27 56 11 1 6 23 17 129 3 4

Batters – Rate Stats
Player BA OBP SLG OPS+ ISO BABIP RC/27 Def WAR No. 1 Comp
Joey Gallo .213 .343 .546 127 .333 .273 6.5 -7 2.2 Adam Dunn
Adrian Beltre .266 .324 .417 92 .152 .306 5.0 6 1.5 Mike Lowell
Elvis Andrus .272 .322 .403 88 .131 .307 4.8 -2 1.2 Marco Scutaro
Rougned Odor .249 .307 .445 93 .196 .293 4.8 -2 1.2 Steve Buechele
Shin-Soo Choo .250 .355 .409 100 .159 .311 5.3 0 1.1 Bill White
Nomar Mazara .261 .323 .448 99 .187 .305 5.3 -1 1.0 Adam Lind
Christian Lopes .256 .330 .380 86 .124 .300 4.6 -1 0.8 Tim Dulin
Patrick Wisdom .230 .297 .404 81 .175 .311 4.3 3 0.8 Jim Chamblee
Nolan Fontana .207 .322 .331 72 .124 .289 3.6 1 0.5 Lauro Felix
Tommy Joseph .260 .309 .470 100 .209 .296 5.3 -3 0.4 Nate Gold
Willie Calhoun .268 .317 .453 99 .185 .281 5.3 -7 0.4 Mike Greenwell
Ronald Guzman .247 .314 .403 86 .156 .311 4.5 4 0.4 Juan Tejeda
Danny Santana .244 .279 .417 79 .173 .307 4.1 1 0.3 Randy Kutcher
Chase d’Arnaud .241 .306 .382 79 .141 .303 4.3 -2 0.2 Royce Clayton
Delino DeShields .237 .325 .326 72 .089 .316 4.1 -1 0.2 Deron McCue
Andy Ibanez .249 .300 .376 75 .127 .282 3.9 1 0.2 Pete Rose Jr.
Carlos Perez .232 .281 .380 71 .148 .267 3.8 0 0.2 Jim Horner
Jett Bandy .221 .283 .376 71 .156 .254 3.8 -1 0.1 Scott Servais
Isiah Kiner-Falefa .252 .315 .333 71 .082 .301 3.7 -4 0.0 Rafael Pujols
Anderson Tejeda .229 .284 .380 72 .151 .324 3.7 -2 0.0 Bert Pena
Jack Reinheimer .235 .296 .319 62 .084 .302 3.4 2 -0.1 Drew Meyer
Hunter Cole .238 .293 .396 78 .158 .316 4.0 3 -0.1 Mike Diaz
Ryan Rua .219 .276 .372 68 .154 .300 3.7 3 -0.1 Cory Aldridge
Leody Taveras .240 .292 .338 64 .098 .294 3.3 6 -0.2 Julio Peguero
Jeff Mathis .193 .258 .283 42 .090 .283 2.4 4 -0.2 Frank Charles
Tony Sanchez .232 .298 .352 70 .120 .299 3.6 -4 -0.3 Mike DiFelice
Josh Morgan .240 .291 .328 62 .088 .281 3.4 -2 -0.3 Chad Strickland
Jose Trevino .219 .250 .314 47 .095 .247 2.6 6 -0.4 Rogelio Arias
Charles Leblanc .237 .295 .353 69 .116 .302 3.7 -2 -0.4 Brad Harman
Carlos Tocci .257 .306 .332 68 .076 .337 3.4 0 -0.4 Darren Lewis
Nick Noonan .227 .266 .319 53 .092 .295 2.9 1 -0.6 Kevin Baez
Jose Cardona .238 .285 .334 62 .096 .278 3.2 1 -0.6 Joey Aragon
Cliff Pennington .205 .281 .274 47 .068 .279 2.6 0 -0.6 Rabbit Warstler
Scott Heineman .246 .305 .374 77 .127 .315 4.0 -2 -0.6 Mike Berger
Michael De Leon .241 .268 .309 51 .068 .278 2.9 6 -0.7 Mario Diaz
Destin Hood .224 .271 .391 70 .167 .300 3.6 0 -0.7 Scott Wade
Yonny Hernandez .221 .312 .279 57 .059 .287 3.0 -4 -0.8 Nick Punto
Eliezer Alvarez .225 .290 .360 69 .135 .322 3.9 -3 -0.8 Thomas Howard
Eli White .233 .298 .337 66 .103 .322 3.5 -5 -0.9 Caonabo Cosme
Yanio Perez .230 .286 .334 62 .104 .302 3.4 0 -1.2 Jason Restko
Michael O’Neill .210 .266 .330 55 .121 .301 3.1 -7 -1.6 Jamie Sykes
Preston Beck .228 .283 .337 62 .109 .290 3.2 -3 -1.7 Greg Creek
Correlle Prime .192 .240 .298 40 .106 .318 2.2 2 -1.7 Eli Tintor

Pitchers – Counting Stats
Player T Age W L ERA G GS IP H ER HR BB SO
Lance Lynn R 32 10 9 4.50 28 27 146.0 154 73 19 65 126
Mike Minor L 31 9 8 4.49 24 24 132.3 133 66 20 37 108
Jose Leclerc R 25 4 2 3.13 61 0 63.3 45 22 3 39 85
Brock Burke L 22 8 7 4.77 25 23 128.3 143 68 16 54 99
Martin Perez L 28 8 7 4.76 26 22 128.7 146 68 14 46 77
Drew Smyly L 30 6 5 4.73 20 20 99.0 105 52 19 32 97
Jesse Chavez R 35 4 2 3.99 57 0 76.7 76 34 11 20 71
Brett Martin L 24 6 6 4.92 26 15 89.7 99 49 10 39 66
Yovani Gallardo R 33 8 8 5.22 26 24 122.3 139 71 16 54 77
Adrian Sampson R 27 7 7 5.12 32 21 128.3 155 73 21 26 74
Shelby Miller R 28 6 6 5.08 17 16 83.3 92 47 13 31 70
Chris Martin R 33 3 2 3.74 44 0 43.3 46 18 4 11 35
Tony Barnette R 35 2 1 3.59 38 0 42.7 41 17 3 13 39
Phillips Valdez R 27 6 6 5.08 29 18 111.7 129 63 14 47 73
Matt Bush R 33 3 2 3.83 44 0 44.7 42 19 5 18 43
Doug Fister R 35 6 6 5.00 17 15 86.3 98 48 13 29 56
Clayton Blackburn R 26 5 5 5.03 18 16 87.7 103 49 13 26 58
Kyle Bird L 26 3 3 4.72 45 4 68.7 72 36 8 35 57
Jeffrey Springs L 26 5 5 4.98 44 6 86.7 87 48 15 42 92
Deolis Guerra R 30 3 2 4.31 42 2 54.3 55 26 8 16 50
Jeanmar Gomez R 31 4 3 4.32 54 0 58.3 64 28 6 20 42
Ariel Jurado R 23 8 10 5.57 28 25 145.3 183 90 23 38 65
Edinson Volquez R 35 4 4 5.14 12 12 63.0 70 36 8 32 44
Luke Farrell R 28 6 6 5.34 29 16 91.0 99 54 16 46 81
Nick Gardewine R 25 2 2 4.08 30 0 35.3 34 16 3 15 33
Taylor Hearn L 24 5 6 5.37 23 23 107.3 113 64 18 57 98
Drew Hutchison R 28 6 7 5.52 26 19 109.3 124 67 19 47 85
Joe Palumbo L 24 3 3 5.14 12 11 49.0 54 28 8 20 36
Jonathan Hernandez R 22 7 8 5.57 22 22 103.3 113 64 15 62 83
Michael Tonkin R 29 2 2 4.62 43 0 50.7 52 26 8 20 52
Ricardo Rodriguez R 26 3 3 4.87 45 2 57.3 62 31 8 20 46
Ronald Herrera R 24 5 6 5.42 17 17 91.3 110 55 13 36 46
Connor Sadzeck R 27 3 3 4.74 57 0 49.3 48 26 5 31 47
Tim Dillard R 35 3 3 4.78 25 2 43.3 47 23 5 21 29
Jordan Romano R 26 4 6 5.38 14 14 68.0 71 41 11 32 52
Wei-Chieh Huang R 25 4 5 5.14 38 2 70.0 71 40 11 38 68
Eddie Butler R 28 5 6 5.49 30 14 95.0 114 58 14 38 52
Miguel Del Pozo L 26 3 3 4.97 34 0 41.7 45 23 4 22 32
C.D. Pelham L 24 2 2 5.17 54 0 55.7 57 32 5 39 45
Chris Rowley R 28 7 9 5.85 26 20 120.0 143 78 22 50 72
Wes Benjamin L 25 5 7 6.00 20 19 87.0 106 58 18 34 58
Richelson Pena R 25 6 8 5.96 23 18 108.7 135 72 24 30 65
Jack Leathersich L 28 1 2 5.34 38 0 32.0 28 19 3 31 37
Adam Parks R 26 3 3 5.48 34 0 46.0 51 28 9 19 39
Zac Curtis L 26 3 3 5.28 56 0 59.7 59 35 9 40 60
Tim Lincecum R 35 1 2 5.55 24 0 24.3 27 15 4 15 19
Adam Loewen L 35 3 3 5.40 42 0 45.0 41 27 5 40 47
Kevin Jepsen R 34 2 2 5.81 36 0 31.0 33 20 6 16 23
Chris Tillman R 31 6 8 6.12 22 21 100.0 118 68 17 50 59
Brandon Mann L 35 3 4 5.80 36 3 54.3 59 35 9 32 41
Austin Bibens-Dirkx R 34 5 6 6.16 25 16 99.3 120 68 23 34 69
Ariel Hernandez R 27 3 4 5.74 47 0 53.3 51 34 5 56 50
Rafael Montero R 28 5 7 6.04 26 17 98.3 117 66 18 55 79
Locke St. John L 26 4 5 5.93 37 0 54.7 60 36 12 28 49
Collin Wiles R 25 6 8 6.31 21 20 107.0 135 75 26 28 65
Yohander Mendez L 24 6 9 6.63 30 26 130.3 158 96 33 55 92
Yoel Espinal R 26 3 5 7.29 42 2 54.3 59 44 12 55 52

Pitchers – Rate Stats
Player TBF K/9 BB/9 HR/9 BABIP ERA+ ERA- FIP WAR No. 1 Comp
Lance Lynn 652 7.77 4.01 1.17 .310 100 100 4.57 1.8 Bill Singer
Mike Minor 561 7.35 2.52 1.36 .288 100 100 4.41 1.7 Jarrod Washburn
Jose Leclerc 273 12.08 5.54 0.43 .294 148 67 3.07 1.6 Jose Valverde
Brock Burke 580 6.94 3.79 1.12 .315 97 103 4.68 1.5 Jake Chapman
Martin Perez 570 5.39 3.22 0.98 .307 98 103 4.51 1.5 Jim O’Toole
Drew Smyly 429 8.82 2.91 1.73 .308 98 102 4.72 1.2 Cliff Lee
Jesse Chavez 322 8.33 2.35 1.29 .297 116 86 3.98 1.0 Terry Leach
Brett Martin 405 6.62 3.91 1.00 .312 94 106 4.60 0.9 Josh Shortslef
Yovani Gallardo 552 5.66 3.97 1.18 .305 89 113 4.96 0.9 Spec Shea
Adrian Sampson 562 5.19 1.82 1.47 .309 88 114 4.90 0.8 John Doherty
Shelby Miller 369 7.56 3.35 1.40 .312 91 109 4.69 0.7 Jay Tibbs
Chris Martin 186 7.27 2.28 0.83 .313 124 81 3.63 0.7 Bobby Tiefenauer
Tony Barnette 181 8.23 2.74 0.63 .306 129 77 3.29 0.7 Barney Schultz
Phillips Valdez 509 5.88 3.79 1.13 .313 89 113 4.92 0.7 Bill Swift
Matt Bush 193 8.66 3.63 1.01 .296 121 83 4.02 0.7 Jim Hughes
Doug Fister 384 5.84 3.02 1.36 .302 90 111 4.99 0.6 Freddie Fitzsimmons
Clayton Blackburn 389 5.95 2.67 1.33 .313 89 112 4.78 0.6 Lary Sorensen
Kyle Bird 312 7.47 4.59 1.05 .308 98 102 4.71 0.6 Pete Cappadona
Jeffrey Springs 388 9.55 4.36 1.56 .308 93 107 4.90 0.5 J.C. Romero
Deolis Guerra 232 8.28 2.65 1.33 .301 104 96 4.22 0.5 Jay Tessmer
Jeanmar Gomez 256 6.48 3.09 0.93 .312 104 96 4.18 0.5 Frank Linzy
Ariel Jurado 650 4.03 2.35 1.42 .309 83 120 5.22 0.5 Bill King
Edinson Volquez 288 6.29 4.57 1.14 .307 90 111 5.02 0.5 Tommy Byrne
Luke Farrell 416 8.01 4.55 1.58 .310 87 115 5.34 0.5 Mike Buddie
Nick Gardewine 155 8.41 3.82 0.76 .304 114 88 3.83 0.4 Mike Hansen
Taylor Hearn 490 8.22 4.78 1.51 .305 84 119 5.26 0.4 Phil Dumatrait
Drew Hutchison 498 7.00 3.87 1.56 .309 84 119 5.34 0.4 Kevin Hodges
Joe Palumbo 220 6.61 3.67 1.47 .301 90 111 5.21 0.4 Kason Gabbard
Jonathan Hernandez 483 7.23 5.40 1.31 .309 83 120 5.40 0.4 Ben Hendrickson
Michael Tonkin 223 9.24 3.55 1.42 .312 100 100 4.45 0.3 Mark Small
Ricardo Rodriguez 253 7.22 3.14 1.26 .307 95 105 4.56 0.3 Robert Tenenini
Ronald Herrera 417 4.53 3.55 1.28 .306 83 121 5.34 0.3 Joe Coleman
Connor Sadzeck 227 8.57 5.66 0.91 .305 98 102 4.63 0.3 Joe Hudson
Tim Dillard 197 6.02 4.36 1.04 .300 94 106 4.90 0.3 Hal White
Jordan Romano 309 6.88 4.24 1.46 .290 82 122 5.44 0.2 Ken Pumphrey
Wei-Chieh Huang 318 8.74 4.89 1.41 .305 90 111 5.05 0.2 Marc Pisciotta
Eddie Butler 433 4.93 3.60 1.33 .308 82 122 5.30 0.1 Marino Pieretti
Miguel Del Pozo 192 6.91 4.75 0.86 .313 90 111 4.66 0.1 Brian Adams
C.D. Pelham 263 7.28 6.31 0.81 .306 90 112 5.02 0.1 Mike Venafro
Chris Rowley 550 5.40 3.75 1.65 .303 79 126 5.76 0.1 Dana Kiecker
Wes Benjamin 399 6.00 3.52 1.86 .310 77 129 5.85 -0.1 Jason Cromer
Richelson Pena 488 5.38 2.48 1.99 .306 78 129 5.82 -0.1 Ryan Cox
Jack Leathersich 155 10.41 8.72 0.84 .305 84 119 5.15 -0.1 Mike Kinnunen
Adam Parks 208 7.63 3.72 1.76 .304 85 118 5.43 -0.1 Brian Wolfe
Zac Curtis 279 9.05 6.03 1.36 .303 85 117 5.36 -0.1 Scott Wiggins
Tim Lincecum 114 7.03 5.55 1.48 .307 81 123 5.70 -0.1 Jerry Johnson
Adam Loewen 216 9.40 8.00 1.00 .298 83 120 5.37 -0.1 Marshall Bridges
Kevin Jepsen 140 6.68 4.65 1.74 .284 80 125 5.73 -0.2 Ray Moore
Chris Tillman 464 5.31 4.50 1.53 .302 76 132 5.80 -0.2 Dick Fowler
Brandon Mann 254 6.79 5.30 1.49 .298 78 129 5.78 -0.3 Johnny Klippstein
Austin Bibens-Dirkx 450 6.25 3.08 2.08 .305 75 133 5.98 -0.3 Jared Fernandez
Ariel Hernandez 266 8.44 9.45 0.84 .303 78 128 5.81 -0.3 Hal Reniff
Rafael Montero 464 7.23 5.03 1.65 .321 74 134 5.72 -0.3 Ben Ford
Locke St. John 251 8.07 4.61 1.98 .302 78 128 5.91 -0.4 Chad Miles
Collin Wiles 481 5.47 2.36 2.19 .306 74 136 6.05 -0.4 John Gardner
Yohander Mendez 601 6.35 3.80 2.28 .302 70 143 6.46 -1.0 Doug Lindsey
Yoel Espinal 277 8.61 9.11 1.99 .305 64 157 7.36 -1.1 Earl Sanders

Disclaimer: ZiPS projections are computer-based projections of performance. Performances have not been allocated to predicted playing time in the majors — many of the players listed above are unlikely to play in the majors at all in 2019. ZiPS is projecting equivalent production — a .240 ZiPS projection may end up being .280 in AAA or .300 in AA, for example. Whether or not a player will play is one of many non-statistical factors one has to take into account when predicting the future.

Players are listed with their most recent teams, unless I have made a mistake. This is very possible, as a lot of minor-league signings go generally unreported in the offseason.

ZiPS’ projections are based on the American League having a 4.29 ERA and the National League having a 4.15 ERA.

Players who are expected to be out due to injury are still projected. More information is always better than less information, and a computer isn’t the tool that should project the injury status of, for example, a pitcher who has had Tommy John surgery.

Both hitters and pitchers are ranked by projected zWAR — which is to say, WAR values as calculated by me, Dan Szymborski, whose surname is spelled with a z. WAR values might differ slightly from those which appear in full release of ZiPS. Finally, I will advise anyone against — and might karate chop anyone guilty of — merely adding up WAR totals on a depth chart to produce projected team WAR.


Job Posting: Sports Info Solutions Video Internships

Please note this posting contains two positions.

Company Background:

Former Sports Info Solutions interns have risen rapidly through major league front offices after getting their start watching two to three games per day at SIS. In the words of one former intern and current Vice President of Baseball Operations, “My summer at [BIS] was the best baseball experience of my life.” Major league teams frequently come to us for recommendations when they need to fill a position within their organization, and SIS’ top interns each year routinely land team internships and/or full-time jobs.

SIS takes pride in making their internships great development opportunities for those looking to get their start in baseball. In addition to gaining invaluable experience watching thousands of players across different levels, they offer introductory classes that cover writing scouting reports and using the database management language, SQL. We also provide insight and advice from previous SIS interns who have branched out into a variety of areas in the sports industry.

Position: 2019 Minor League Video Editing Internship

Location: Coplay, PA

Description:
Sports Info Solutions is looking for highly motivated individuals with a desire to work in the baseball industry. In a new position for the 2019 season, SIS is looking for Minor League Video Editors, who will watch and clip video from Minor League games while validating the accuracy of pitch by pitch information. The end result of each Video Editor’s work will allow professional teams and other SIS clients to conduct advanced player and team analysis, specifically relating to advanced scouting and player development. Video Editors will have the opportunity to watch thousands of players across multiple levels of Minor League baseball, while also learning the ins and outs of the baseball statistics industry.

Responsibilities:

  • During overnight shifts, edit video from minor league games, properly marking in and out points for each pitch, ensuring all meaningful action is captured
  • Validate the accuracy of minor league pitch-by-pitch data
  • Assist with the production of the 2020 Bill James Handbook
  • Provide administrative support to the full-time staff

Time Frame:

  • The start date for this position is March 11th, 2019. This position will run through the end of the minor league season, with the last day of employment being Monday, September 2nd, 2019 (Labor Day).
  • This position will require relocation to Coplay, Pennsylvania; working remotely is not an option at this time.

Compensation:
A starting hourly rate of $8.00 and/or college course credit will be offered.

To Apply:
Click here to apply for the 2019 Minor League Video Editing Internship.

Position: 2019 Baseball Video Scouting Internship

Location: Coplay, PA

Description:
Sports Info Solutions is looking for highly motivated individuals with a desire to work in the baseball industry. Video Scouts will have a chance to make an immediate impression on the company. Each Video Scout will be collecting data that is directly used by SIS clients (including major league teams) for advance scouting and evaluation purposes. Not only will the Video Scouts become more familiar with the strengths and weaknesses of hundreds of amateur and professional players, but they will also learn the ins and outs of the baseball statistics industry.

Responsibilities:

  • Score and pitch chart MLB, MiLB and amateur games using specialized computer software
  • Check the accuracy and validity of data
  • Prepare and analyze statistical data for delivery to customers
  • Assist with the production of the 2020 Bill James Handbook
  • Provide administrative support to the full-time staff

Time Frame:
SIS offers two unique start dates for this position. The first begins February 4th, 2019. It will last for a period of four to five months into early June, with the possibility of extending further based on company workload and the Video Scout’s performance. The second begins on March 6th, 2019. This will last five to six months into early September, again with a possibility of extending longer.

Compensation:

  • A starting hourly rate of $7.75 and/or college course credit will be offered.
  • Each Video Scout will also be eligible for regular raises based on performance.
  • There will also be opportunities to sign up to work overtime to earn extra income (opportunities will depend on work levels throughout the year).

To Apply:
Click here to apply for the 2019 Baseball Video Scout position.

The content in this posting was created and provided solely by Sports Info Solutions.