There’s an idiom that gets thrown around in soccer that I wish we would adopt here: talismanic. A talismanic player is particularly important to his team, especially for intangible reasons. Sometimes the club’s talisman is the best player on the squad, but not always. He’s the captain who marshals the defense, or the creative passer who ties the team’s attack together, or a veteran forward who always seems to find the crucial late goal.
We don’t really have a word for this kind of player in baseball. We have club icons, cult heroes, and players with veteran presence, but referring to a player as a talisman implies actual mystical powers that only the team and its fans can truly see.
On April 15, Zach Neto was at the plate with one out and nobody on in the top of the fifth inning of the Angels’ game in the Bronx, where his team trailed the Yankees, 3-2. The first two pitches, a low changeup and a high slider, were nowhere near the zone, and Neto laid off easily. The 2-0 pitch from Luis Gil was another slider, this one about belt high and bending away from the right-handed Neto, who kept the bat on his shoulder and watched as the pitch appeared to clip the outside edge of the zone. Home plate umpire Lance Barksdale held up his hand. Strike one. Neto tapped his helmet immediately to challenge the call.
The graphic on the gigantic video board in center field showed that the pitch had missed by 0.4 inches. The call was overturned; the count was now 3-0. Neto walked on the next pitch. Mike Trout stepped in, took a fifth straight ball from Gil, then let a four-seam fastball over the heart of the plate get deep on him. He unloaded, clobbering the cookie 383 feet into the right field seats for a go-ahead two-run blast.
The no-doubt Trout clout would have been the decisive blow in an Angels win if not for a misplayed popup and a Jordan Romano meltdown. The Yankees walked it off on a José Caballero single, relegating Neto’s challenge to a footnote in that night’s game story, if it was mentioned at all. Even so, the gamble was an early example of how the new automated ball-strike challenge system can make the difference between winning and losing a game. Read the rest of this entry »
Top prospects like Jesús Made and Leo De Vries are among the game’s most exciting potential call-ups this season, but most of the players who make the majors in the next couple of months won’t be in the same galaxy as those guys when it comes to their potential. Some may be fringe prospects, others former standouts who fell off team lists — some may have even already been labeled journeymen or organizational players. Nevertheless, a good number of them will contribute in the big leagues down the stretch. Some of last year’s impact rookies, like Caleb Durbin, Isaac Collins, Joey Cantillo, Justin Wrobleski, and Chad Patrick, weren’t Top 100 prospects — most would have struggled to make a Top 500 list. Yet their production mattered, and you can point to a dozen players like that every year.
We’re still a month away from the trade deadline, but relatively few top-tier players are available and the ones who are won’t come cheaply, meaning many teams will have to look internally as they work to improve their rosters. Below, I’ve chosen seven players, either fringe prospects or guys who’ve fallen off the big league radar, who have some combination of projection, performance, improvement, or a pressing team need that makes them intriguing over the rest of the 2026 season. Naturally, this leaves out top prospects like Kade Anderson, who I absolutely adore, and even pretty good ones, like James Tibbs III. Let’s dig a little deeper. Read the rest of this entry »
The first feature I created as a FanGraphs developer, duties I added to my existing RosterResource work early last season, was the Coaches Table, which is located in the Breakdowns section of RosterResource. Since I haven’t done nearly a good enough job of publicizing its existence, I’ll atone by making it today’s Feature Focus.
Beyond the uniformed coaches that every team employs these days (manager, bench coach, often multiple hitting and pitching coaches, and base coaches), there are a couple of extra columns in the table that group coaches more broadly. The first is the “FC/QC/Catching” column. Many teams have a field coordinator (FC), quality control coach (QC), and/or catching coach, though not every team does, as some clubs prefer to spread those responsibilities around to existing coaches. The “Other Coaches” column covers every other uniformed coach who lacks a title that fits cleanly in one of the other columns. These are often coaches with generic titles like “Major League coach,” but not exclusively so. Miguel Cairo of the Orioles, for example, serves as the dedicated infield coach, a role usually taken by one of the base coaches in addition to his duties at first or third. Read the rest of this entry »
A friend of mine is a Tigers fan, God help him. He’s upset about baseball quite a bit these days, and the other night he was miffed about something specific: With two outs in the ninth inning and the tying run coming to the plate, Detroit manager A.J. Hinch pinch-hit with Jake Rogers.
Whatever else the Tigers’ backup catcher has going for him, he’s not a very good hitter. He’s hitting .155/.239/.276 this season, with a 30.9% strikeout rate. (All stats in this article are current through Tuesday’s games.) That’s a wRC+ of 42. Rogers had about a season’s worth of pretty good offensive production spread from 2021 to 2023 — like, a good Mike Zunino season, with a low-.200s batting average, a bunch of home runs, and a strikeout rate in the 30s — but overall he’s a career .198/.268/.380 hitter. He hasn’t batted .200 in a season in three years.
Sure enough, Rogers struck out on four pitches to end the game.
So yeah, it’s jarring to see that guy not only at the plate with the game on the line, but to come off the bench with the game on the line. Hinch put Rogers there on purpose, which seems like the work of a madman.
This is a free preview of a paid episode. To hear more, please visit our Patreon.
Ben Lindbergh and Meg Rowley discuss the backlash to MLB’s initial statement about the Giants’ objectors to Pride Night, the league’s subsequent expanded statement, and the facts about the policies and punishments (or the lack thereof) pertaining to uniform alterations. Then (37:10) they banter about the Blue Jays’ ballot dominance in early All-Star voting, the history of teams being overrepresented on All-Star rosters, the Mariners’ piggyback pitching plan, and Curtis Washington Jr. as the ultimate phantom ballplayer, answer emails (1:19:28) about where the next two-way player might come from and whether Pete Crow-Armstrong’s defensive value is underrated, and Stat Blast (1:31:56) about where franchise scoring records tend to be set, the biggest run differentials in games with equivalent times on base, days when one team outscored many other teams combined, Boston’s lack of late comebacks, and teams whose win totals did or didn’t match their WAR totals.
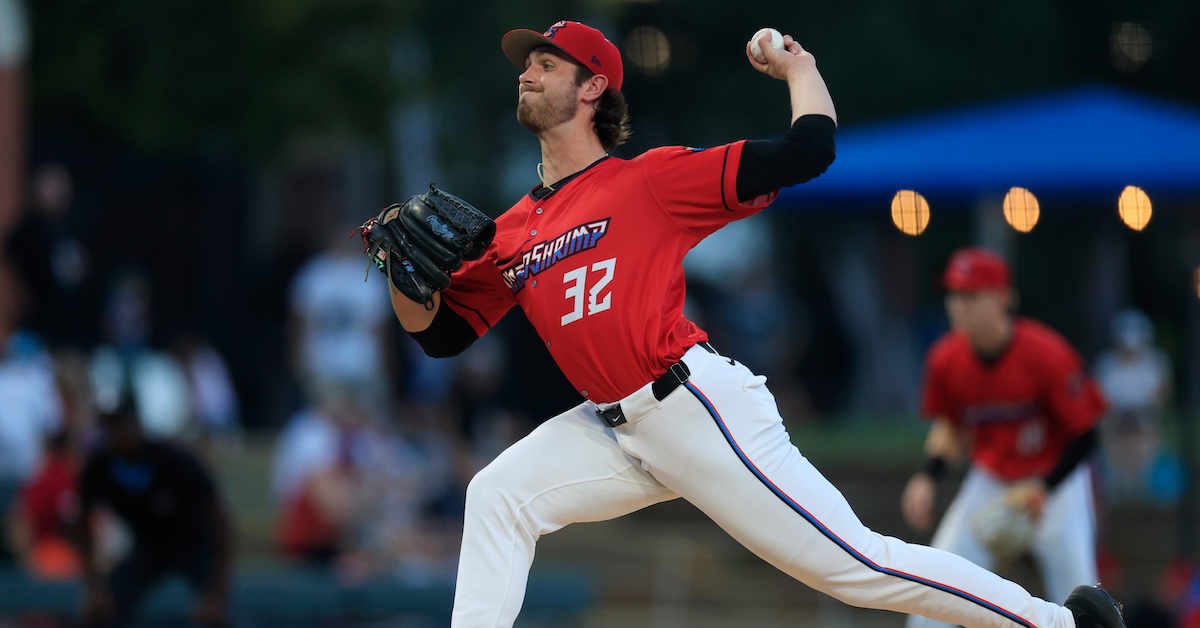
Thomas White Photo: Corey Perrine/Florida Times-Union/USA Today Network via Imagn Images
Below is an analysis of the prospects in the farm system of the Miami Marlins. Scouting reports were compiled with information provided by industry sources as well as my own observations. This is the sixth year we’re delineating between two anticipated relief roles, the abbreviations for which you’ll see in the “position” column below: MIRP for multi-inning relief pitchers, and SIRP for single-inning relief pitchers. The ETAs listed generally correspond to the year a player has to be added to the 40-man roster to avoid being made eligible for the Rule 5 draft. Manual adjustments are made where they seem appropriate, but we use that as a rule of thumb.
A quick overview of what FV (Future Value) means can be found here. A much deeper overview can be found here.
All of the ranked prospects below also appear on The Board, a resource the site offers featuring sortable scouting information for every organization. It has more details (and updated TrackMan data from various sources) than this article and integrates every team’s list so readers can compare prospects across farm systems. It can be found here. Read the rest of this entry »
Monday marked the one-year anniversary of the blockbuster trade that sent Rafael Devers from the Red Sox to the Giants in exchange for a four-player package. Neither team marked the occasion by throwing a party; mercifully, both were idle, and so didn’t sink further below .500. The deal hasn’t worked out well for either side, though it’s the Giants with an expensive and apparently declining slugger on the books. While Devers was fairly productive after being dealt last season, so far in 2026, the 29-year-old first baseman has surrounded one very good month (May) with a pair of miserable slumps that are just part of the reason the Giants are buried in the NL West standings.
We’ve told and re-told the story of the drama in Boston that led up to the Devers trade, but the streamlined version is that the signing of third baseman Alex Bregman bumped Devers off his natural position. After that, a lack of communication between the front office and the slugger — whose defense at the hot corner had eroded — exacerbated the team’s attempts to slot him first at designated hitter and then, after Triston Casas was injured, at first base, a position he had never played before and was reluctant to begin learning in-season. On June 15, 2025, the Red Sox sent Devers to the Giants for lefty Kyle Harrison, righties Jose Bello and Jordan Hicks, and outfielder James Tibbs III, with the Giants assuming the roughly $254 million remaining on Devers’ 10-year, $313.5 million contract, which runs though 2033.
The Red Sox were just 36-36 at the time of the trade, the Giants 41-30. Over the remainder of the season, the two teams’ fortunes reversed, with Boston going 53-37 and securing a Wild Card berth, just the team’s second trip to the postseason since winning the World Series in 2018, and San Francisco going 40-51 and missing the playoffs for the eighth time in nine seasons. Each team has changed managers since, with the Giants axing Bob Melvin in favor of Tony Vitello — the rare manager to make the jump directly from the college coaching ranks — last October and the Red Sox firingAlex Cora in late April. Those varying paths have led the two teams to similar spots: the Red Sox are 29-41, last in the AL East, while the Giants are 29-43, two games out of last place in the NL West. (Note that throughout this piece, stats from our site include those from Devers’ two plate appearances in Tuesday night’s suspended game against the Braves, while those from Baseball Savant do not.) Read the rest of this entry »
Chandler Simpson is fast. Being fast is kind of his whole deal. As a minor leaguer in 2024, Simpson stole 104 bases in 110 games. As a rookie in 2025, he stole 44 bases in 109 games. Then he stole 14 in his first 40 games of this season. If you watched Monday night’s nationally televised game between the Rays and the Dodgers, none of this is news to you. Simpson entered as a pinch-runner during a pivotal moment, and his presence instantly altered the gravity of the entire broadcast. ESPN’s cameras never left him, the commentators never stopped talking about him, and the Dodgers were so preoccupied with him that they barely had any focus to spare for the batters who came to the plate while he was on base. But Simpson never stole a base, and that’s likely not news to you either.
Simpson’s last steal came on May 11. That’s 28 games and more than a month ago. Over that time he’s been thrown out four times. On June 4, Marc Topkin of the Tampa Bay Times wrote an excellent article breaking down the circumstances behind the drought. Topkin used his own observations alongside first-hand explanations from Simpson, teammate Cedric Mullins, manager Kevin Cash, and first base/baserunning/outfield coach Corey Dickerson. Topkin noted first that Simpson has had fewer opportunities because he’s slumping at the plate. Since May 20, he’s running a .227 on-base percentage, the fourth-lowest mark among qualified players. Next, Topkin pointed out that Simpson’s downturn has roughly coincided with a downturn in Tampa Bay’s fortunes. The Rays have fallen behind early in games, putting them in situations where it doesn’t make as much sense to risk outs on stolen base attempts. Simpson and the rest of the Rays, though, were less focused on the circumstances and more focused on the intent of the opposition.
“I think the reason he’s in that funk right now is that teams have made a really impressive adjustment against him,” manager Kevin Cash told Topkin. “Every team we see, they were mindful. Now, they’re that much more mindful. We’re seeing pitchers alter their deliveries.”
Asked what opponents are doing to keep him tethered to the base, Simpson answered, “Everything. They’ve been pulling everything out. Slide-step (deliveries), quicker moves, pitchouts, random perfect throws on the money.” Monday night’s game provided an excellent example. Read the rest of this entry »